Share your thoughts
placeholder
Article
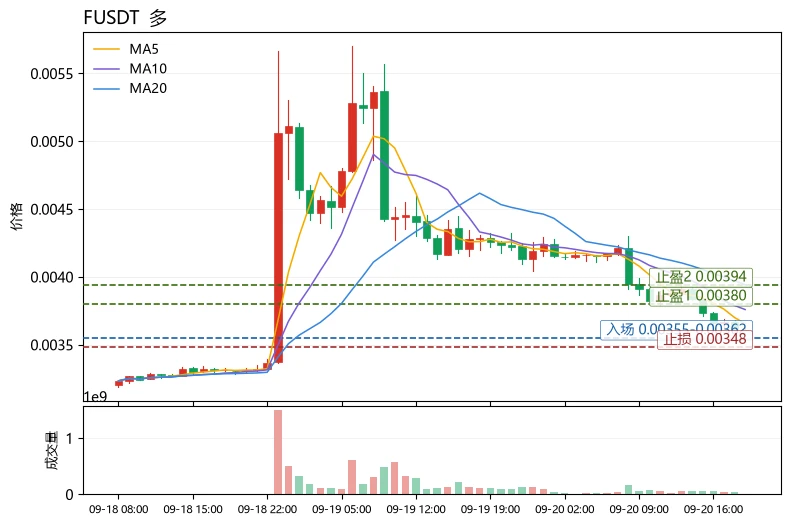
$F Short-term bullish, but only at the level of an oversold rebound, not a trend reversal.
Technically, FUSDT is currently at 0.003612, down 14.77% over 24 hours. MA5=0.0036558 remains below MA20=0.0039429, with the moving-average structure still bearishly aligned and medium-term pressure unresolved. However, the price has fallen near the lower Bollinger Band at 0.00351841, while RSI=31.3 is approaching oversold territory, indicating that the momentum for further short-term declines is weakening. The MACD histogram at -3.943e-05 remains negative, but combined with the approximately 24.65% ampl
post-image
RAY-9.04%
SYN-14.52%
Bitcoins market capitalization surpasses Teslas, returning it to the top 15 globally.
live-cover
LIVE1,667
Nobody is talking about the quiet move forming in SUI right now.

$SUI /USDT - SHORT

Trade Plan:
Entry: 0.8122 – 0.8200
SL: 0.8532
TP1: 0.7883
TP2: 0.7698
TP3: 0.7419

Why this setup?
Why now? The 1h price is pinned at 0.8161 inside a tight 1h ATR of 0.01545, meaning the next impulse will be sharp. The 15m RSI at 39.24 confirms sellers are exhausted but not yet reversing. The daily trend is range, which favors fade trades into the edges. Entry sits between 0.8122 and 0.8200, targeting TP1 at 0.7883 and TP2 at 0.7698 on the downside. The invalidation level at 0.7827 is the hard line that pr
SUI-4.83%
Financial News, Crypto Market Updates, Real-World Strategies
live-cover
LIVE1,031
  • 1
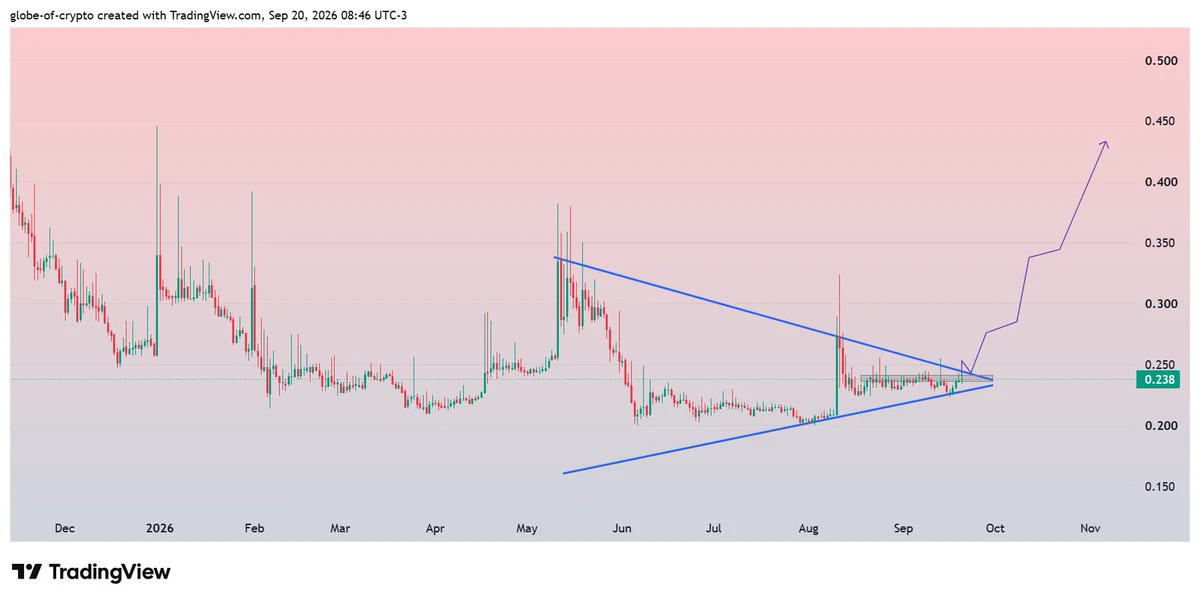
$RAD #RAD
Preparing for breakout of a multiple resistance zone from verge of Triangle.
Breakout could trigger a solid rise in accordance with our projected move✍️
post-image
RAD+0.71%
$JTO This coin will correct a bit, then soar upward.
Buy: 0.49600, 0.48800. Targets: 0.50850, 0.52000, 0.53500. Stop loss: 0.47800.
post-image
JTO+8.64%
$ONE Something is off with this data. The 24-hour low was 0.0023, the high was 0.0052, the amplitude hit 126%, and it closed at 0.0040, up 54%. Look at the trading volume: 828.9M. A coin priced at 0.0040 traded more than $800 million in a single day. This is not something retail traders can pull off.
There are three possibilities. First, big money accumulated near the bottom around 0.0023, then pushed it to 0.0052 to test the market. The current 0.0040 is a pullback for confirmation. Second, it was a short-term pump driven by news, followed by an exit. The spike to 0.0052 was the trace left by
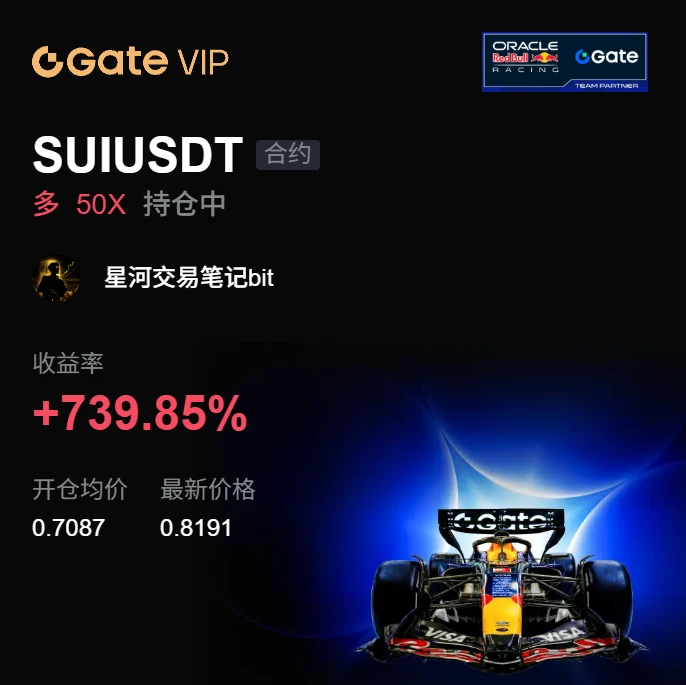
This $SUI long position has been held until now not by guessing the direction, but by confirming the pullback above 0.7087. When the price first surged to 0.8162, I did not chase it. I waited for it to pull back without breaking the short-term moving average, then added to the position as planned. Current unrealized profit is +731.01%.
Structurally, the moving averages are beginning to fan upward, but what really matters is that the key level at the previous high has not been fully cleared. As long as the price remains above the key pullback level, the bullish structure remains intact; if it
post-image
SUI-4.83%
BNB-1.99%
LAB-2.16%
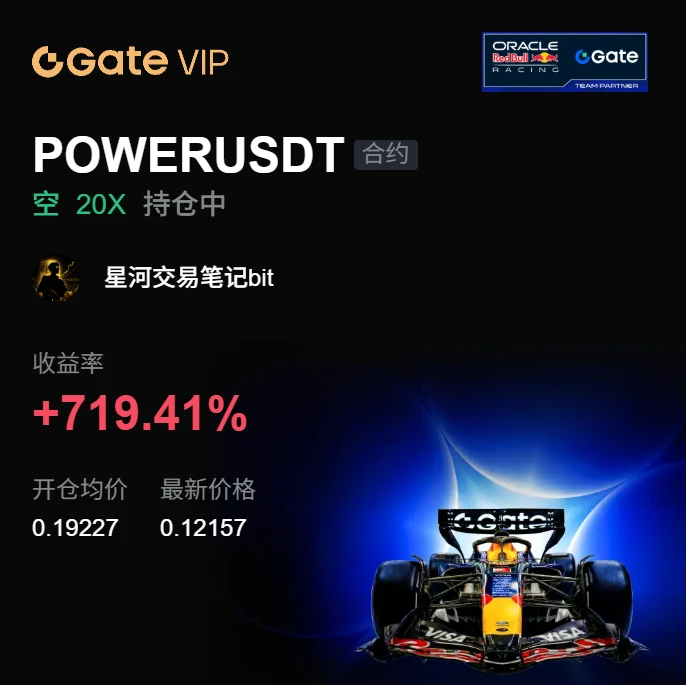
I entered this $POWER short position around 0.19227. There was a round of wick sweeps in between, but the structure held, so I kept holding until now, currently sitting on an unrealized profit of +719.61%.

My bearish view at the time was not based on guessing the top. After the price surged to the previous high, volume clearly contracted, and the upper wicks were repeatedly rejected, showing that real selling pressure existed above. As long as the rebound fails to reclaim the previous high, the bears still have the initiative.

The 0.12195 area was the lower boundary of the previous range.
post-image
POWER+3.65%
BNB-1.99%
ADA-2.64%
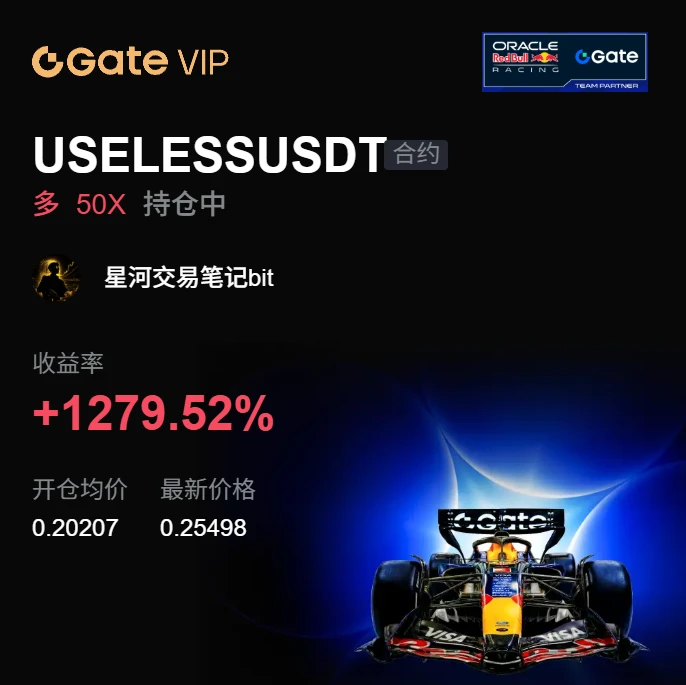
This $USELESS long wasn’t a chase; I entered only after the breakout and retest were confirmed. The price reached 0.25609, with an unrealized gain of +1293.12%. I’ll take care of 70% first, and watch the protection level for the remaining 30%. I won’t chase if I miss it. 📈
There were two technical reasons: after the previous high was broken with increased volume, the retest did not fall back into the range, turning the key level into support; the moving averages were in a bullish alignment, with healthy price-volume action—volume increased on the rise and contracted on the pullback, with no h
post-image
USELESS-4.11%
BNB-1.99%
DOGE-3.71%
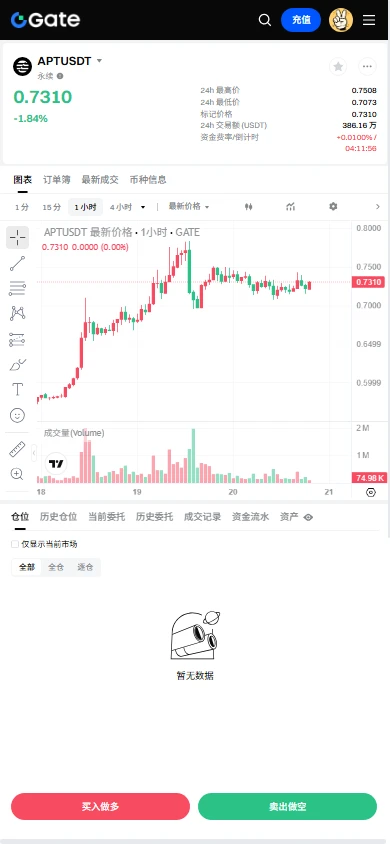
$APT Signal】Long | End of 1H Bollinger squeeze, supported by moving averages
$APT The 1H Bollinger upper and lower bands have compressed to 0.7135—0.7405, with bandwidth narrowing to an extreme and a volatility shift approaching. The current price of 0.7274 is hugging EMA20 (1H) at 0.7256, while EMA50 (1H) at 0.7059 is rising step by step. The order book buy ratio is 0.48, with depth imbalance at -34.92%, and sell orders are denser above. 4H RSI is 63.10, while the MACD histogram at 0.0009 continues to contract, indicating slowing upward momentum.
🎯Direction: Long
⚡Entry/limit order: 0.72521
post-image
APT-2.43%
For those without money, farming an airdrop every 2–3 days is pretty good too. Have a pig’s feet rice meal, and you can farm 10 orders a month, 12u per order; you only need to generate 20,000 in trading volume per day.
Everyone's ignoring ZEC while it's quietly building a massive long setup.

$ZEC /USDT - LONG

Trade Plan:
Entry: 1434.79 – 1445.99
SL: 1386.64
TP1: 1480.70
TP2: 1507.58
TP3: 1547.89

Why this setup?
Why now? The daily trend is firmly bullish, giving us the higher-timeframe tailwind that most setups lack right now. The 15m RSI at 45.63 shows room to run without being overextended, meaning we are not buying exhaustion. The 1h ATR of 22.395024 tells us enough volatility exists to push toward TP1 at 1480.70 and TP2 at 1507.58 from an entry zone of 1434.79 to 1445.99 around the 1h price of 1440.
ZEC-6.34%
Exactly one year ago @MadLads @Backpack
post-image
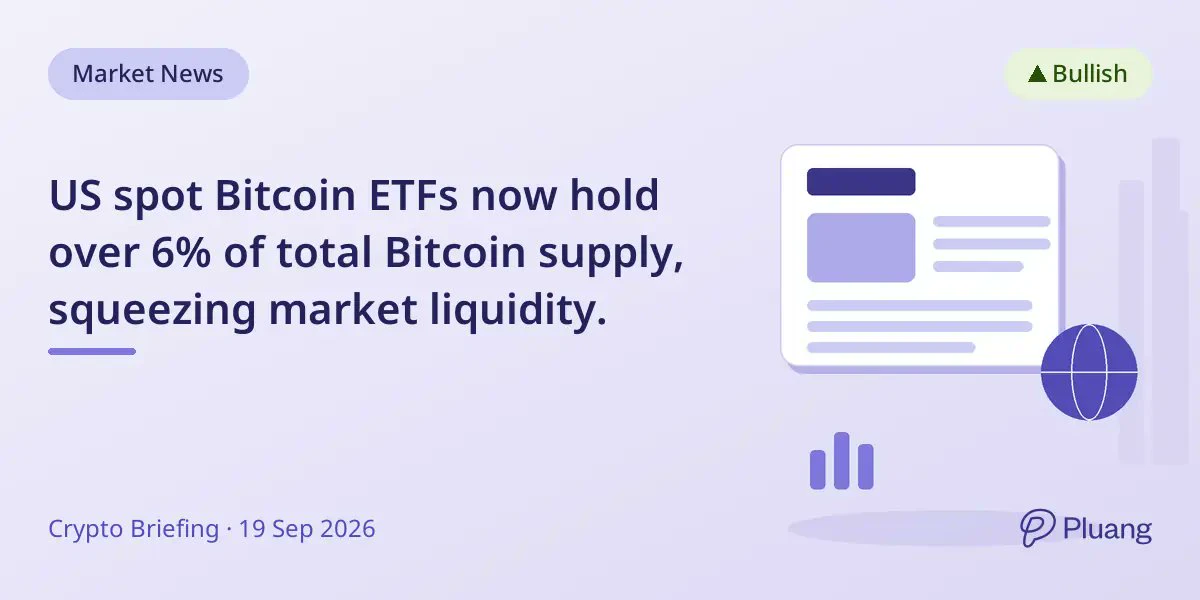
US spot Bitcoin ETFs now hold over 6% of the total $BTC supply.
That's roughly 1,250,000 BTC locked in ETF vaults, effectively removed from open market circulation.
post-image
BTC-1.01%
Ride the trend upward; opportunities always go to those who prepare in advance.
Pi Life
🔥 The community remains active
📊 Market data changes in real time
🚀 The low-market-cap sector is worth continued attention
Contract address:
0xeaa7665193efa6a3cd0d10867e0e9ae60e6d7777
Don’t blindly follow the crowd; do your own research and make your own judgment.
post-image
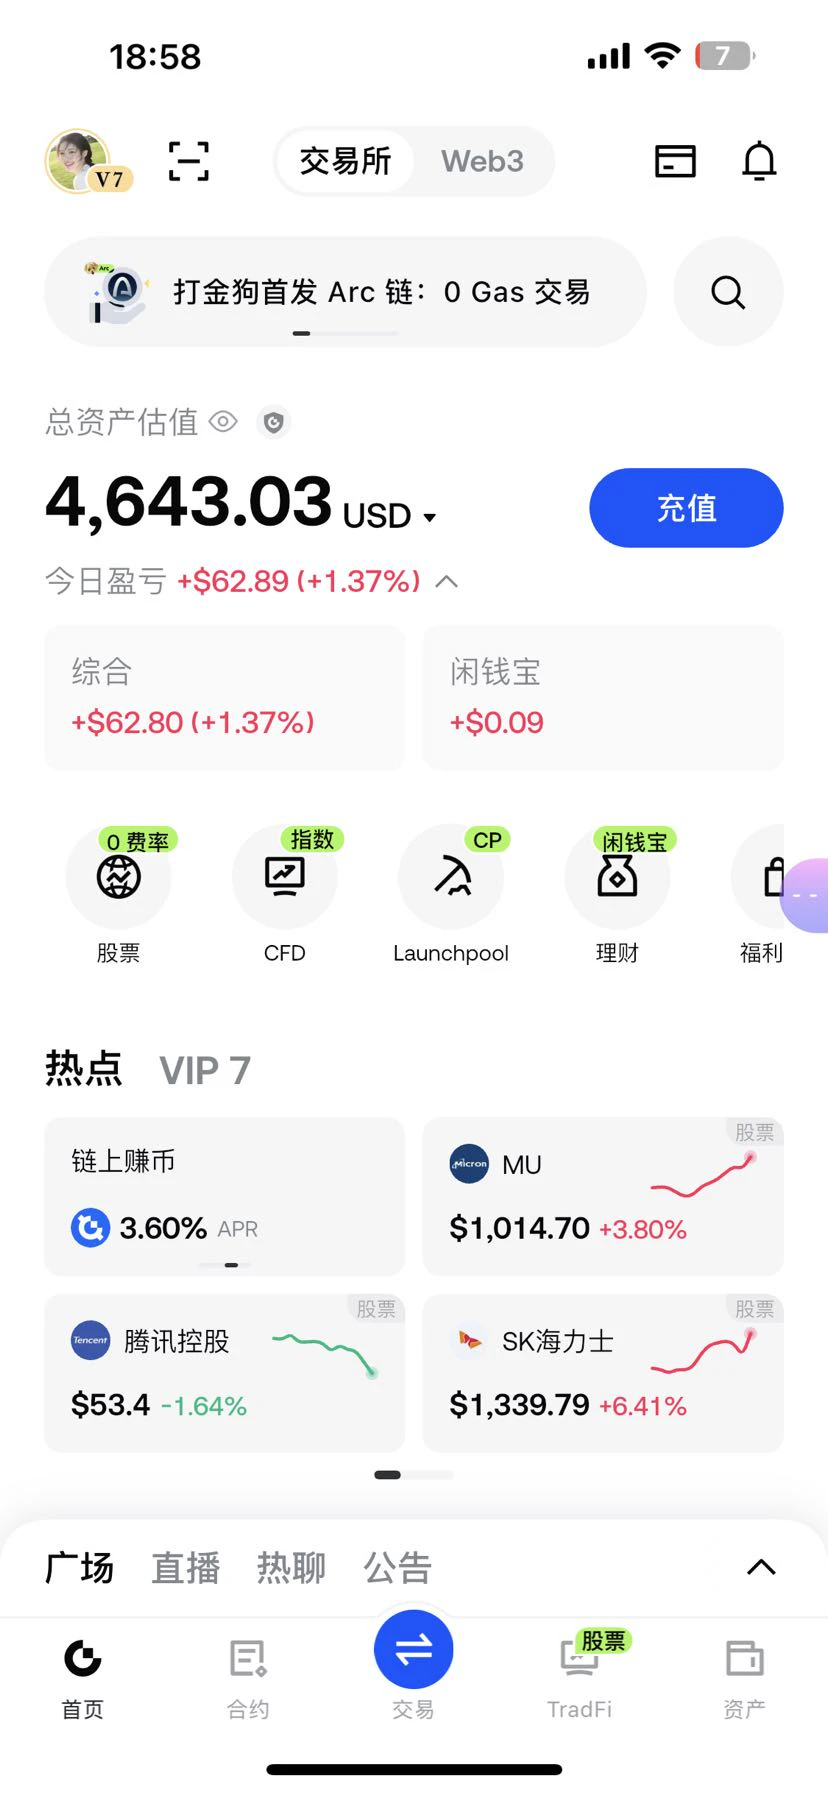
Sixth day of steady profits: $30 in one day. Not holding AKE cost me around $2,000 in gains—I feel a bit embarrassed.
post-image
AKE-16.77%
#美股AI概念股全线反弹
#Gate广场中秋团圆局
US AI Stocks Rebounded Across the Board: The Start of a New Leg Higher or Just a Short-Term Bounce?
Thursday, September 17, 2026 was the session that reset the mood on Wall Street. The Dow Jones Industrial Average added 316.14 points, equal to 0.61%, to close at 51,778.04. The S&P 500 rose 1.14% to 7,637.76. The Nasdaq Composite jumped 1.69% to 26,418.30, its strongest single-day advance of the month. All three major indexes closed higher together, and the leadership came from artificial intelligence rather than defensive sectors. Friday added a quieter follow-throu
post-image
  • 8
  • 1
GM if you GM back!
post-image
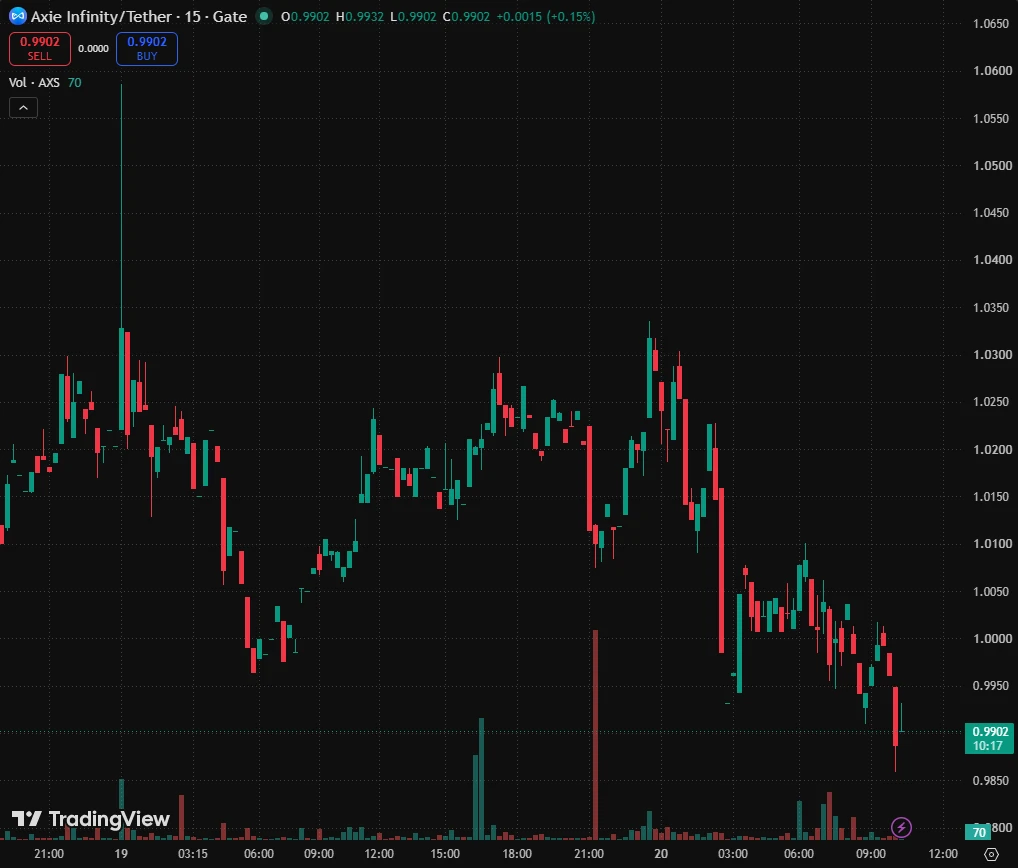
$AXS axsusdt short
INSTRUCTIONS TO READ AND TO FOLLOW:
Entry point: yellow
Stop loss: red
Take profit: green or blue
Leverage x 5-10-20 for crypto
Leverage x 20-50-100 for commodities, stocks, indices, and forex
Margin 1-5% max:
This limits your maximum loss to 5% and guarantees that you retain 95% of your portfolio in the event of a stop-loss.
ALWAYS PRACTICE RISK AND MONEY MANAGEMENT:
Invest a maximum of 5% on any trade or across all your trades.
Invest only what you can afford to lose, as no one is in control of the market.
I repeat: this limits your maximum loss to 5% and guarantees—or rat
post-image
AXS-3.11%
Load More

Join 40 M users in our growing community

⚡️ Join 40 M users in the crypto craze discussion

💬 Engage with your favorite top creators

👍 See what interests you

Trending Topics

MSTRTopsNasdaq100

73.81k Views2.83k Discussing

Strategy (MSTR) has gained about 48% over the past month, making it the best-performing stock in the Nasdaq 100, while Bitcoin rose roughly 12% over the same period. The company holds 845,050 BTC with a cumulative cost basis of about $63.73B. MSTR is not a pure Bitcoin proxy — its price swings can be more extreme. Can this rally last?

Gate Tops 24H Net Inflows Among Exchanges

26.33k Views3.67k Discussing

BTCRetakes80K

56.85k Views60.29k Discussing

View More