Square
Following
Hot
News
Profile
Share your thoughts
placeholder
Article
CPI Comes in Hotter Than Expected
live-cover
LIVE14
$NEAR The most interesting thing right now is not guessing whether prices will rise or fall, but seeing who is forced to change their tune first.
The bulls’ test is at 5.44, while the bears’ test is at 4.527. $NEAR is currently at 5.392, up 11.96% in 24 hours. One-hour support is 4.527, resistance is 5.44, and current volume is 0.31 times the average volume of nearly 20 bars.
For now, I’ll note that $NEAR remains strong, while the crowded positioning is already out in the open. I acknowledge that the trend is strong, but what matters next is not how much higher it can surge, but whether anyone
post-image
$OP
This move is pushing from 0.1397 toward 0.1418, up more than 13% over the past 7 days, while open interest is piling up as longs keep adding and driving it higher🚀 The wildest part is that shorts are effectively paying to stay in, having to hold on while funding remains negative. The pressure isn’t a bad thing—it’s an early-entry position. Break through 0.1418 and jump aboard.
post-image
OP+0.48%
Everyone watching SYMBOL long is about to get blindsided by a sharp drop.

$MU /USDT - SHORT

Trade Plan:
Entry: 927.98 – 934.84
SL: 964.38
TP1: 906.68
TP2: 890.19
TP3: 865.47

Why this setup?


Debate:
Are we testing TP2 or is 994.50 about to flip this setup?

⚠️ Personal market analysis only. NFA — manage risk and DYOR.
Educational content, not investment advice or a recommendation to buy, sell, deposit, or withdraw any asset. No paid promotion or referral/affiliate links.
MU+2.12%
Continue adding to long positions on $DASH here. 💪Entry range: 49.57 - 49.82Target profit 1: 52.10Target profit 2: 54.02Invalidation level: 48.08DASH is showing strong recovery momentum and has reclaimed the 1-hour MA99 resistance at 50.01. The 15-minute chart remains clearly bullish above the MA7 and MA25, so the current setup favors an attempted breakout, targeting the 50.50 liquidity zone. Trade 👇👇👇 hereHot coins: $SIREN : Current price 0.03206 - 24-hour gain: +44.09%$SOL : Current price 105.91 - 24-hour gain: +1.07%
post-image
DASH+2.02%
SIREN+5.45%
SOL+1.16%
$SKHY
The memory market is straight out of the hog cycle: prices rise, capacity expands; capacity expands, the market crashes; the market crashes, production is cut; production is cut, prices surge again. The entire industry is now pushing hard to ramp up production. If AI demand can’t outrun capacity, beware of the accelerated version of “storage means death” turning into “storage means king.” Those holding positions should wait for the November earnings reports, sell into the rebound, and keep something in reserve. Spend less time scrolling short videos—the sentiment is even more volatile th
post-image
SKHY-0.94%
$INJ ‌ has flipped the momentum, and buyers are back in control.
After dipping to $7.061, INJ has rallied to $8.56, reclaiming key levels with a strong hourly breakout. The Supertrend has turned bullish at $7.81, adding strength to the setup.
Key levels:
Support: $8.25–$8.30
Stronger support: $7.80–$7.95
Resistance: $8.56–$8.63
Targets: $8.80 → $9.00
A clean break above $8.56 could extend the move, while holding above $8.25 would keep the recovery structure healthy. After this sharp rally, a retest would be constructive.
INJ is looking stronger. Now it needs to turn this breakout into sustai
INJ+10.95%
NVDA-1.92%
  • 2
GOLD 🥇
live-cover
LIVE377
BTC is currently around 82400; after the previous pullback, it has staged a short-term corrective rebound, but the upside follow-through is weak. This is a technical recovery after the decline, with no trend reversal signal appearing for now. The broader structure remains range-bound with a bearish bias.

On the 4-hour chart, the price is below the moving averages, and rebound volume is insufficient, indicating a weak consolidative recovery. The overhead resistance zone is substantial. As long as the price fails to firmly hold above resistance, this rebound is more likely to be a continuation
post-image
BTC+0.47%
Does a bullish moving-average alignment always mean you should chase long positions?
Not necessarily. The key is whether the price’s position relative to the moving averages is synchronized with momentum. Take $ZEC as an example: the current price is 1235.97, with MA5=1225.24 above MA20=1138.62, forming a standard bullish alignment and indicating a healthy trend direction; however, RSI has reached 70.2, nearing overbought territory, while the price is hugging the Bollinger upper band at 1248.36, making the risk-reward of chasing short-term highs unattractive. A reusable approach is: use movin
post-image
ZEC+9.10%
XPL+7.13%
INJ+10.95%
On watch tomorrow $MSFT $GOOGL
post-image
MSFT+1.04%
GOOGL+0.37%
Many people see the funding rate turn positive and MACD turn green and automatically assume “the bulls are back,” then chase in with oversized positions—this is the most common position-sizing mistake: treating indicator direction as an entry signal while ignoring the moving-average structure and volatility levels. $BERA is a textbook example of this trap.
First, the structure: current price 0.2284, MA5=0.2311 remains below MA20=0.231595, and the short-term moving average has not crossed above, meaning the bearish alignment has yet to be repaired; RSI=47.3 is stuck in the neutral-to-weak zone
post-image
BERA-6.12%
solana:7b6dX3nE25xrfNViEKZHL9wVJFcBxQYuWPpmzHUxx28H 🥀 Zero or Hero there is no in between
7b6dX3nE25xrfNViEKZHL9wVJFcBxQYuWPpmzHUxx28H
#Crypto #memecoin $sol
post-image
SOL+1.16%
$LYN
📉 Open interest has fallen flatter than my wallet, I'm dying laughing😂 This wave of bearish pressure is enough to crush a camel, but I refuse to believe it and will tough it out to the end💪 LYN's price action is just like an overworked employee who stays up late working overtime but still can't get a raise—frustrated but stubborn😤 Patiently wait for the wind to come; it should be about time for a rebound, so don't rush to admit defeat😌
post-image
LYN-5.89%
Trade is actually an old script. In the 1980s, Japan’s economy was at its peak, with GDP reaching nearly 70% of the United States’, while its semiconductor industry was putting immense pressure on the US. Japan also wanted to improve relations with China and bring China in to counterbalance the US. What happened? The US launched a combination of measures: the 1985 Plaza Accord forced the yen to appreciate; the 1986 US-Japan Semiconductor Agreement forced Japan to open its market and restricted its exports; and the constraints of the US-Japan security alliance kept Japan firmly in line. From th
post-image
AAPL-0.31%
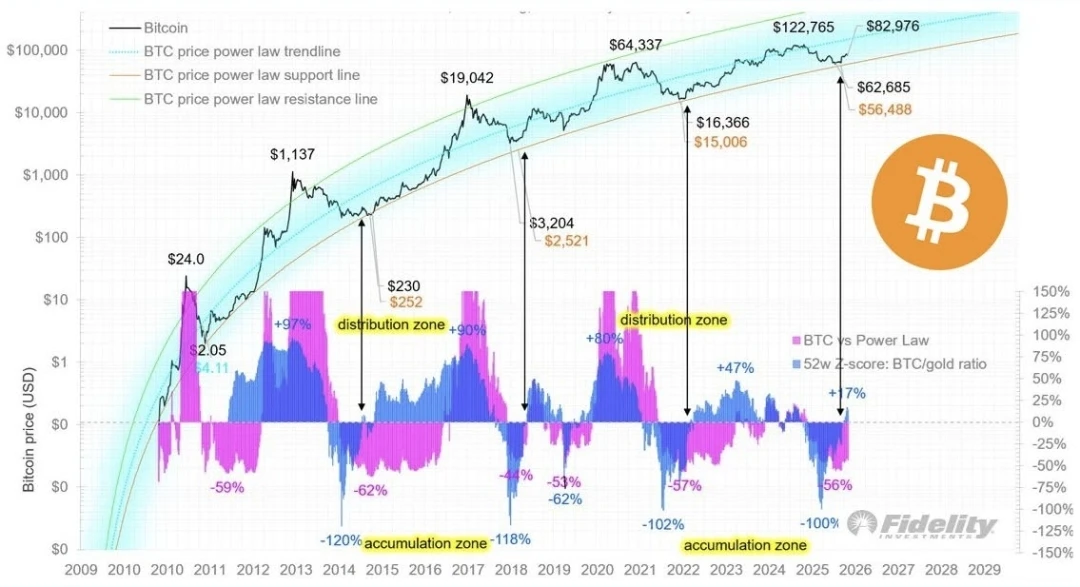
Bitcoin is BACK over $82,000!!
We are so back!!
post-image
BTC+0.46%
LayerZero built Akita, a post-quantum proof scheme, with researchers from a16z crypto, Carnegie Mellon and USC. Its first deployment will be in Jolt, the prover behind the Zero blockchain, with proofs 2x to 3x faster.
@LayerZero_Core
ZRO+9.59%
$AKE I've been positioning for a long time, and it has finally taken off. I'll sell everything once it doubles.
post-image
AKE+23.82%
SOL oscillated downward from the earlier high of 124.99, with the intraday low dipping to 100.51 before a slight rebound, reaching a high of 106.49. This rebound is merely a minor corrective bounce during the decline; the overall broader downtrend channel remains intact, and a rebound to resistance presents an opportunity to enter short.

From the chart, the daily highs have been gradually moving lower, and the bearish trend structure remains intact. This rebound is only a brief pause amid the decline. MACD remains weak and trending downward, while heavy pressure from previously trapped posit
post-image
SOL+1.14%
If I could leave just one note for $FIL today, it would be: don’t let +7.87% make the decision for you.
What’s really worth discussing is that $FIL remains strong, while the crowded trade is already out in the open. $FIL is currently at 1.172, up +7.87% over 24 hours. The 1-hour support is 0.9999, resistance is 1.1774, and current volume is 0.61 times the average volume of nearly 20 bars.
The 1-hour trend is strong, with RSI at 78; the 4-hour trend is strong, with RSI at 56. This combination makes me temporarily accept the following interpretation: I acknowledge that the trend is strong, but
post-image
FIL+8.61%
Load More

Join 40 M users in our growing community

⚡️ Join 40 M users in the crypto craze discussion

💬 Engage with your favorite top creators

👍 See what interests you

Trending Topics

USSeptemberPPIBeatsExpectations

91.35k Views1.88k Discussing

US September PPI came in at 6.3% YoY, well above the 5.3% market expectation, pointing to renewed producer-side inflation pressure. Weekly jobless claims were 199K, broadly in line with forecasts. Could hotter inflation further reduce room for rate cuts, and what does it mean for $BTC, US stocks, and gold?

DrLinHanSpeaksAtOxfordUnion

135.63k Views1.86k Discussing

JapanAndKoreaStocksPlunge

47.27k Views1.76k Discussing

View More