Square
Following
Hot
News
Profile
Share your thoughts
placeholder
Article
[New Streamer] rewardFollowers 27:45 LIVE host_avatar blackuelyramoon 3,659 Followers Nvidia Reclai
live-cover
LIVE3,939
ETH Short-Squeeze Rebound: Primarily Liquidation-Driven, with Weak Follow-Through from Spot Funds
ETH’s intraday price volatility reached 6.89%. Total liquidations across the market over 24 hours were 209 million, of which short positions accounted for 126 million, or 60.33%, showing the market’s typical short-covering-driven characteristics.
Liquidations peaked between 23:00 and 00:00 on November 4, with the largest single liquidation nearing 38 million. Current liquidation volume is 1.9 times the 7-day average, putting short-term sentiment in an extreme range, but it is only 0.59 times the 3
ETH-1.23%
Trenches
ZIG
Z
bade
b
ZIG
0x8c...1145
Market Cap
$.
Change
.
24h Vol
$.
Holders
.
BTC
B
bade
b
BTC
C5xp...pump
Market Cap
$.
Change
.
24h Vol
$.
Holders
.
HIGH
H
bade
b
HIGH
7ymF...high
Market Cap
$.
Change
.
24h Vol
$.
Holders
.
STONK
S
bade
b
STONK
6GmA...UNgx
Market Cap
$.
Change
.
24h Vol
$.
Holders
.
CORLA
C
bade
b
CORLA
0xba...7777
Market Cap
$.
Change
.
24h Vol
$.
Holders
.
GM ☀️
I hope your day will be as great as you are
post-image
🔹Chip Stocks Are Falling, but Demand Hasnt Weakened? With Democratic Regulatory Expectations Shakin
live-cover
LIVE2,632
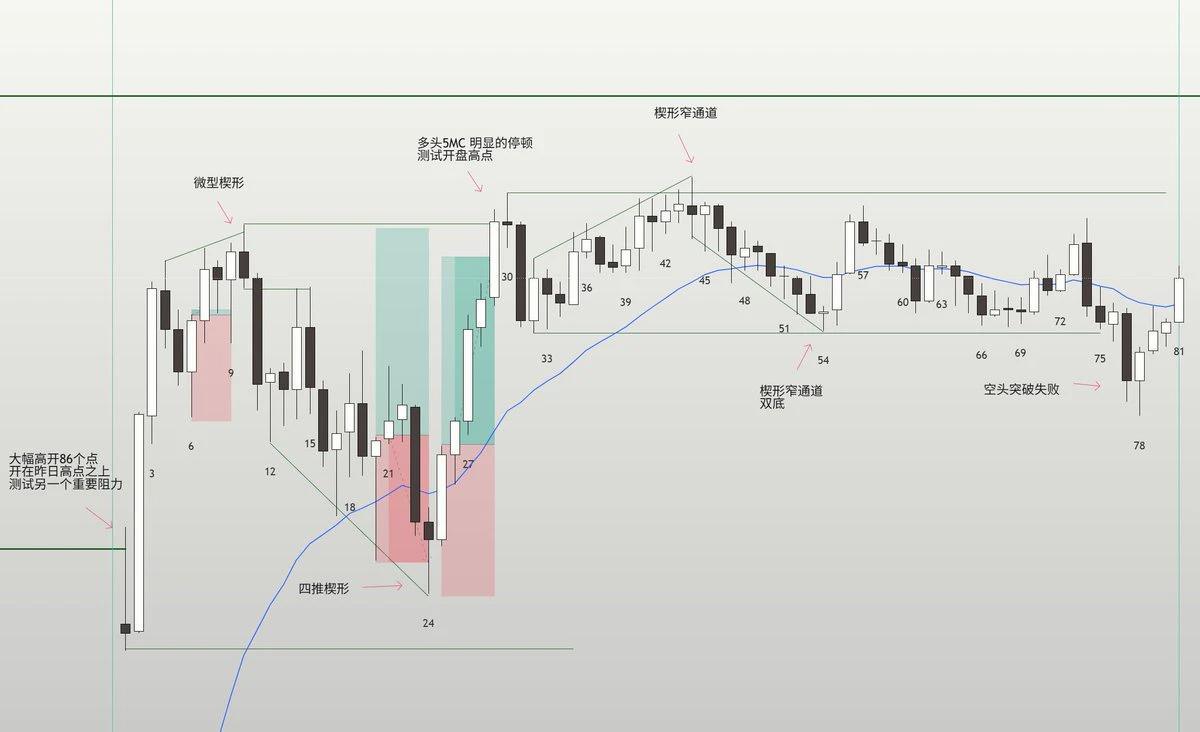
November 4 MES Review Exercise
post-image
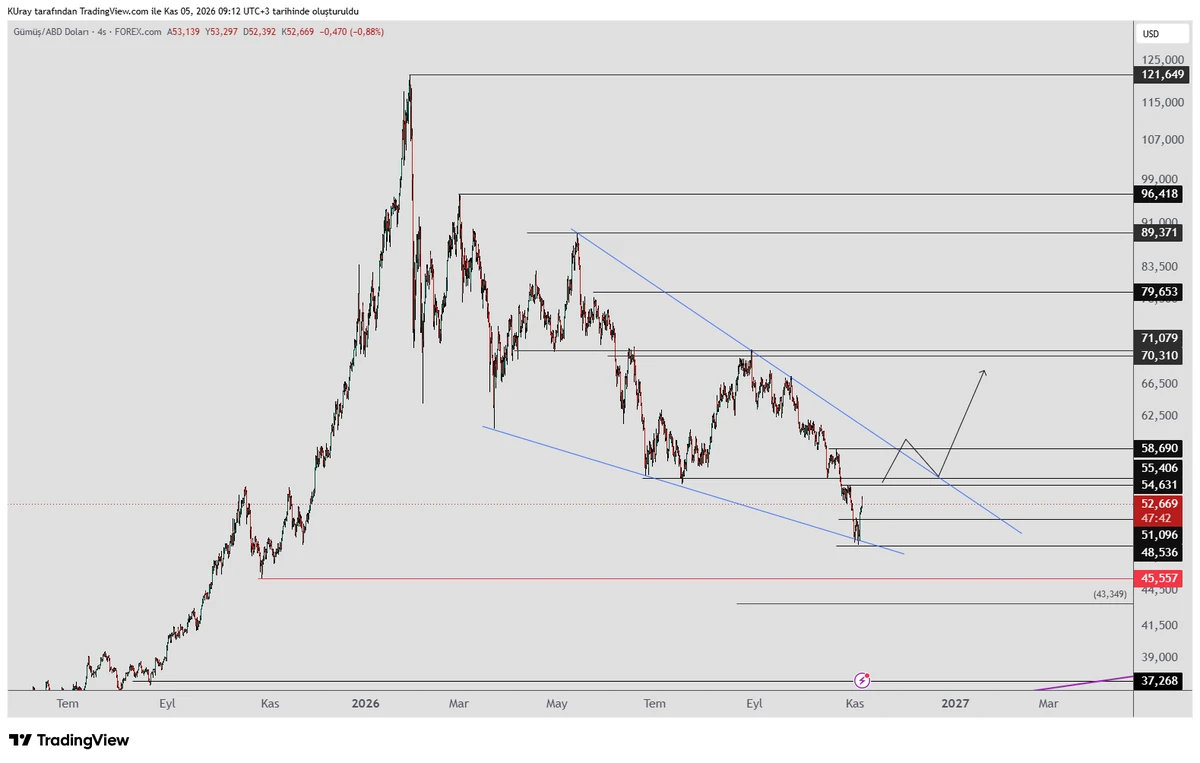
#xag #Gümüş formed a wedge while falling. Buying in response came in at the wedge’s lower edge. If the rise continues and it closes above 59, the wedge’s upper edge will have been broken, potentially opening the way to test higher resistance levels.
As long as the 48.5 low holds, the wedge setup remains in play.
Since it also broke through the 51 resistance we were watching yesterday, it could rise toward the 54-55 resistance.
If it does not close above the 54-55 zone, the decline could resume, confirming that the rise was a reaction to the decline.
If it closes above the 54-55 zone during th
post-image
XAG+0.47%
$UNI Is Moving Higher on Low Volume—How Long Can This Move Last?
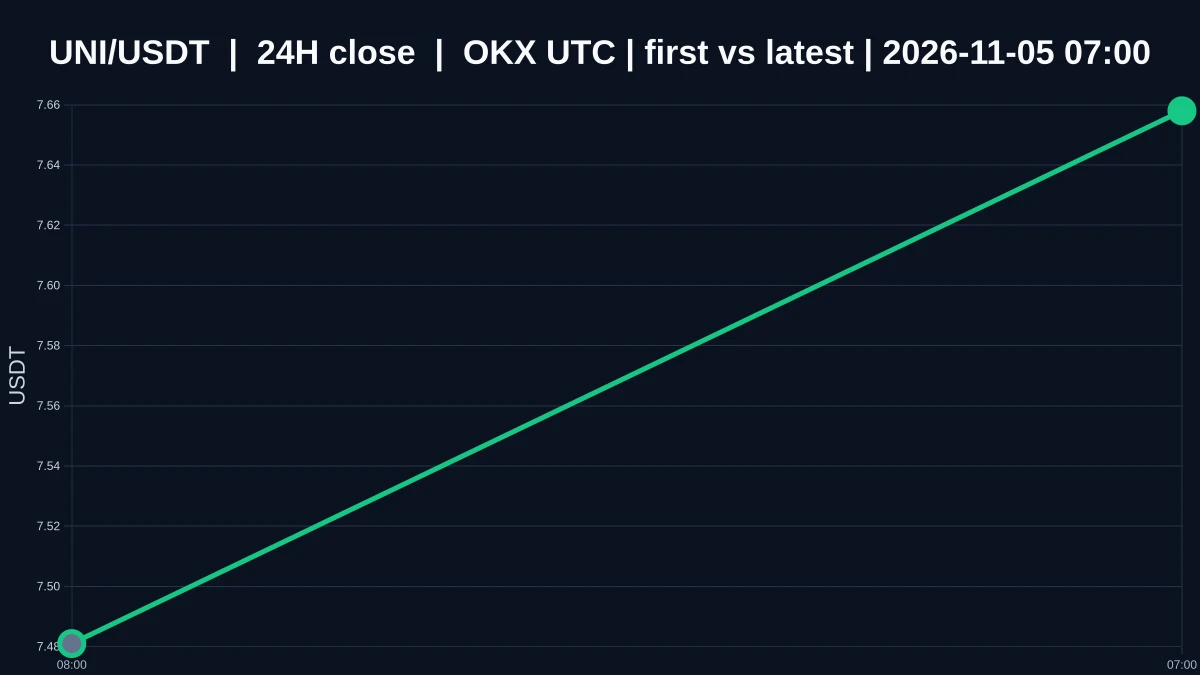
$UNI is currently priced at 7.667, up 4.355519259561724% over 24 hours, with an intraday high of 7.82 and a low of 7.255. The 1-hour and 4-hour trends are both leaning bullish, so at first glance, the direction appears consistently upward. But the 1-hour volume ratio is just 0.01884556425460747, indicating extremely low trading participation. The price has moved, but volume hasn’t followed. At times like this, focusing only on the color of the candlesticks can easily lead you to overestimate the move’s staying power.
The directio
post-image
UNI+3.05%
What Is Out-of-Sample Testing? Why Can Data Not Used to Optimize a Strategy Better Test Its True Capabilities?
In cryptocurrency trading, a strategy may perform well in historical backtests yet quickly fail in new market conditions. The problem may not necessarily lie in the trading logic itself; the strategy may also be overfitted to the historical data used for optimization. Out-of-sample testing is an important way to identify this issue.
First, what is out-of-sample testing?
Out-of-sample testing means using data that was not involved in strategy development or parameter optimization to in
post-image
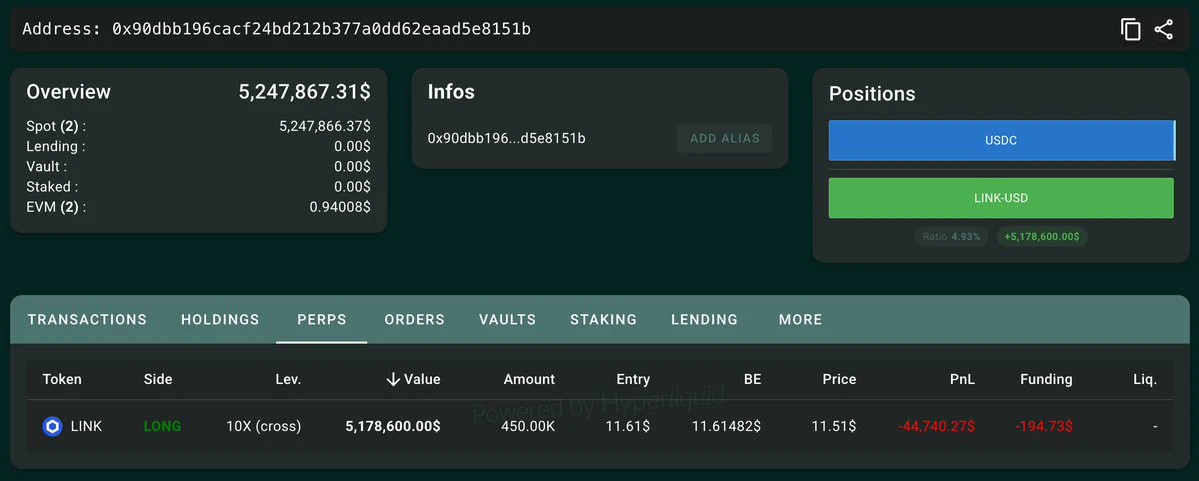
Someone opened a 10x long on 450,000 $LINK ($5.18M) 2 hours ago.
post-image
The good news: it’s an artifact from after the Han dynasty.
The bad news: it’s one of the nine plugs used in burials.
The last opening—just plugged.
The old man says he uses it to pick his teeth every day.😂😂😂
11.5 Midday Analysis$BTC
After a sharp rally yesterday, Bitcoin has now entered a consolidation and recovery phase. The lower Bollinger Band is providing support, bearish MACD momentum has eased somewhat, and the KDJ has turned upward from low levels. The broader weak trend is gradually improving, and the current pullback can be viewed as a healthy confirmation during the bottoming process. The room for an upside rebound deserves close attention.
After pulling back to its low on the 4-hour chart, the price stabilized and moved higher. The Bollinger Band channel is gradually rising, MACD volum
post-image
BTC-0.65%
#USEarningsSeason $AAPL $QCOM $AMD $PLTR
Four of the biggest AI linked names reported this week, and the pattern is more interesting than any single number. All four beat on the headline, and three of the four still got sold. Here is how I read it.
Beat and sell is the new normal
Apple earned $2.10 a share against $1.99 expected, and revenue rose 12% to $114.5 billion. Palantir grew revenue 96% to $2.31 billion, about 6% above estimates. AMD reported $13.38 billion against $13.06 billion expected, with data center sales up 97%. Qualcomm also topped estimates. Yet Apple fell, Palantir fell and
AAPL+0.32%
QCOM-4.32%
AMD-3.55%
PLTR-1.05%
  • 2
Imagine qualifying for a privacy projects airdrop by handing over ur entire financial history
id want @primus_labs to make that unnecessary if an airdrop happens
prove the required activity
return whether i qualify
leave everything unrelated out of it
using selective proofs for the distribution itself would make the privacy message feel very real
no idea whether thats their plan but that would get my attention
post-image
AIRDROP+0.00%
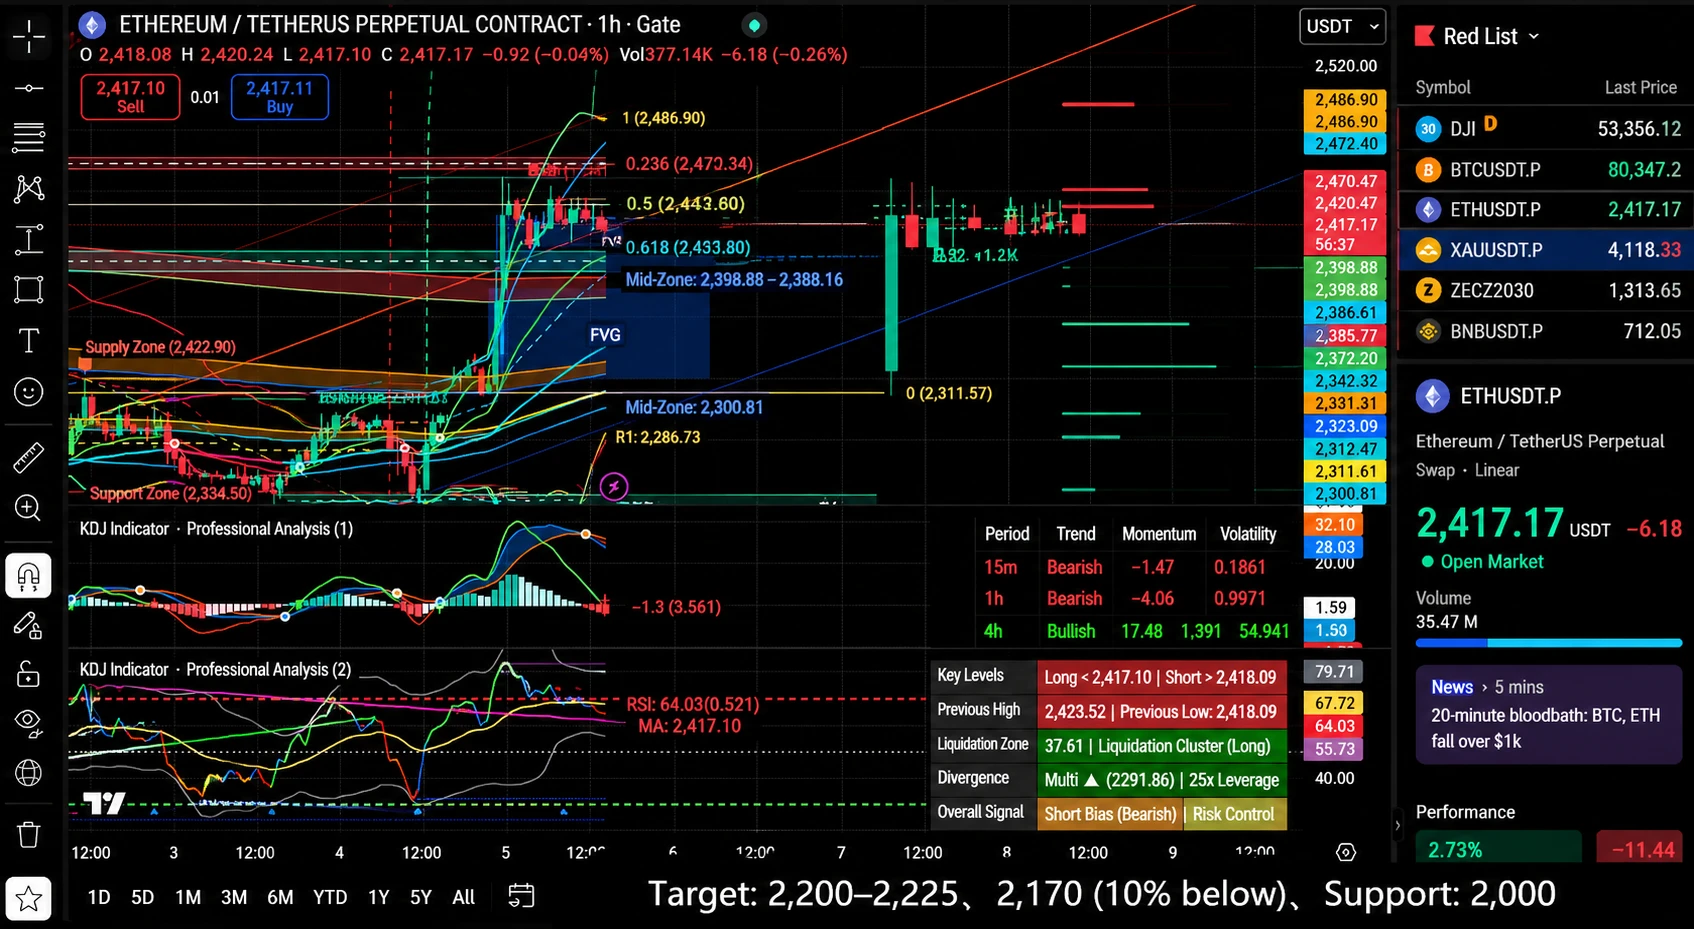
ETHUSDT – Ethereum Market Outlook
ETH is trading around 2,417 USDT, trying to stabilize after its recent pullback.
Key Support: 2,390–2,400, followed by 2,372–2,380. Major support sits at 2,300–2,315.
Key Resistance: 2,430–2,444. A breakout could open the way toward 2,477–2,486 and potentially 2,520–2,529.
Trading Strategy: Watch for bullish confirmation around 2,390–2,400 before considering longs. A strong breakout above 2,444 could strengthen bullish momentum. If support fails, ETH may revisit 2,300 or even 2,225–2,170.
Overall Outlook: Short-term bias remains cautiously bullish while ETH ho
post-image
ETH-1.26%
  • 1
The big one is coming—Trump has started cashing out his crypto assets.
He’s probably about to face a reckoning, so he’s rushing to cash out his BTC while he still has some power.
The scary thing is, if the whales and their affiliates start dumping too, who’s going to buy?
BTC-0.67%
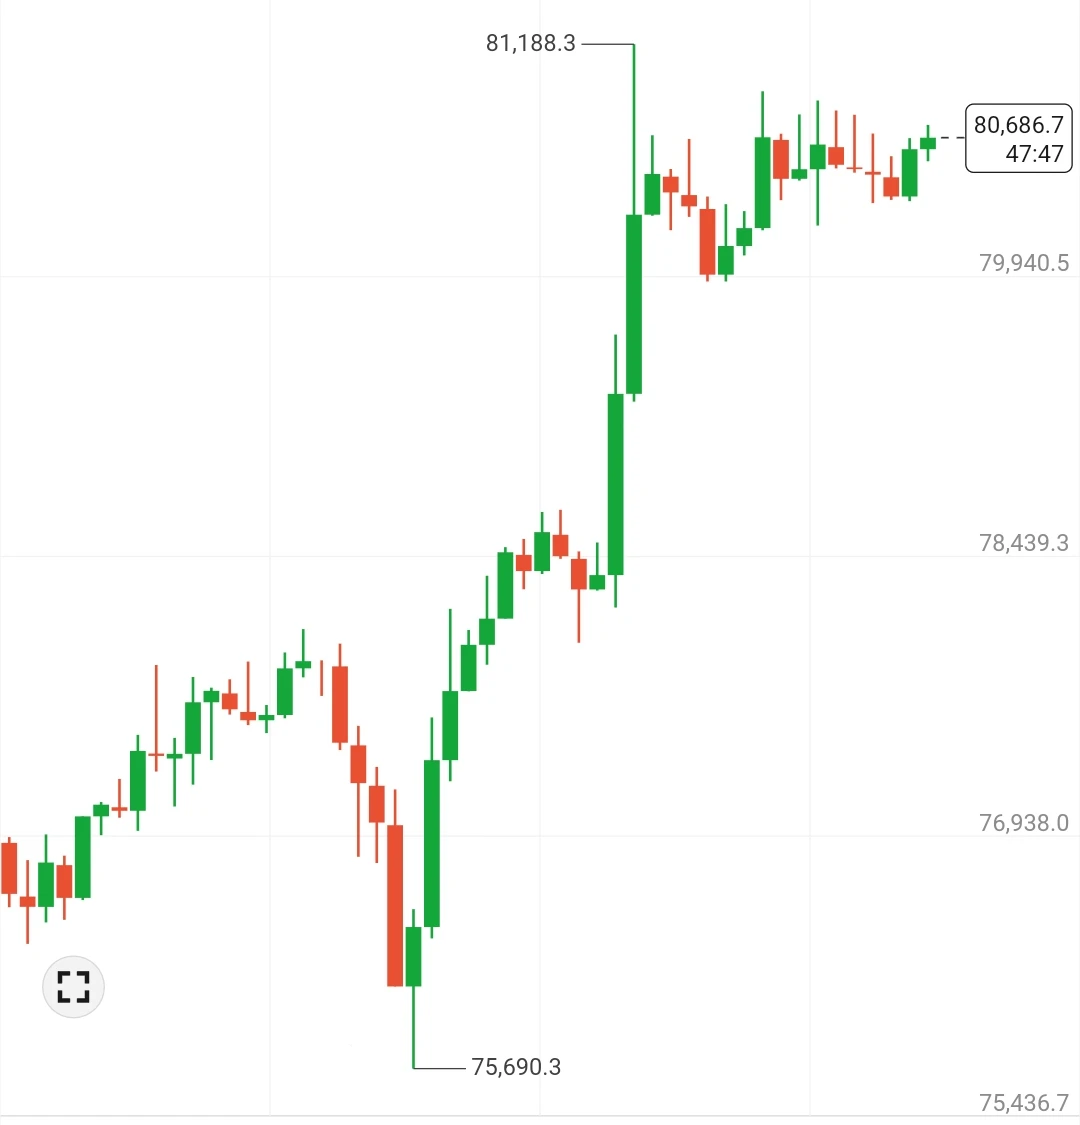
Following a short-term decline, BTC/USDT has recovered above the $80,000 mark. Let's examine the current technical picture and potential scenarios.
Technical Analysis:
On the 1-hour and 4-hour timeframes, an upward momentum is forming: the price is holding above the EMA5, EMA10, and EMA30 lines. On the daily chart, the price is testing the EMA30 (around $80,383), a significant pivot point.
The Bollinger Bands are expanding, with the price trading in the upper half of the channel (UB on 1H: ~$81,580; UB on 4H: ~$80,900), indicating buyer dominance.
The MACD on the 4-hour chart is in positive t
BTC-0.67%
  • 5
  • 1
What Is the Sharpe Ratio? How Can You Measure Whether the Returns from a Trading Strategy Are Worth the Risk?
In cryptocurrency trading, a high return does not necessarily mean a strategy is good. If a strategy earns high returns but comes with sharp fluctuations and significant drawdowns, we need to ask: Are those returns worth the corresponding risk? The Sharpe ratio is one tool that can help answer this question.
First, what is the Sharpe ratio?
The Sharpe ratio measures the excess return earned by a portfolio or trading strategy per unit of volatility risk. Generally, the higher the value,
post-image
$ARIA Was He Yi fucked from behind?
post-image
ARIA+22.03%
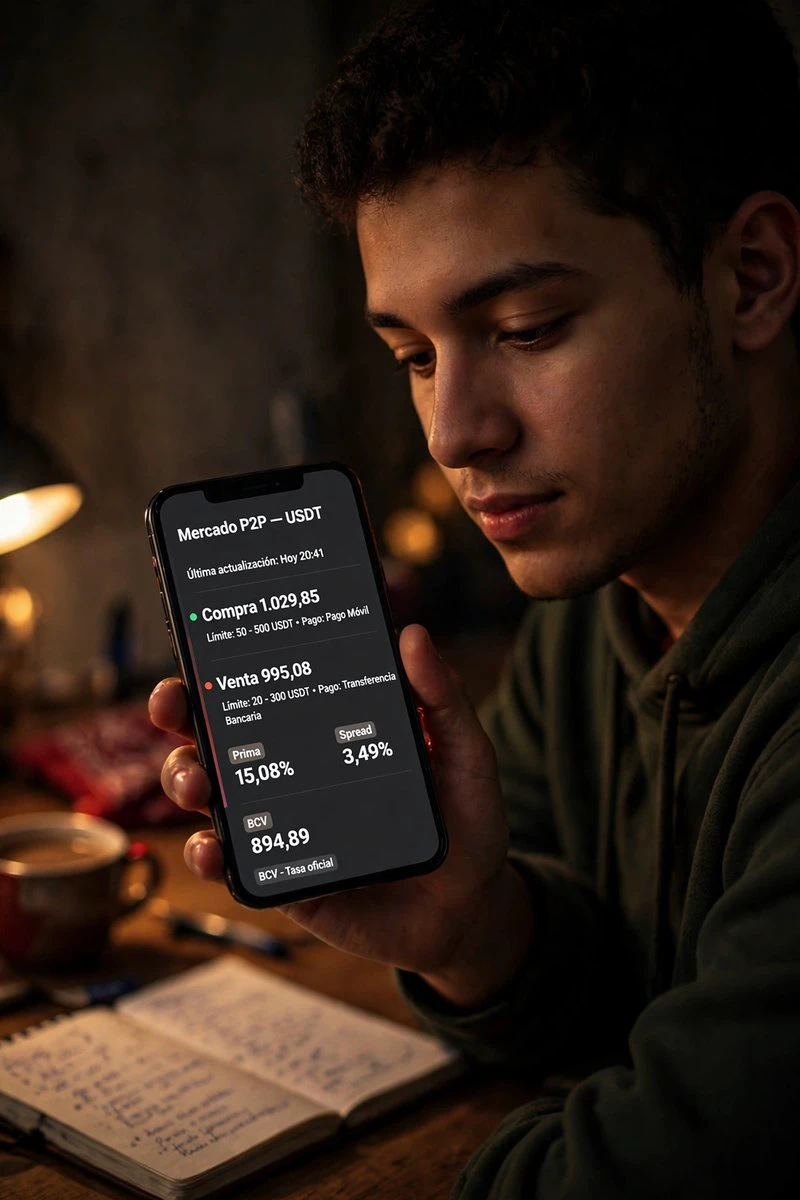
📊 Looking only at the first P2P ad is the fastest way to get the calculation wrong.
We published a step-by-step guide to reading volume and spread correctly: using today’s market data, not the price listed first.
Today’s snapshot, according to the P2P Radar:
• USDT buy price: Bs. 1.029,85
• USDT sell price: Bs. 995,08
• BCV official rate: Bs. 894,89
• Premium over BCV: 15,08%
• Overall P2P spread: 3,49% (Bs. 34,77)
• Offers observed: 176
But the overall average hides what matters. At the top of the order book—the best prices available right now—the story is different:
• Best price to buy USDT
post-image
Load More

Join 40 M users in our growing community

⚡️ Join 40 M users in the crypto craze discussion

💬 Engage with your favorite top creators

👍 See what interests you

Trending Topics

GateLaunchesPoSECProofOfSecurity

26 Views446 Discussing

Gate has officially launched Proof of Security, or PoSEC, extending beyond Proof of Reserves by disclosing the distribution of cold-storage and hot-wallet assets and introducing a cold storage coverage ratio to measure protection under extreme-risk scenarios. Gate’s latest cold storage coverage ratio stands at 104.58%, with 88.26% of assets in cold storage and 11.74% in hot wallets. A coverage ratio of at least 100% means cold-storage assets alone would still be sufficient to cover all user assets even if hot-wallet assets were fully lost. Exchange security is not only about whether reserves are sufficient, but also how assets are stored and protected under extreme conditions. Could cold storage coverage become a new industry standard?[👉 Learn more](https://gate.com/proof-of-security)

BTCBackAbove80K

39.7k Views41.25k Discussing

DemocratsWinBothChambers

19.22k Views454 Discussing

View More