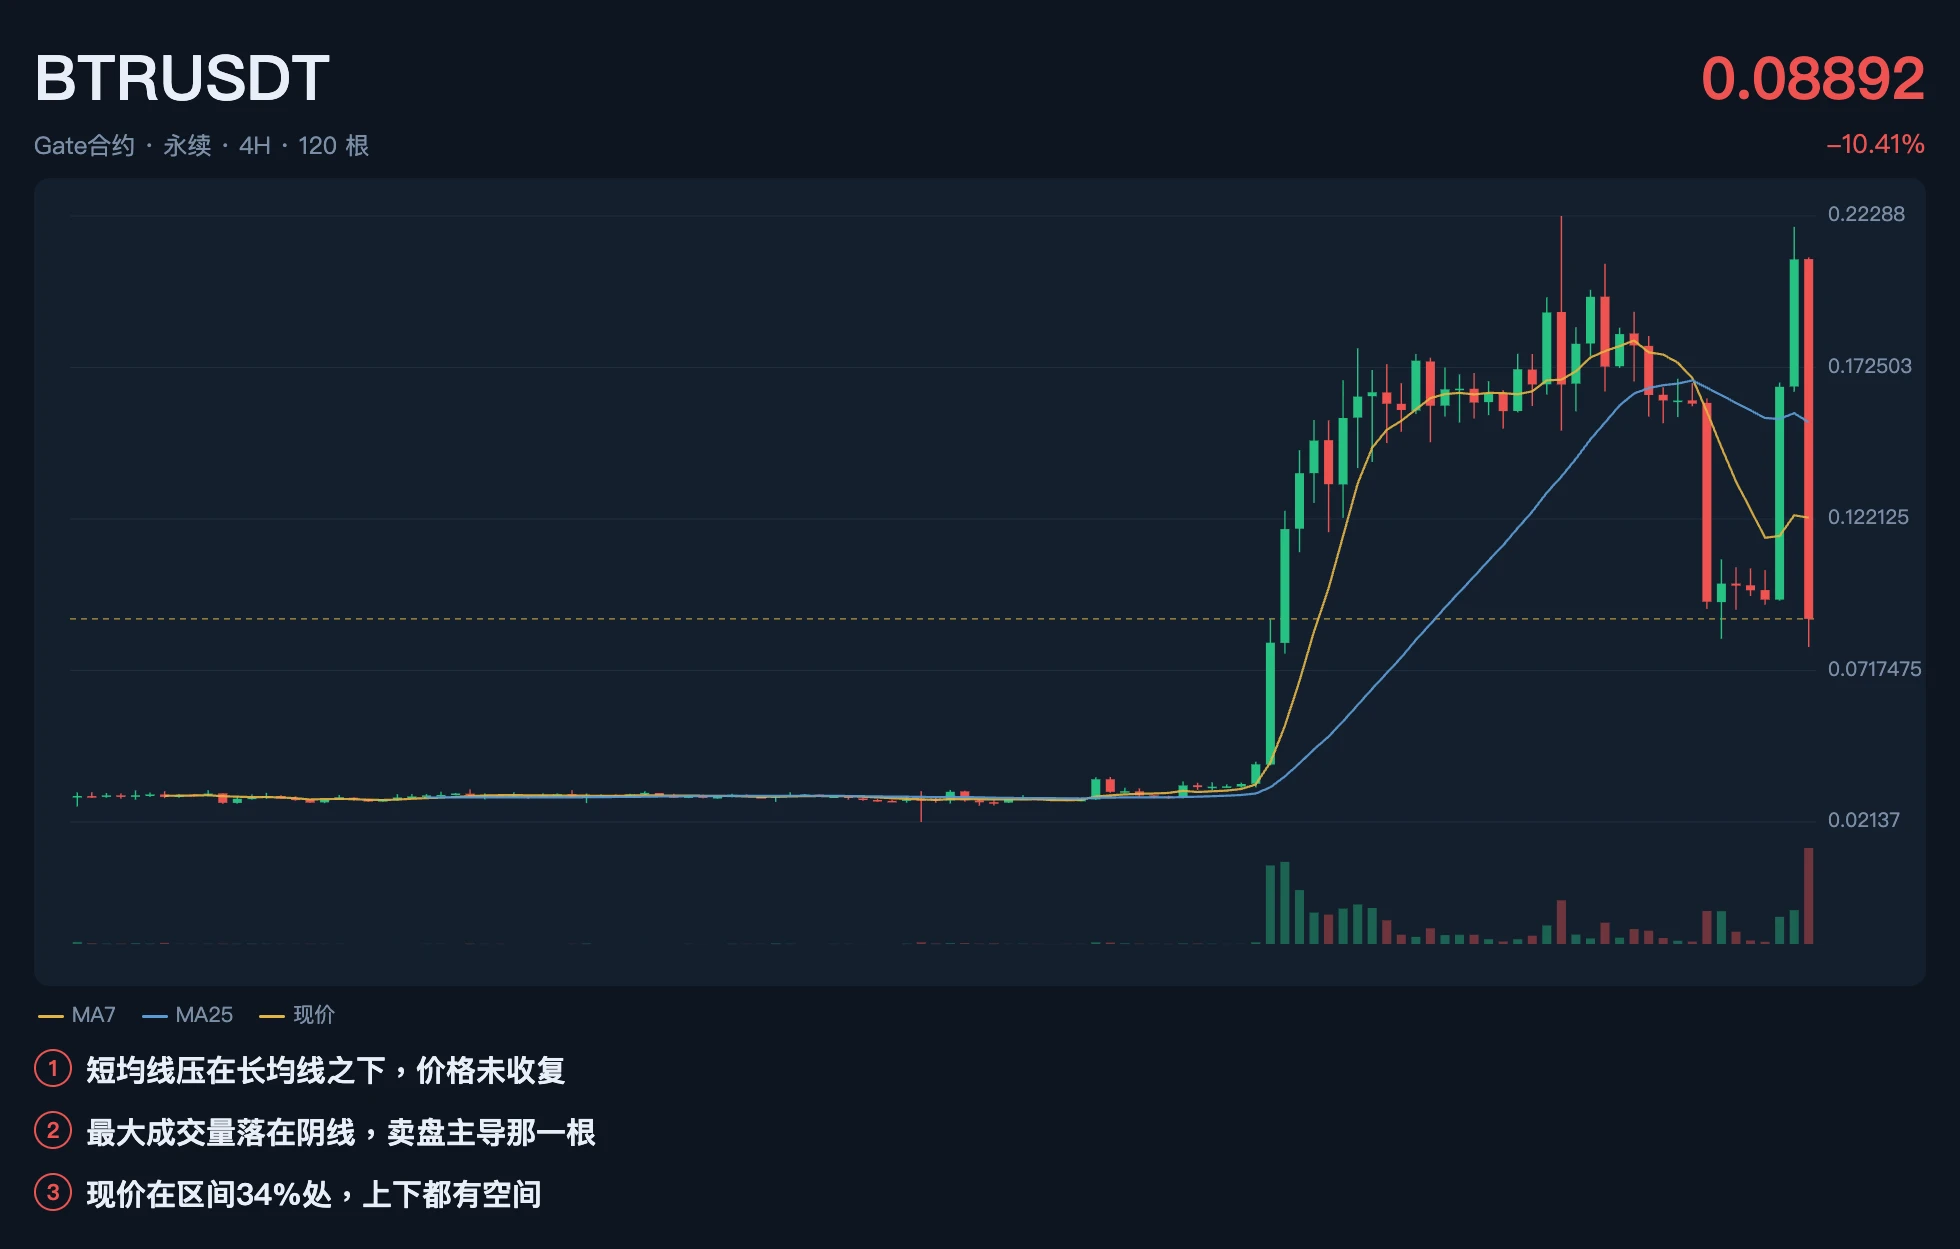
$BTR is currently at 0.0897, down 59.1% from the high of 0.21946 12 hours ago. The drop itself is not the main point; the key is where the positions are flowing.
First, look at three numbers. Within 24 hours, the large-holder position ratio fell from 1.2400 to 1.1795, down just 4.9%. Over the same period, the retail account ratio surged from 0.6402 to 0.9433, an increase of 47.3%. Meanwhile, open interest fell by only 3.0%.
The large-holder-to-retail ratio therefore dropped from 1.937 to 1.250, down 35.4%. Many people would see this and immediately interpret it as “the whales have left.” That is wrong. The large-holder-to-retail ratio is the large-holder position ratio divided by the retail account ratio. Its decline can have two causes: the numerator gets smaller, meaning large holders exit, or the denominator gets larger, meaning retail traders pour in. This time it is the latter—the large holders barely moved; retail traders are rushing in.
The fact that open interest fell by only 3.0% makes the situation even clearer. With the price nearly halved while open interest barely changed, this was not a mass closing of positions and exit, but a transfer of positions: someone sold while an equal amount was bought. Combined with the retail account ratio jumping from 0.4294 to 0.9433 in the final three hours, it is clear who was taking the supply.
The hourly sequence also lines up: at 05:00, the price rose 15.49% on 4.97 times the volume; at 07:00, it surged to 0.20866; at 08:00, it plunged 33.00% on 13.80 times the volume; at 10:00, it fell another 26.38% on 14.44 times the volume. First came the pump, then the collapse on massive volume, with distribution completed in between.
Here I need to correct my previous judgment. I once interpreted the high large-holder-to-retail ratio as “large holders are in control and this is a shakeout.” That was wrong. The high ratio at the time only reflected that retail had not entered yet; it did not mean large holders were supporting the price. What followed was a pump followed by a collapse—the standard distribution structure.
The structure is bearish. To turn the direction around, the daily chart needs to reclaim 0.1398, the starting point of the collapse, with open interest expanding at the same time—a low-volume rebound reclaiming that level does not count.
First, look at three numbers. Within 24 hours, the large-holder position ratio fell from 1.2400 to 1.1795, down just 4.9%. Over the same period, the retail account ratio surged from 0.6402 to 0.9433, an increase of 47.3%. Meanwhile, open interest fell by only 3.0%.
The large-holder-to-retail ratio therefore dropped from 1.937 to 1.250, down 35.4%. Many people would see this and immediately interpret it as “the whales have left.” That is wrong. The large-holder-to-retail ratio is the large-holder position ratio divided by the retail account ratio. Its decline can have two causes: the numerator gets smaller, meaning large holders exit, or the denominator gets larger, meaning retail traders pour in. This time it is the latter—the large holders barely moved; retail traders are rushing in.
The fact that open interest fell by only 3.0% makes the situation even clearer. With the price nearly halved while open interest barely changed, this was not a mass closing of positions and exit, but a transfer of positions: someone sold while an equal amount was bought. Combined with the retail account ratio jumping from 0.4294 to 0.9433 in the final three hours, it is clear who was taking the supply.
The hourly sequence also lines up: at 05:00, the price rose 15.49% on 4.97 times the volume; at 07:00, it surged to 0.20866; at 08:00, it plunged 33.00% on 13.80 times the volume; at 10:00, it fell another 26.38% on 14.44 times the volume. First came the pump, then the collapse on massive volume, with distribution completed in between.
Here I need to correct my previous judgment. I once interpreted the high large-holder-to-retail ratio as “large holders are in control and this is a shakeout.” That was wrong. The high ratio at the time only reflected that retail had not entered yet; it did not mean large holders were supporting the price. What followed was a pump followed by a collapse—the standard distribution structure.
The structure is bearish. To turn the direction around, the daily chart needs to reclaim 0.1398, the starting point of the collapse, with open interest expanding at the same time—a low-volume rebound reclaiming that level does not count.