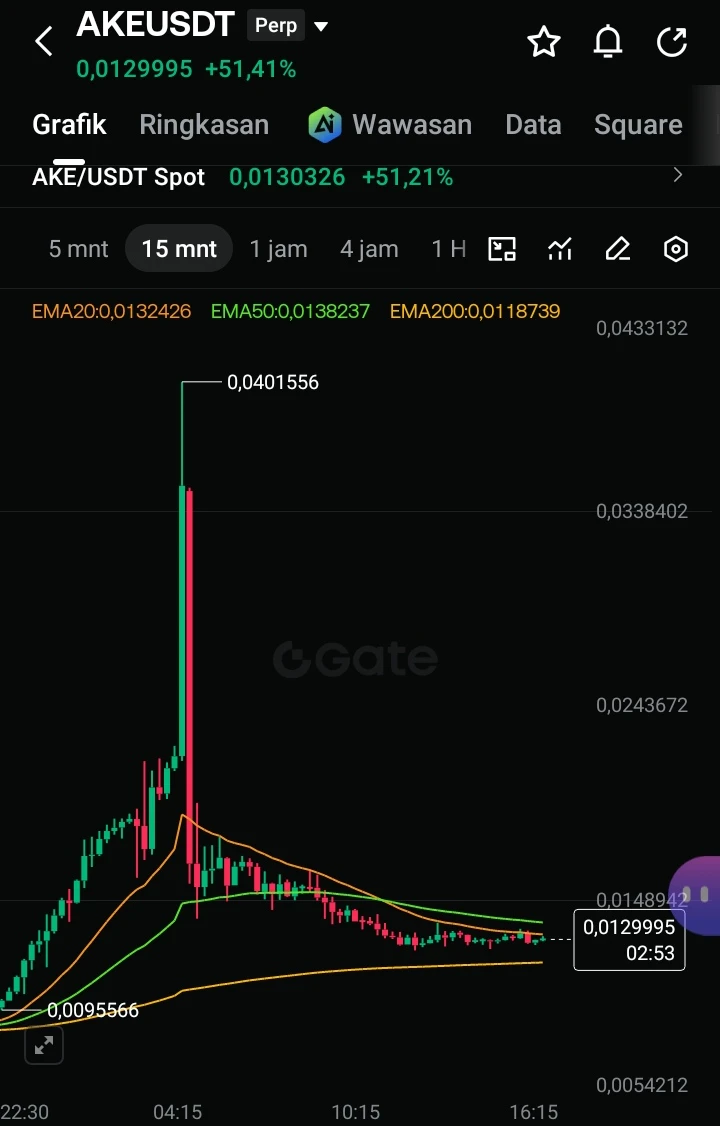
AKE/USDT Chart Analysis
15-Minute Timeframe: The price is undergoing a consolidation/correction phase after a drastic spike (pump and dump) to 0.04015. The price is currently around 0.01299 and moving below the 20 EMA (0.01324) and 50 EMA (0.01382). The 200 EMA at 0.01187 serves as the nearest strong support.
1-Hour Timeframe: The macro trend still shows the remnants of a major spike. The price is currently holding just above the 50 EMA (0.01180) and 200 EMA (0.00952), but bullish momentum has significantly weakened. The consolidation area is narrowing around the 0.0129 - 0.0134 range.
Trading Opportunities & Strategies
Buy (Long) Option - Rebound/Scalping:
Entry: Wait for the price to retest the 200 EMA support area (15m) / 50 EMA (1h) around 0.0118 - 0.0120.
Target (TP): 0.0134 - 0.0138 (15m 20/50 EMA resistance area).
Stop Loss (SL): 0.0112 (below the nearest support support line).
Breakout Buy Option:
Entry: Enter when the 15m candle successfully closes convincingly above the 50 EMA (> 0.01385).
Target (TP): 0.0148 - 0.0160.
Stop Loss (SL): 0.0131.
Sell/Short Option (Following the Early Downtrend):
Entry: If the price fails to break through the 20 EMA at 0.01325.
Target (TP): 0.0118.
Stop Loss (SL): 0.0136.
Risk Management Recommendations
Assets that have recently experienced an extreme spike tend to have high volatility and manipulation risks (pump & dump). It is recommended to use low leverage and not risk more than 1-2% of total capital.
#Gate60MillionUsers $AKE