
Square
Following
Hot
News
Notifications
Profile
Share your thoughts
placeholder
Article
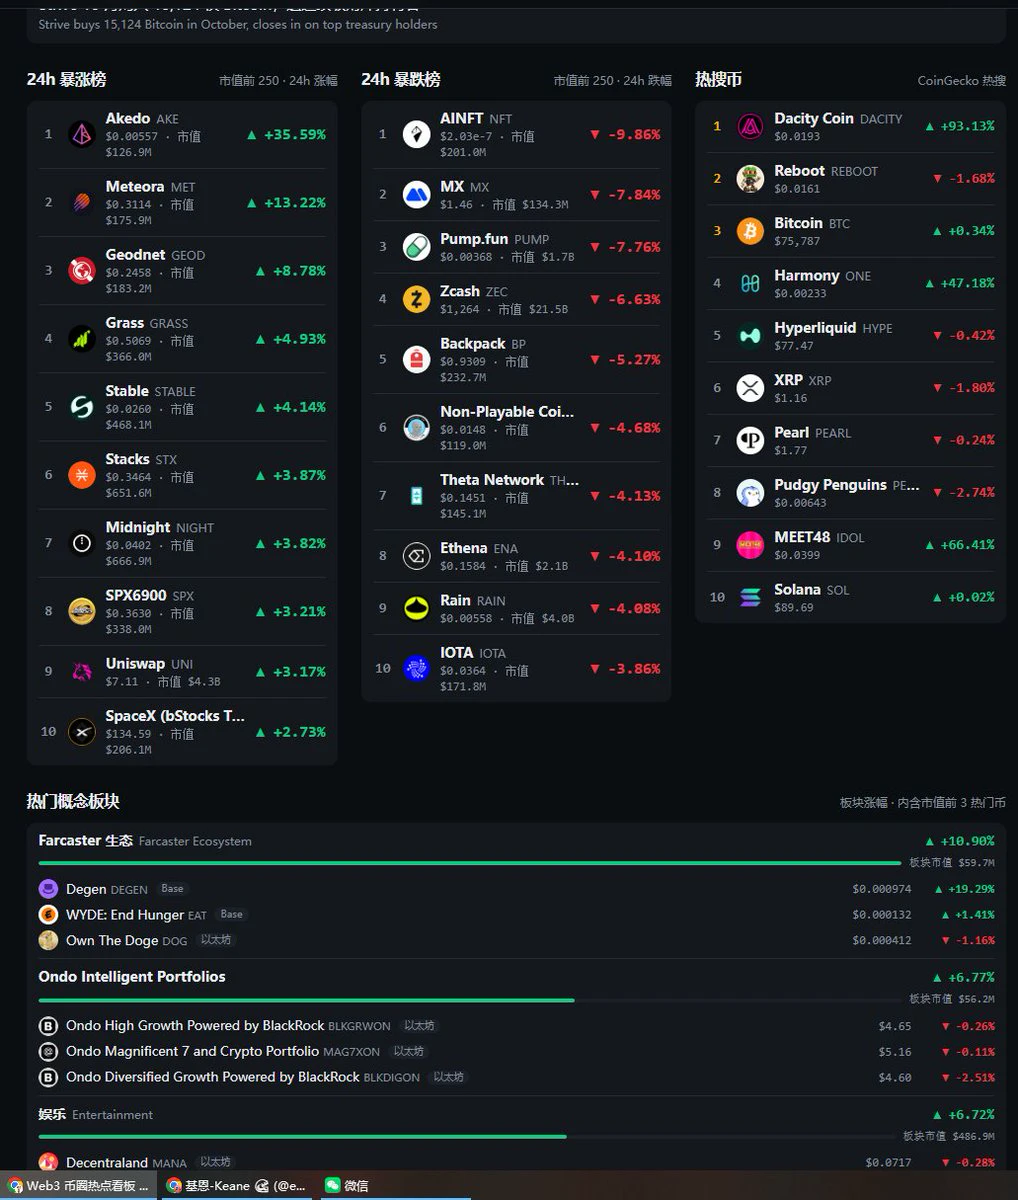
MUSE’s [Spaces] feature is really useful
It basically lets you customize your own website or functional app directly
I sent one prompt—to pull data from TG groups, news, and market prices
After one round of optimization
I can now get the latest market updates, news, and hot topics anytime in Spaces
Creating customized services for yourself is seriously awesome. That’s the greatest value of a personal Agent: customization is what maximizes its value most.
post-image
MUSE-2.05%
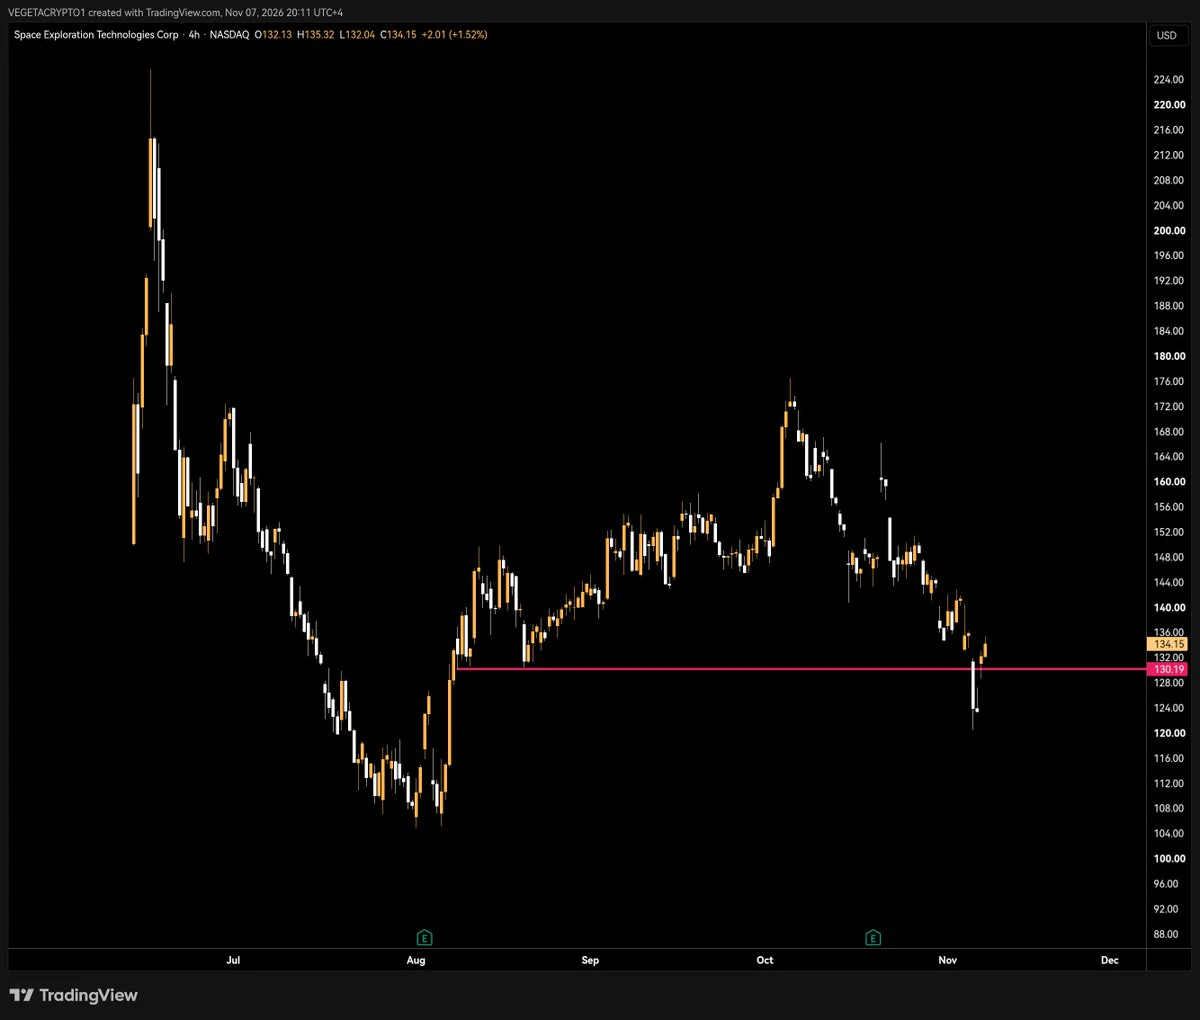
$SPCX good sweep if it can hold against the market.
post-image
SPCX+0.78%
Trenches
ZIG
Z
bade
b
ZIG
0x8c...1145
Market Cap
$.
Change
.
24h Vol
$.
Holders
.
BTC
B
bade
b
BTC
C5xp...pump
Market Cap
$.
Change
.
24h Vol
$.
Holders
.
IDOL
I
bade
b
IDOL
0x3b...ab07
Market Cap
$.
Change
.
24h Vol
$.
Holders
.
scamsem
s
bade
b
scamsem
41Wp...pump
Market Cap
$.
Change
.
24h Vol
$.
Holders
.
DOGE
D
bade
b
DOGE
DoGE...fm7R
Market Cap
$.
Change
.
24h Vol
$.
Holders
.
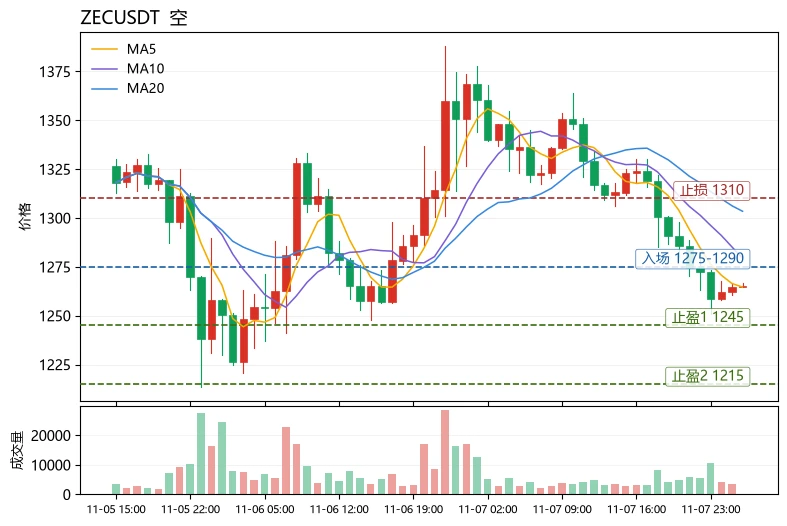
$ZEC Current price: 1265.39. The first resistance above is 1303.45 (MA20), while 1245.75 (lower Bollinger Band) is the line bulls must hold. Price has fallen below MA20 and MA5 has crossed below it; the MACD histogram remains bearish at -6.352, and RSI at 35.6 is nearing oversold territory but has not bottomed. The 10.84% range over 30 candles indicates elevated wick risk. More importantly, the funding rate remains +0.0100%: as the price falls, bulls continue paying to hold their positions, suggesting leveraged longs have not yet been flushed out. Funding favors bears, and chasing longs risks
post-image
eur
eureur
Gate.Fun
MC:$5.55KHolders:3
0.06%
ZEC+1.16%
ADA-1.48%
Gold Weekend OTC Trading + Next Week Analysis
(November 7 evening; prices and levels are subject to the latest market data)
I. Weekend OTC Gold Status
Mainstream spot and COMEX futures markets are closed.
Current quote range for tradable weekend OTC gold: 4065–4075, consolidating narrowly around 4070, with extremely light trading, wider spreads, and almost no directional movement.
Friday closing price: 4070–4072 (spot around 4071, futures around 4075).
After nonfarm payrolls exceeded expectations (+165k), gold retreated from its highs but held the key 4000 level; no further breakdown occurred
XAUUSD-0.45%
  • 1
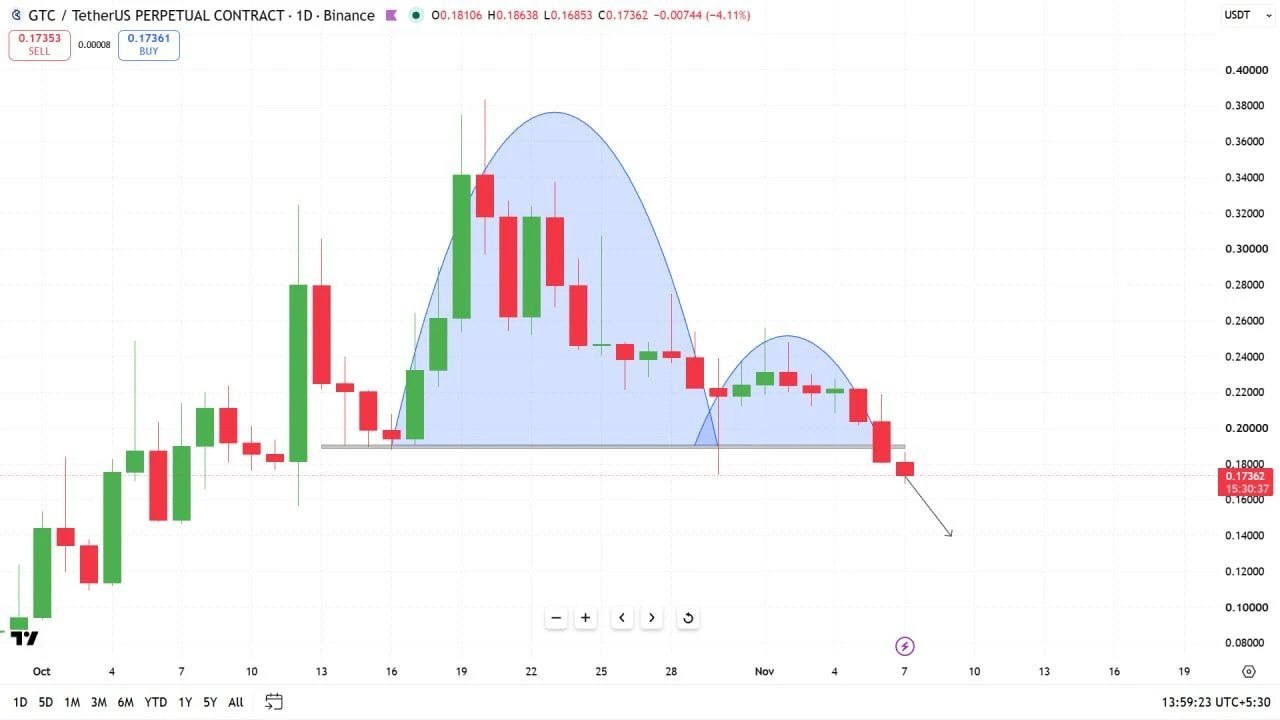
$GTC is showing clear signs of weakness after its recent breakdown.

The previous trading range has collapsed, opening the door for further downside.

Buyers are struggling to defend the price as bearish momentum builds.

Even a small recovery could turn into a trap before another sharp decline.

If demand remains weak, fresh lows could be on the horizon.

$GTC could be heading into a major correction. Stay alert!
post-image
No need to panic

No need to panic

No need to panic

$CORE Actually, it's a very simple principle

Things have been pretty tough for everyone lately

None of us has money to buy Kuer

And you still want to rob me? How could that be possible? 😅

Kuer has nothing now

And isn't even afraid of black cats

Only the community still has a following, like $LAB , the cockroach that just won't die #质押Launchpool瓜分45万VLX
CORE+1.11%
LAB-4.47%
VLX+0.00%
BTC NEWS
live-cover
LIVE2,153
$BTC An $8 billion liquidity wall! Let’s also look at the Bitcoin liquidation map from this angle. We’ve always analyzed it as a bubble chart or heatmap. I’ll be blunt. If the main accumulation zone on the long side rises to $90k, liquidations will exceed $5 billion. That’s a pretty staggering figure, and could even reach $10 billion due to the snowball effect. On the downside, however, liquidations at the $66k level amount to only $3 billion. Yes, proportionally, that’s still a large amount. As for my view, I’ll get straight to the point: I currently think downside liquidations have a greater
post-image
BTC-0.65%
Just opened a short position on $SWARMS
.
Entry range (in batches): 0.00718 – 0.00734 Stop: 0.00769🎯 First target: 0.00670🎯 Second target: 0.00665🎯 Third target: 0.00643
$SWARMS is currently +14.57%; the rebound offered a good shorting opportunity.
Risk warning: The above is only a sharing of my personal trading ideas and does not constitute investment advice. Contract trading carries extremely high risk, so please manage your position size carefully.
post-image
SWARMS-3.69%
$BTC Crypto Market Academician: 11.8 Ethereum (ETH) daily doji + 4-hour bearish alignment: At 2239, bulls and bears are both waiting for the other side to make the first move

  What I really want to say up front is this: The essence of trading is not prediction, but response. At 2239, neither bulls nor bears has an absolute edge. It comes down to who has the tighter stop-loss, the lighter position, and the greater patience. I share updates on key levels and evolving market structure on my Moments every day. I don’t make grand promises or post screenshots boasting 1x returns; I simply share si
BTC-0.65%
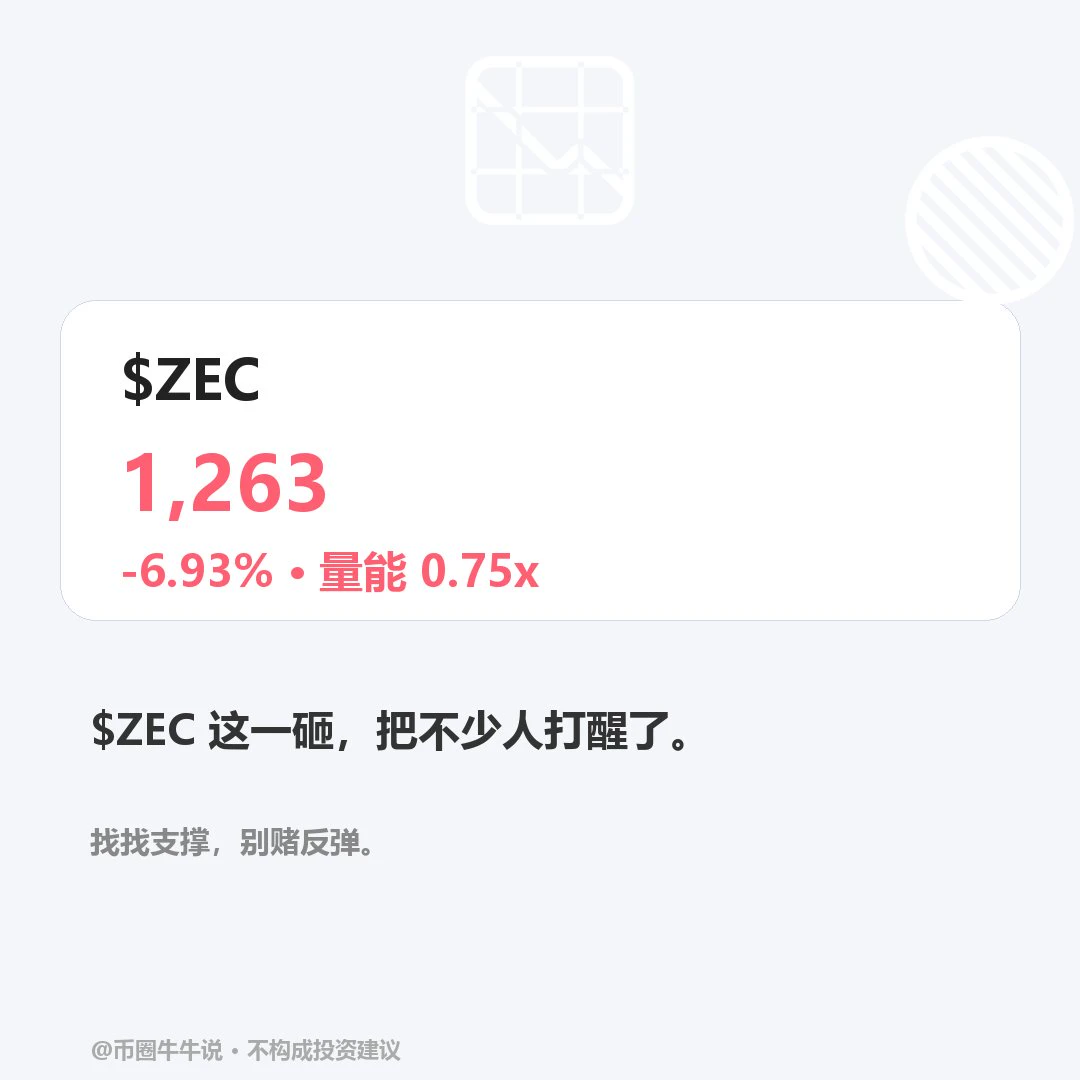
$ZEC Currently at 1262.59, down 6.93% over 24H (range: 1250.67–1377.57). The 1H trend is weak, with an RSI of 13.93 indicating oversold conditions; price is below the EMA20 at 1298.98, and the volume ratio is 0.75. The 4H trend is weak, with an RSI of 41.51; price is below the EMA20 at 1286.54. If price holds above the 1377.57 resistance level, watch for continuation; a break below the 1250.67 support level would weaken the structure. In review, verify that price holds above 1377.57 and reclaims 1250.67; oversold conditions only indicate potential rebound demand. The setup is invalidated if pr
post-image
ZEC+1.16%
Ptah Initial Agent Offering (IAO) @Ptahtrade #IAO
1. Free airdrop, 50% of the total supply
Exclusively for Ptah PoA cardholders; each card receives 11,250 IAO.
How to participate: From your linked X account, post one tweet using the official text on the IAO page. The text must include your Agent number
post-image
AIRDROP+0.00%
$PUMP & $STONK
Both approaching critical support levels. This is a defining moment for both charts.
If you're looking to buy these levels, that's perfectly fine, but risk management is essential. Be prepared to cut the position quickly if support fails.
A loss of support on $PUMP could expose price to another 25% downside before reaching any meaningful support. $STONK is potentially even more vulnerable, with significant market inefficiencies below current price that could leave the door open to a further 50% downside.
These are high-risk levels. The potential upside is there, but protecting y
PUMP+6.67%
STONK+11.55%
  • 1
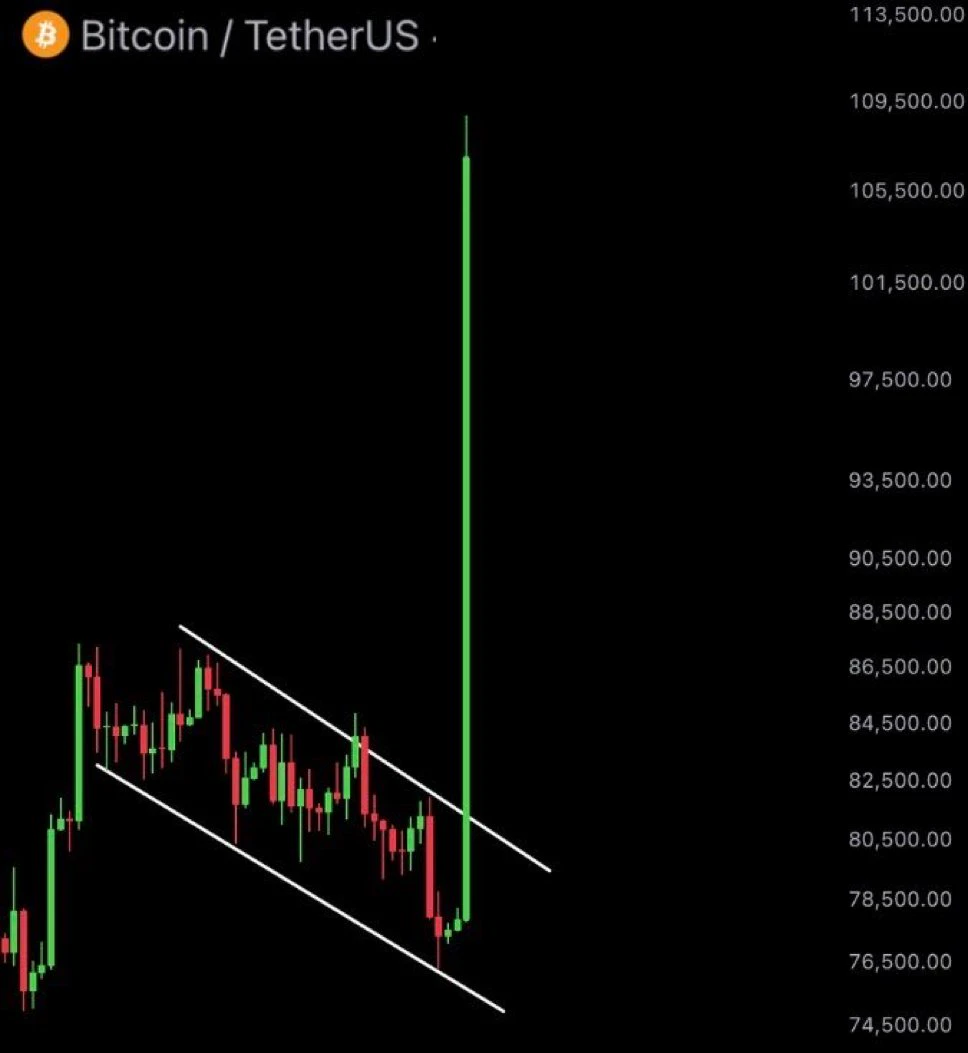
When bitcoin hits $120K in the next 12 months.
you’ll wish you had bought more today at $75K.
post-image
Some charts deserve a little extra attention, and $ZIG is one of them.
The bigger picture is getting interesting, but I'm more focused on how the market reacts at these levels than making predictions too early.
If momentum starts building, we could see some serious excitement around $ZIG in the next bull phase.
No chasing, no rushing. Just watching how the story unfolds.
Could be an interesting one to follow.
ZIG-8.79%
  • 1
Guys, trust me, $SIREN will rise to 0.035 soon. Go long with a big position now, and you'll thank me soon ❤️Buy: 0.026-0.027Take profit: 0.03000 / 0.035000Stop loss: 0.0230Guys, opportunities like this don't come every day. Don't miss the next move. Who's joining me in opening a long position? Not investment advice. Trade here 👉🏻 $SIREN
post-image
SIREN+1.46%
#BTCETFOutflowsContinue 🔎

Outflows from Bitcoin ETFs have raised the question: is institutional capital losing confidence in Bitcoin? U.S. spot Bitcoin ETFs saw a net outflow of approximately $870 million over the course of the week, as weak institutional demand and macroeconomic uncertainty intensified selling pressure.

This development is particularly noteworthy because spot Bitcoin ETFs have become one of the primary channels through which traditional financial institutions, asset managers, and professional investors gain exposure to Bitcoin. However, a crucial distinction must be made:
BTC-0.67%
ETH-1.26%
  • 13
  • 5
Layout: Bitcoin, Ethereum, Dogecoin
live-cover
LIVE889
  • 1
I've recently been watching The Great Long March
It's so good
So tear-jerking
Compared with the past, life today is so much better
post-image
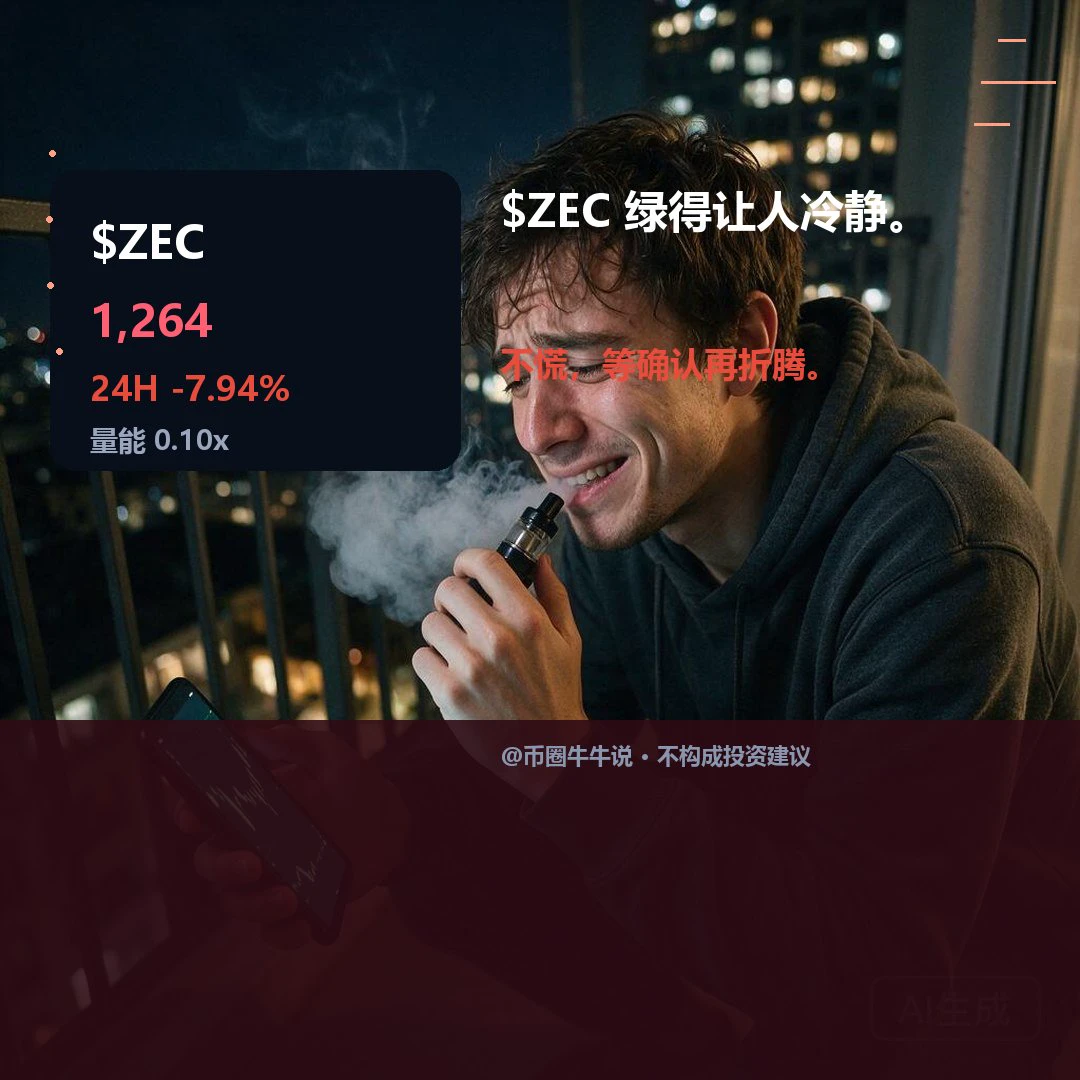
$ZEC Currently at 1264.47, down 7.94% over 24H (range: 1250.67–1374.07). The 1H outlook is weak, with RSI at 18.14, price below EMA20 at 1295.70, and a volume ratio of 0.10; the 4H outlook is weak, with RSI at 41.78 and price below EMA20 at 1286.68. A sustained move above the 1367.59 resistance level could signal further upside; a break below the 1250.67 support level would weaken the structure. In the review, focus on whether price can hold above 1367.59 and whether it can recover after losing 1250.67. Volume is only 0.10x; a low-volume hold above resistance or a break below support without a
post-image
ZEC+1.16%
Load More

Join 40 M users in our growing community

⚡️ Join 40 M users in the crypto craze discussion

💬 Engage with your favorite top creators

👍 See what interests you

Trending Topics

USAIStocksHitHard

20.5k Views3.67k Discussing

U.S. stocks sold off sharply on Thursday, November 5 (UTC). The Nasdaq closed down around 5.5%, entering correction territory, while the Philadelphia Semiconductor Index plunged roughly 12%, with chip stocks including $NVDA and $AMD posting steep losses. Beyond profit-taking, investors are growing concerned about the pace of AI data center construction, capital spending, and future returns on investment. The key question now is whether the AI sector’s lofty growth expectations need to be repriced. Where do you think the next opportunities will emerge: chip stocks, tech giants, or other sectors?

USNonfarmPayrolls

32.83k Views4.33k Discussing

StakeOnLaunchpoolToShare450KVLX

8.87k Views823 Discussing

View More