



Square
Following
Hot
News
Profile
Share your thoughts
placeholder
Article
Current price 1301.92, down 5.09% in 24h, trading volume 36.2M USDT; MA5=1300.92 is below MA20=1304.94, RSI=36.9 is nearing oversold territory, the MACD histogram at +2.42 has turned bullish, Bollinger range [1280.22,1329.66], 30-candle amplitude 9.35%, and the Fear and Greed Index at 55 remains in greed territory. Price is hugging the lower Bollinger Band, short-term moving averages are flattening, and initial signs of bullish MACD divergence indicate bearish momentum is fading. However, greed has not been flushed out, so a rebound is more likely to be short covering than a trend reversal; m
post-image
SNDKB
SNDKBSNDKB
Four.meme
MC:$3.87KHolders:1
0%
SUI-5.05%
If we use a rigid, outdated approach, we can arrive at a price of around 910–918, but it depends on where he starts. Moving upward...
20.43%-16.4%-12.5%, with each move decreasing by about 4%.
Trenches
AGT
A
bade
b
AGT
0x5d...e274
Market Cap
$.
Change
.
24h Vol
$.
Holders
.
CNPY
C
bade
b
CNPY
0xc6...ddd2
Market Cap
$.
Change
.
24h Vol
$.
Holders
.
FOLIO
F
bade
b
FOLIO
0x5f...e411
Market Cap
$.
Change
.
24h Vol
$.
Holders
.
FTR
F
bade
b
FTR
DFMt...pump
Market Cap
$.
Change
.
24h Vol
$.
Holders
.
DOPE
D
bade
b
DOPE
0xf9...8899
Market Cap
$.
Change
.
24h Vol
$.
Holders
.
The most unusual detail in today's market is that the MACD histogram for $FET
has turned positive (+0.0001087), while the price remains below MA20=0.196435, capped by MA5=0.19496, and is down 5.05% over 24h. The divergence between the indicators and price suggests this is a rebound rather than a reversal, leaving very little room for error when going long. The amplitude across 30 candlesticks is about 8.03%, indicating high volatility. Position size should be reduced to less than half the usual amount, and stop-losses on individual trades must be executed mechanically; do not hold on to losin
post-image
ARB-7.04%
Agents have wallets and can pay for things.
However, they still can’t borrow.
$PRIORS is the credit layer for AI agents on Robinhood Chain.
How it works:
➜ New agent starts with a small USDG line (as low as $5 from the treasury)
➜ It borrows, uses the capital, and repays on-chain
➜ Every repayment is public and builds a score/record anyone can check
➜ Defaults burn a large portion of the backer’s $PRIORS stake
You can also put your own $PRIORS or stock tokens behind lines.
Next step is credit sized to verified x402 income, so an agent’s real revenue automatically repays the loan first.
Revi
post-image
USDG+0.02%
$TRUTH is forming a strong bullish reversal, buyers are re-entering, and it is ready to break out…🤝🚀
Go long now with 25x leverage: Entry range: $0.0182 – $0.0189 Take Profit 1: $0.0198 Take Profit 2: $0.0210 Take Profit 3: $0.0225 Take Profit 4: $0.0240 Stop Loss: $0.0158 Risk reminder: If Take Profit 1 is reached, take partial profits and move the stop-loss to the entry price to protect your principal. Click below to go long now…👇
post-image
TRUTH+16.07%
$ENA SHORT TRADE
ENTRY: 0.19745
TARGET: 0.1686
STOPLOSS: 0.20225
ENA-5.42%
This is so intense!!!
They’re going at it right there in the streamer’s room, with the sounds rising and falling.
All the guys watching the livestream were completely stunned.
The boss really knows how to have fun—this is seriously intense!
The boss really knows how to have fun🥲🥲
Republicans in border states are starting to distance themselves from Trump’s tariffs. Recently, some Republican lawmakers in Texas, Arizona, North Dakota, and other border states have publicly warned the White House that additional tariffs would directly hurt local ports of entry, agriculture, and manufacturing. Texas, for example, does hundreds of billions of dollars in trade with Mexico. Thousands of freight trucks pass through ports of entry like Laredo every day, and auto parts often cross the border multiple times before being assembled into a vehicle. North Dakota, meanwhile, depends he
post-image
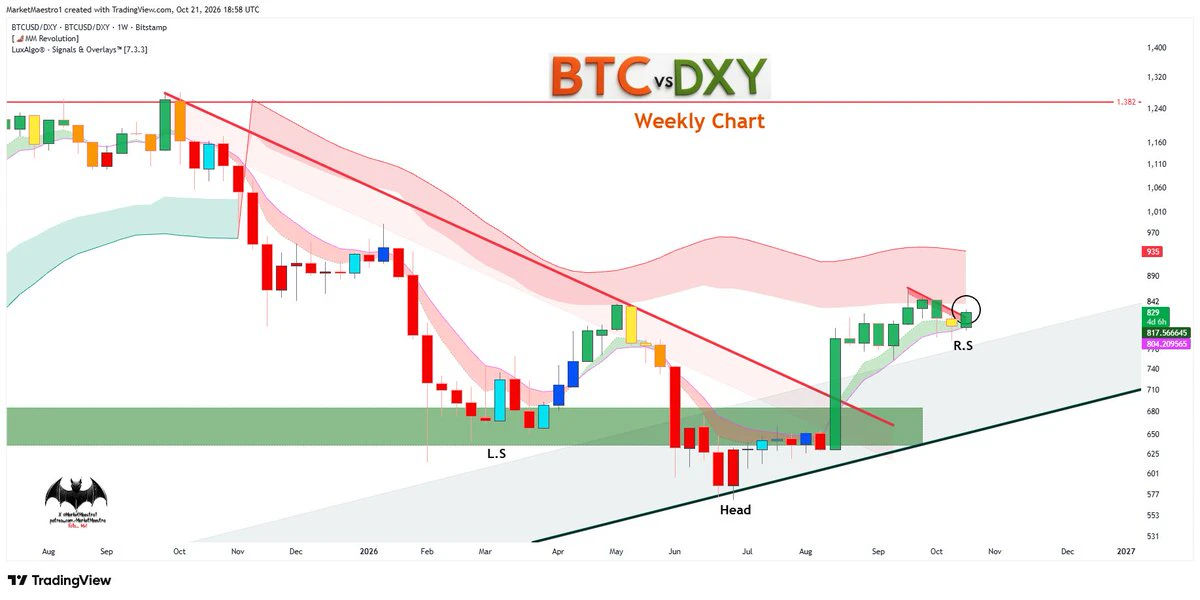
Bitcoin on-chain floor near $30k?
Ki Young Ju says even if all ETF money and treasury $BTC exit, cost basis still points there. Based on realized price and past MVRV bottoms. $10k would need an MVRV lower than anything seen. 2019 buyers already survived two 75% drops.
Cost basis shows where holders are underwater. It does not stop price. Severe selling has broken these levels before.
#GateWCTCS9GlobalTradingCompetition
post-image
BTC-0.95%
  • 4
  • 2
Machi Big Brother is back to protecting himself. Since 18:00 yesterday, he’s cut nearly 3,000 ETH worth of long positions, with 3,325 ETH left in his pocket. What really hurts is the roller coaster ride in unrealized profits: his account was still up $330,000 yesterday, but after one night’s sleep, that was down to just $23,000—money doesn’t disappear this fast even through a leak. His entry price is now 2,420, liquidation price 2,380, with 25x leverage—a difference of just $40, paper-thin. No wonder he’s been cutting so decisively. This isn’t just reducing his position; he’s clearly getting h
post-image
ETH-1.79%
  • 1
With $ZEC potentially approaching a local bottom, I'm also observing how $ZCAT , which is paired with ZEC, has started to enter a re-accumumation phase.
Broke downward trendline, consolidating and will soon enter the new expansion phase, potentially towards 250-300MC.
post-image
ZEC-5.23%
ZCAT-13.54%
$SIREN
This SIREN rally has me grinning from ear to ear🤭 Longs, don’t rush to sell—0.045 is just the appetizer; bigger gains are still ahead😏 If you’re not holding any, there’s still time to get in now. Don’t wait until it takes off to kick yourself🙃
post-image
SIREN+0.14%
$ZEC I watched it drop all the way from 1253.76 to 1131.85 without selling a single unit—not bad.
The current price is 1170.45, sitting at 37% of the 24-hour range.
Over two days, it first fell 9.7%, then climbed back 4.6%, and then went sideways.
The 20-hour moving average at 1156.81 is just 1.2% below, so at least that level held.
But the upside is still unfinished business: the 24h high of 1235.85 is 5.6% above the current price.
There’s only 3.3% down to 1131.85.
5.6 versus 3.3—that’s an upside-to-downside ratio of 1.69:1.
I don’t take trades below 2:1 (I call that “not losing is winning”
post-image
ZEC-5.32%
$ETH ‌ is looking a bit weak here.
• Lost the $2,550 level
• Trading back below the April highs
• $2,450 is now the key level to watch
If Ethereum fails to close the week above $2,450, another flush could be on the table.
Watching the weekly close closely. 👀
#USSeptemberPPIBeatsExpectations
#GateWCTCS9GlobalTradingCompetition
#GateBTCAndETHFuturesVolumeRanksTop3
post-image
ETH-1.74%
#USMemoryStocksExtendLosses
#ShareWeekly
Memory chip stocks are in a sharp drawdown, and the selloff has now stretched across several sessions. Micron (MU), SanDisk (SNDK), Western Digital (WDC) and Seagate (STX) have all been sliding, but the damage is not evenly spread. Micron has fallen roughly 14% over the five sessions through October 14, even though it is still up about 97% over six months and about 191% year to date. That gap between recent weakness and the long-term run is the core of the debate right now. Below I walk through what is driving the move, where the key levels sit, and h
$CL LONG SETUP — NEXT TARGET 101.28
Entry: 98.40 – 98.90 TP1: 99.50 TP2: 100.30 Next Price: 101.28 Extended Target: 102.30 SL: 97.70
$CL is maintaining a bullish structure on the 1H chart, with higher highs and higher lows. After a strong rally, price is consolidating near 98.83, suggesting buyers are defending recent gains. Holding above 98.40 could support another move toward 100.30 and 101.28. A sustained breakdown below 97.70 would invalidate the bullish setup.
post-image
CL+3.43%
  • 2
  • 2
crypto gainers update
live-cover
LIVE2,510
$APT This bearish candle hit pretty hard: down 7.75% in 24 hours, with the current price at 0.8183, hovering just above the low of 0.8166. Think of it like the last half hour before a market closes: vendors are desperate to clear their stock, calling out lower and lower prices, but trading volume is shrinking instead—54.7M in trading volume isn’t much, which suggests this isn’t panic selling so much as buyers collectively sitting on their hands, with nobody catching the falling knife.
Market sentiment is pretty clear: everyone who chased above 0.89 is now stuck holding the bag, and the intrada
APT-7.59%
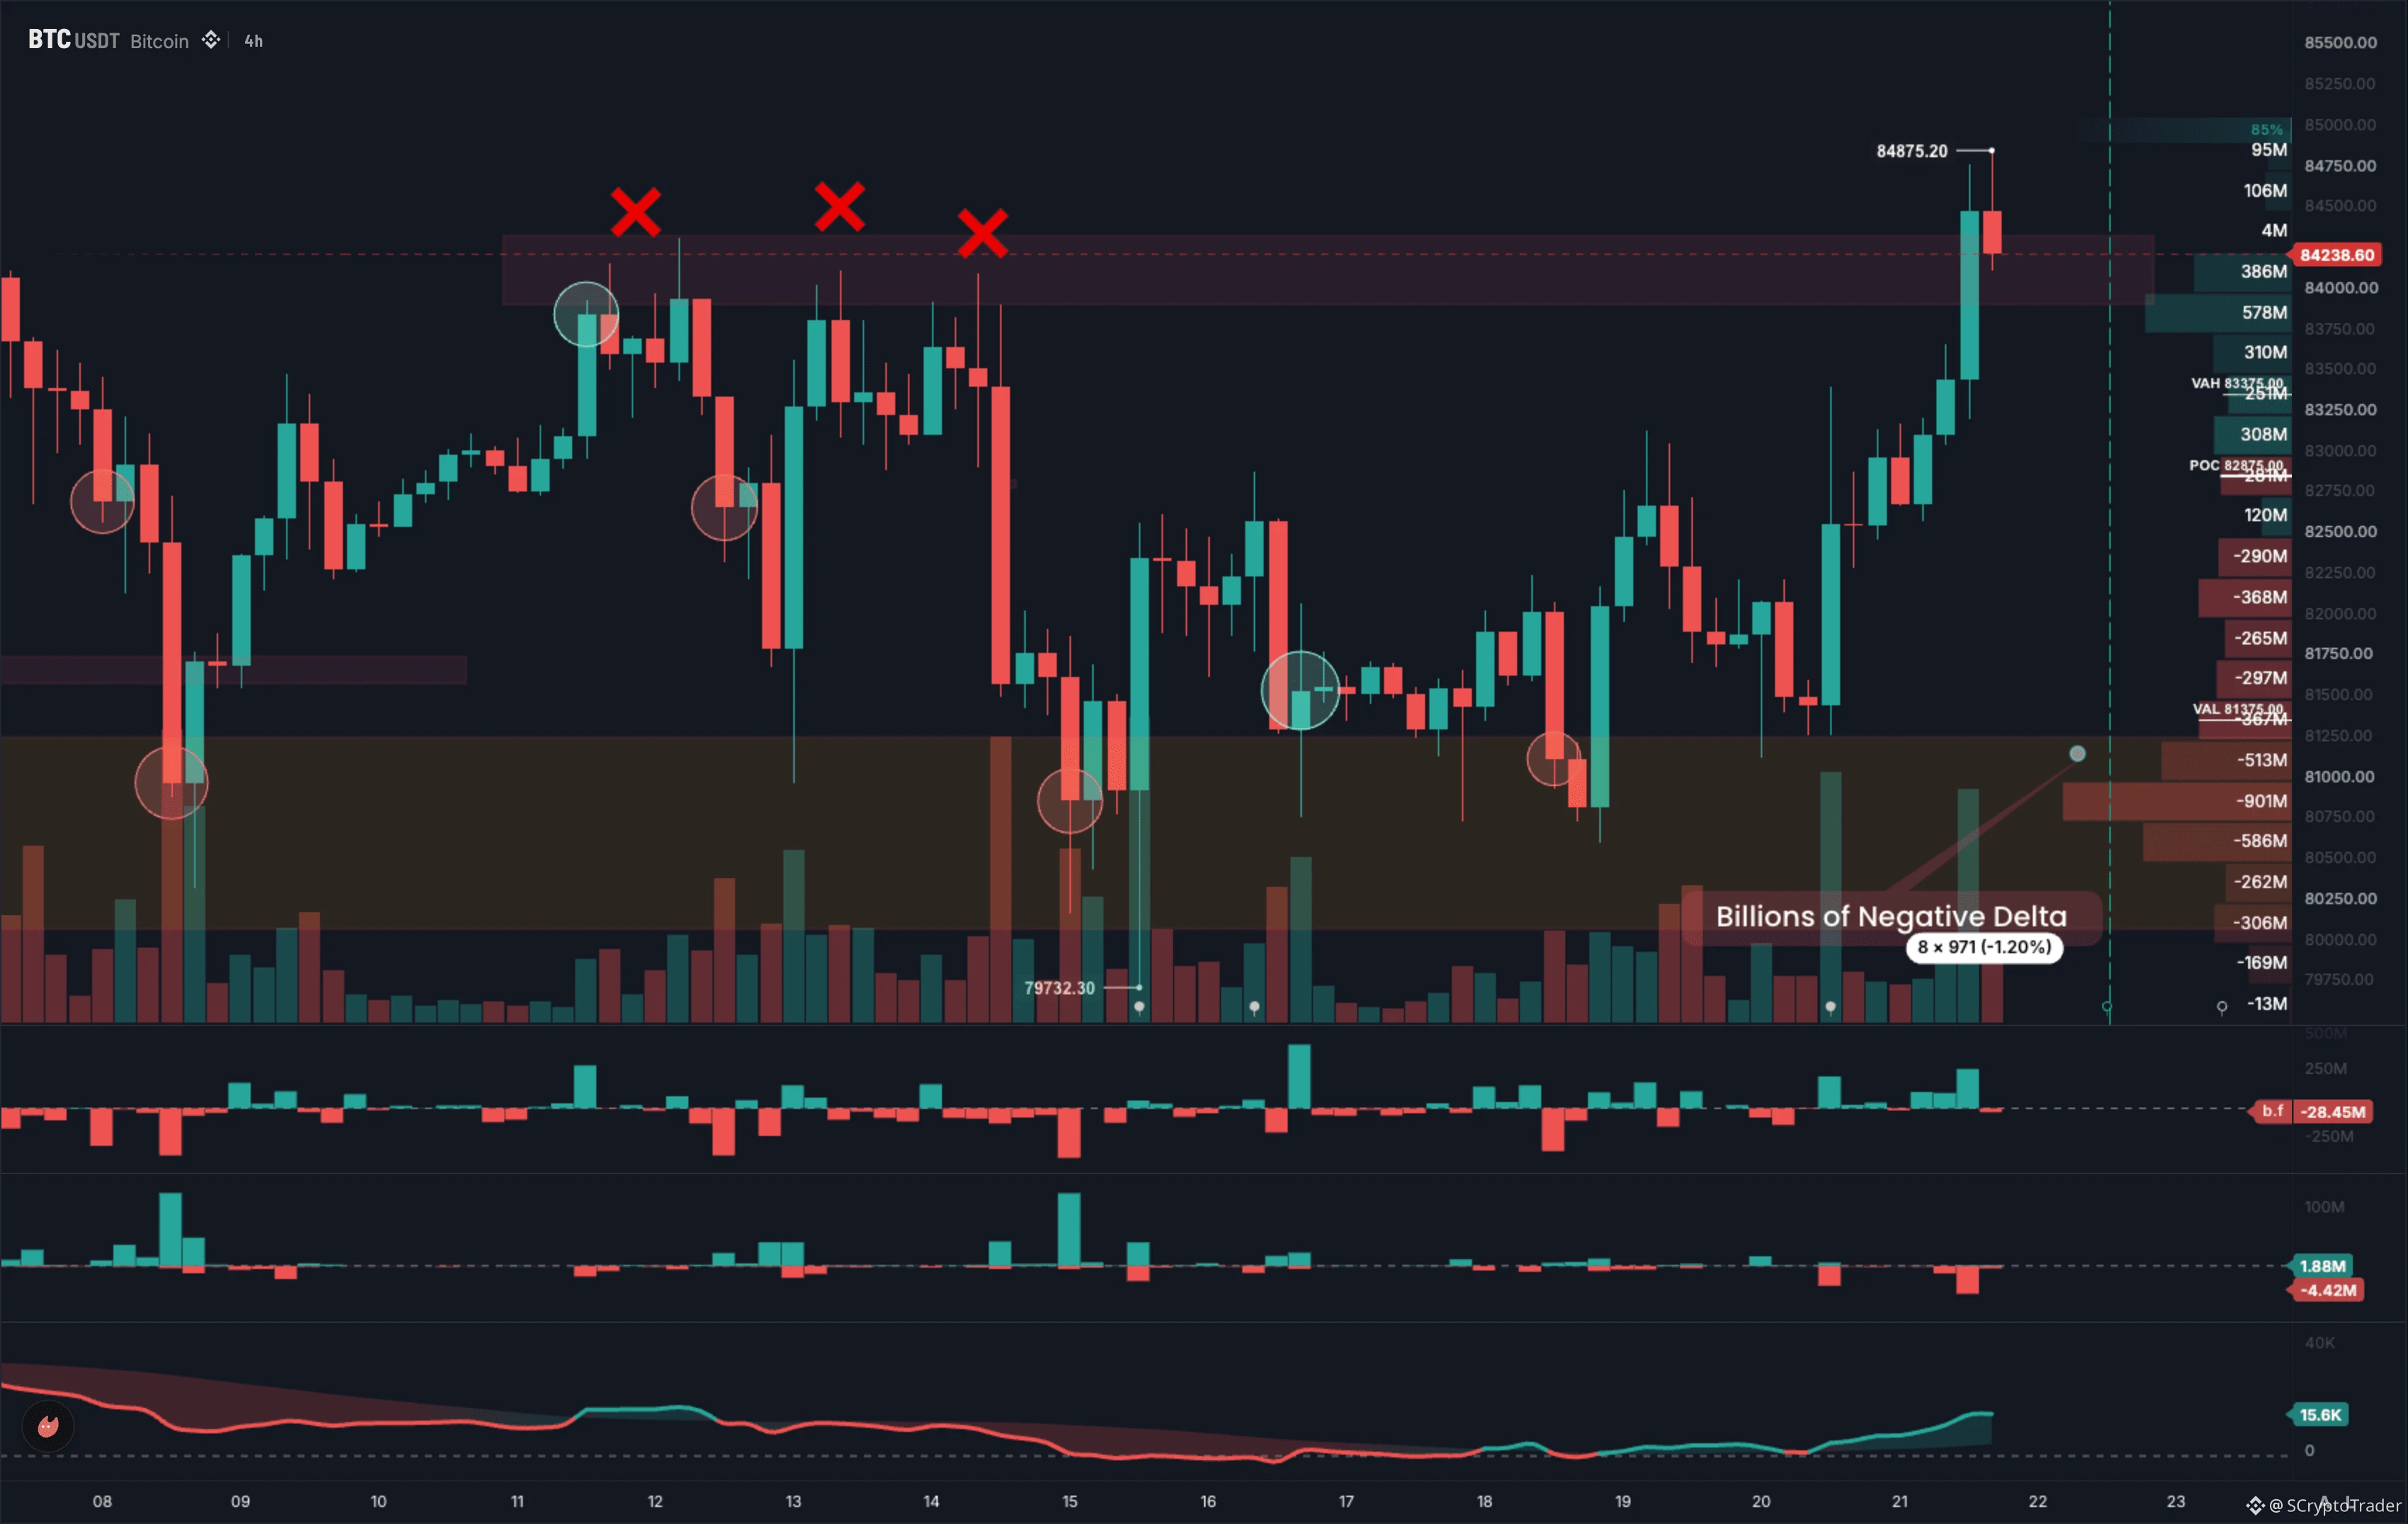
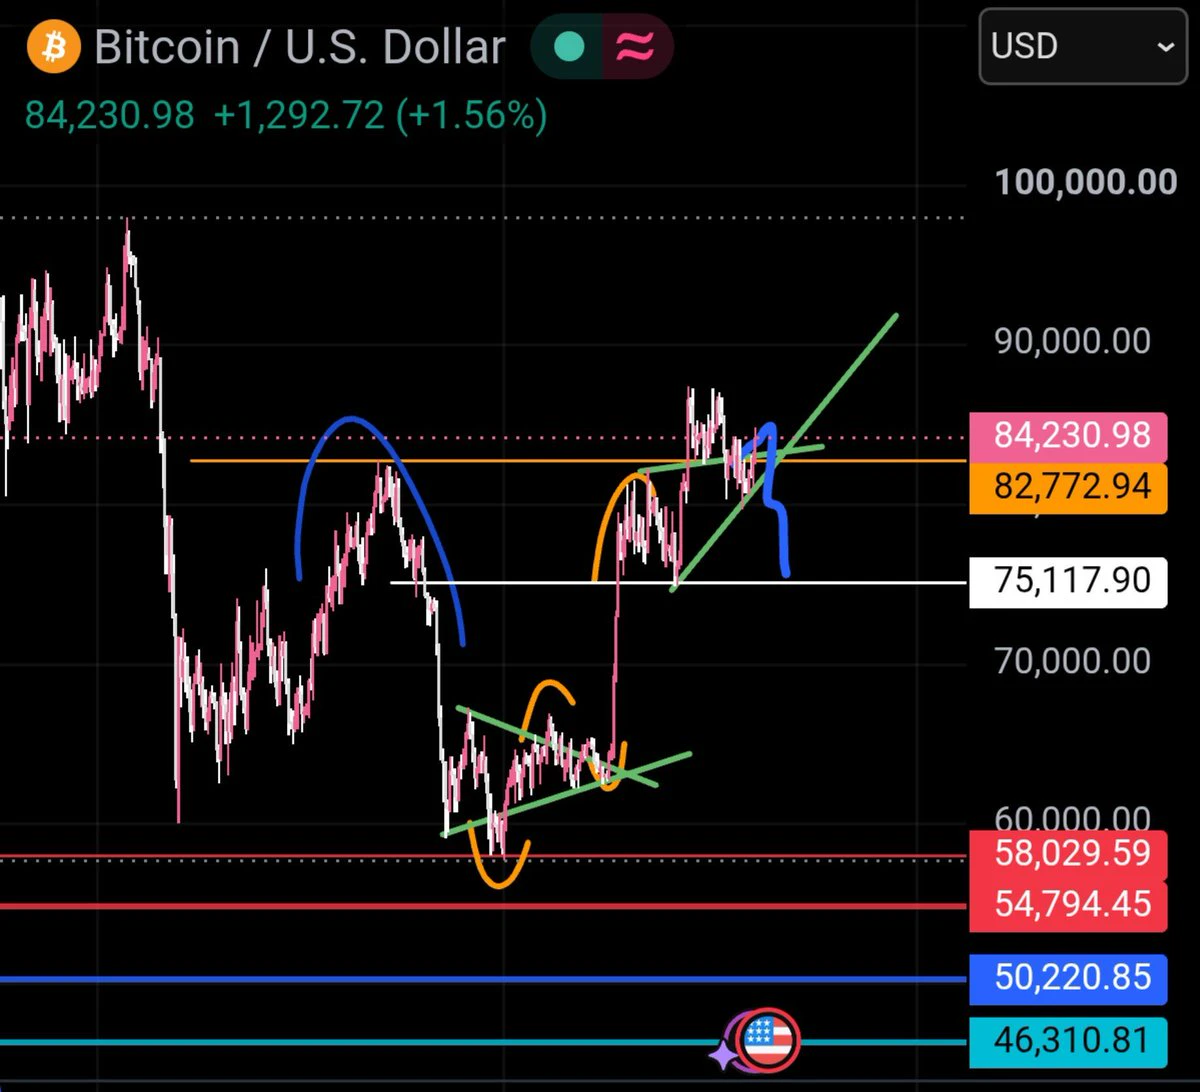
BTC (1H) Bitcoin is consolidating near $81.5K while holding its ascending trendline support.
A bounce could target $81.8K–$82.2K, while losing $81K risks another move toward $80.6K.
post-image
BTC-0.95%
Load More

Join 40 M users in our growing community

⚡️ Join 40 M users in the crypto craze discussion

💬 Engage with your favorite top creators

👍 See what interests you

Trending Topics

USSeptemberPPIBeatsExpectations

91.35k Views1.92k Discussing

US September PPI came in at 6.3% YoY, well above the 5.3% market expectation, pointing to renewed producer-side inflation pressure. Weekly jobless claims were 199K, broadly in line with forecasts. Could hotter inflation further reduce room for rate cuts, and what does it mean for $BTC, US stocks, and gold?

GateWCTCS9GlobalTradingCompetition

37.87k Views6.62k Discussing

GateBTCAndETHFuturesVolumeRanksTop3

53.8k Views1.77k Discussing

View More