Square
Following
Hot
News
Profile

OJBK556688

vip
Active for: 0.5y
Peak Tier 8
No content yet
28
Following
21
Followers
11
Liked
Technical Outlook: SOL Reclaims the 20 EMA, But Bears Still Control the Higher-Timeframe Trend
Solana is attempting a rebound after successfully holding the $76.20–$76.90 demand zone. The price has recovered the 20 EMA and is consolidating above short-term support; meanwhile, the RSI has returned above neutral levels, indicating improved bullish momentum. However, SOL is still trading below the 50 EMA, 100 EMA, and 200 EMA, suggesting that despite the recent bounce, the broader market structure remains bearish.
📈 EMA Structure (Bullish Reclaim in a Bearish Trend)
20 EMA: $76.92
50 EMA: $76.82
post-image
SOL-3.51%
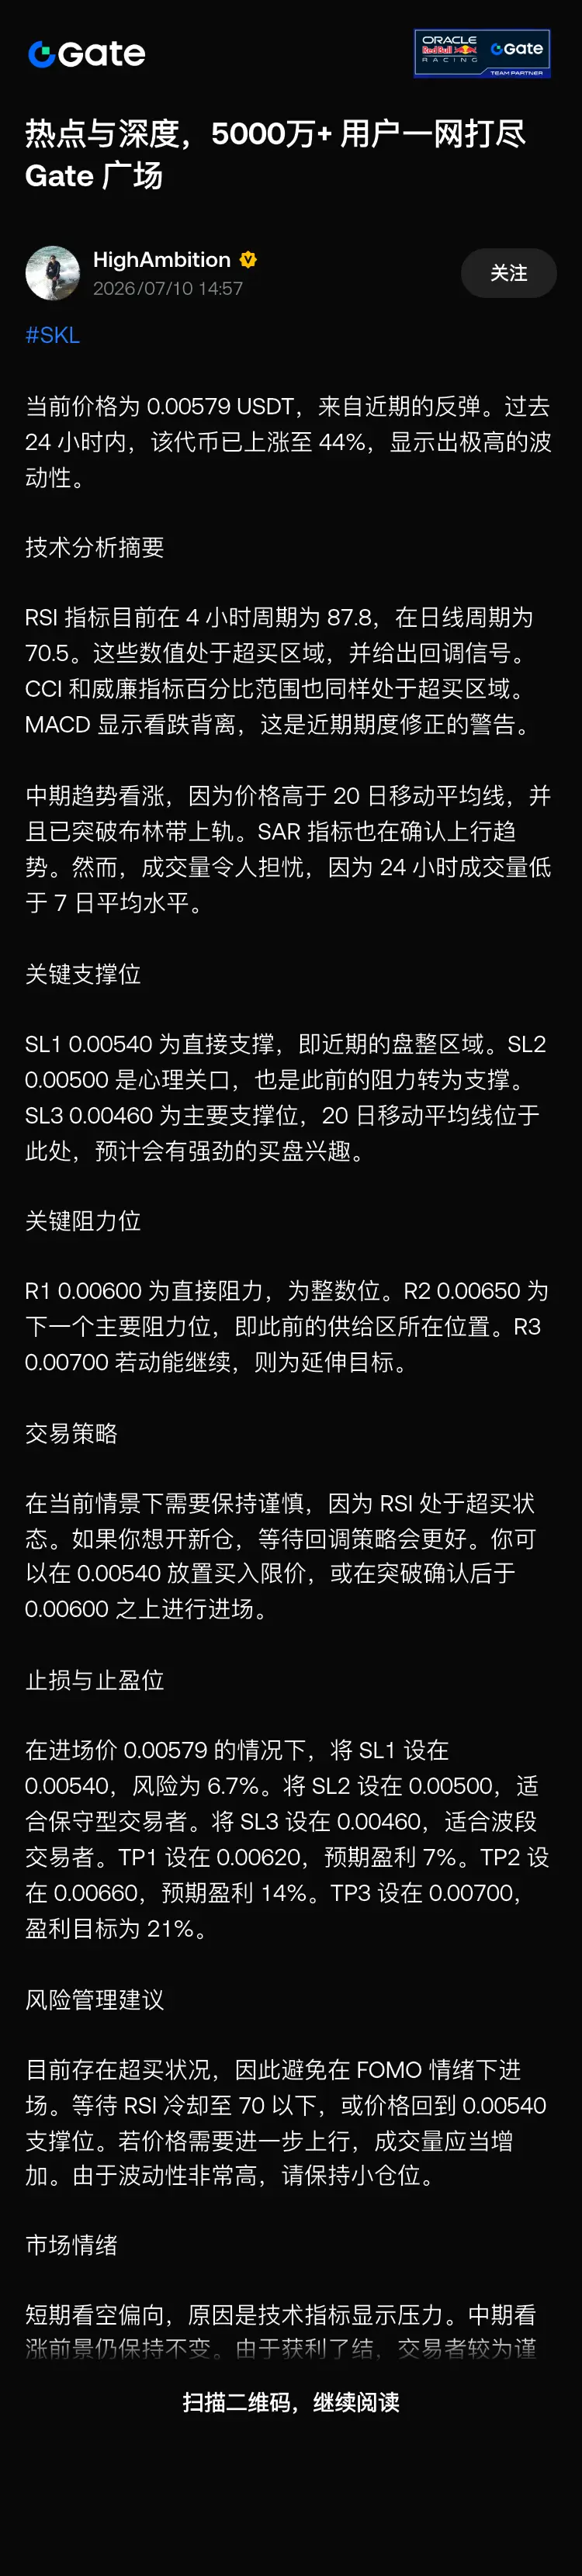
The current price is 0.00579 USDT, driven by a recent rebound. Over the past 24 hours, the token has risen by 44%, indicating extremely high volatility.
Technical Analysis Summary
The RSI indicator is currently 87.8 on the 4-hour timeframe and 70.5 on the daily timeframe. These values are in the overbought zone and provide pullback signals. The CCI and Williams indicator percentage ranges are also in the overbought zone. MACD shows a bearish divergence, warning of a near-term correction.
The mid-term trend is bullish, as the price is above the 20-day moving average and has broken through the u
post-image
Subscription Strategy User Guide
Daily updates of 1 set of levels for day session and 1 set for night session, plus 1 intraday market analysis, covering BTC, ETH, SOL, and Gold (4 instruments). Both long and short directions have two entry levels, and users can choose which instruments to trade.
1. Aggressive Level (First Tier)
Suggested to monitor the chart and place entry orders. Take-profit reference: ETH 15 points, BTC 500 points, SOL 1 point, Gold 10-15 points. Once target is reached, reduce position first, simultaneously set a breakeven stop, and hold remaining position to bet on trend c
post-image
BTC-1.40%
ETH-0.79%
SOL-3.51%
  • 1
Full-scale crash market analysis: Causes of the decline + current practical strategies, explained in one article
1. First, break down the core triggers of this collective sharp drop: Tensions in the US-Iran situation have escalated again, conflicts have intensified, and international crude oil prices surged significantly, directly dragging down the US stock market and the cryptocurrency market simultaneously. However, there is no need to worry about this decline at all — we had already exited at the top and locked in profits at high levels. Many people are now most concerned: Can we enter and
post-image
ETH-0.79%
SOL-3.51%
Trading crypto for a living? Relying on guts alone won't cut it. You need a set of rules earned through hard lessons.
Here are the ones I've honed over the years—every sentence is modest but hits the mark.
$ZEC : When a strong coin drops for eight or nine days straight, don't panic—a rebound signal is often just around the corner.
If a coin rises for two consecutive days, sell half; don't try to catch the very last bit.
If it surges more than 7% in a single day, it usually carries momentum into the next day, but don't chase at that point.
A truly big bull coin? Wait for a pullback wit
post-image
ZEC-2.35%
SOL-3.51%
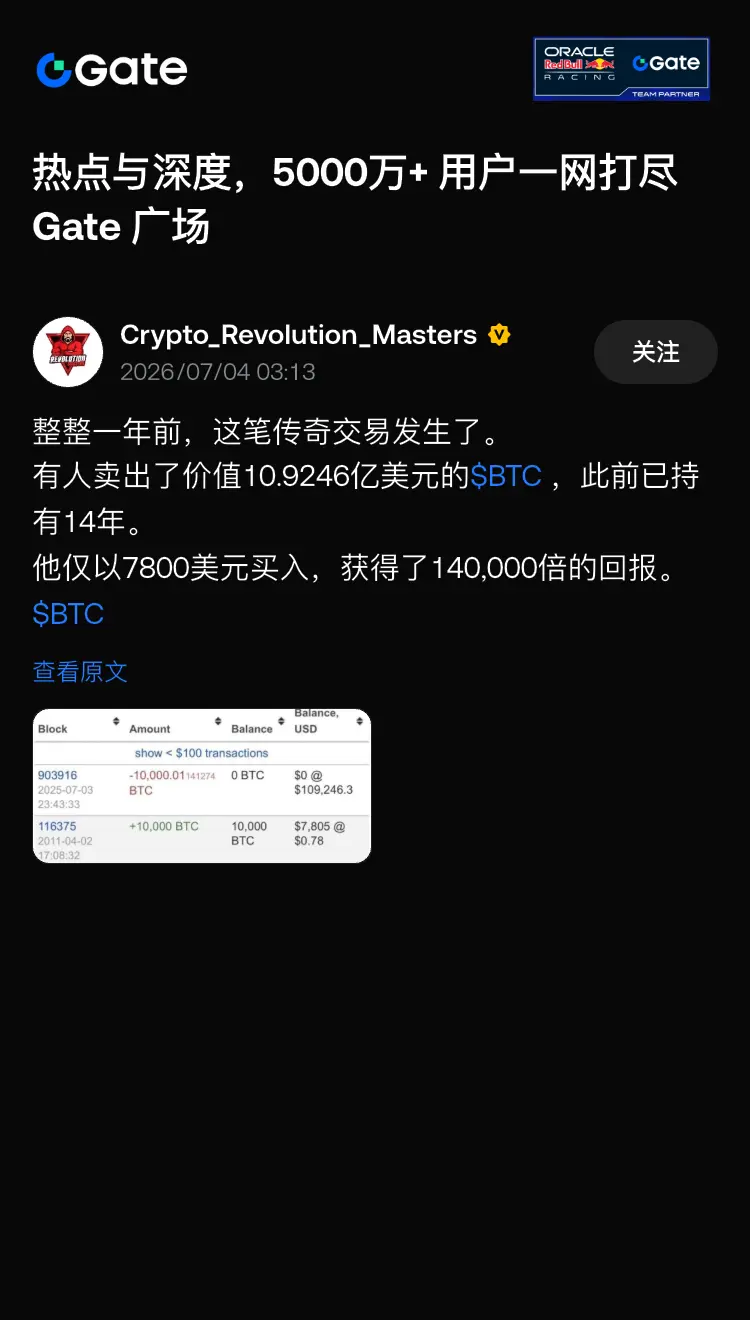
Exactly one year ago, this legendary trade happened.
Someone sold $1,092,460,000 in $BTC after holding for 14 years.
He bought them for just $7,800, making a 140,000x return.
$BTC
post-image
BTC-1.40%
📢 Gate Square Daily | July 3
1️⃣ Industry News: Securitize officially listed on the New York Stock Exchange, providing real-world asset (RWA) tokenization infrastructure for capital markets.
2️⃣ Macro Market: U.S. nonfarm payrolls added 57k in June, unemployment rate at 4.2%, both below market expectations, easing concerns about a near-term Fed rate hike.
3️⃣ Market Update: Crypto market broadly higher, BTC at $61,506, up 1.7% in 24 hours; ETH at $1,698, up 4.7% in 24 hours.
4️⃣ TradFi Update: U.S. stocks closed with the semiconductor index falling 11% over two days, storage sector plunging,
post-image
RWA-0.07%
BTC-1.40%
ETH-0.79%
SNDK-6.57%
📢 Gate Square Daily | July 1
1️⃣ Industry News: Multiple financial institutions including Visa, Stripe, Mastercard, BlackRock, and Coinbase are preparing to launch the stablecoin OUSD, building an on-chain dollar infrastructure for institutional payments and settlements.
2️⃣ Regulatory Update: The U.S. SEC has initiated a new ETF regulatory framework assessment and is soliciting public comments, with a focus on crypto ETFs and prediction market-related products.
3️⃣ Market Update: BTC is at $58,530, down 2.9% in 24 hours; ETH is at $1,569, down 2.8% in 24 hours.
4️⃣ Institutional Moves: Trump
post-image
V+1.40%
MA+1.45%
BLK-0.01%
COIN-0.82%
Deep TechFlow news, June 28, Grayscale Research Head Zach Pandl stated that Strategy should sell over $3 billion in BTC to cover cash obligations and restore market confidence, rather than raising STRC dividends by 50 basis points.
The call from a well-known institutional figure for Strategy to liquidate over $3 billion in BTC is a noteworthy signal. Such a sale would bring significant selling pressure and could weaken the corporate BTC accumulation narrative.
post-image
BTC-1.40%
STRC+0.24%
Deep Tide TechFlow news. On June 27, on-chain analyst Ember monitored that the proxy of the “BTC OG insider whale,” Garrett Jin, placed a ZEC short position worth approximately $21.73 million at a price of $418.9 about half an hour ago.
Currently, about $4.93 million of this short order has been filled, and approximately $16.8 million in orders is still pending. If all orders are filled, Garrett Jin will become one of the largest ZEC short sellers by position size on the Hyperliquid platform.
In addition, his previously established long position of 1,270 BTC, with an average price of $76,117,
post-image
BTC-1.42%
ZEC-2.39%
I want to know, within this signal copying platform,
whether the displayed data has errors.
I’m here to test the data.
When I close my position, it shows a profit.
But why does the signal history data look like this?
Can someone tell me?
Everyone is busy watching the World Cup—
is there anyone who can see this and reply to me #预测世界杯巴西VS海地
The World Cup ends in a month, and I don’t know who the champion will be this time.
Everyone went to watch the World Cup this weekend, so I’ll use this time to rest.
After all, I take a break every weekend from continuous trading and staring at the charts for a long time.
I’ll also take this chance to carefully review the patterns of the World Cup and its impact on the financial markets.
Then I’ll make plans for next week, including picking which assets and focusing on trading volume—if the volume is small, I won’t trade; I’ll only trade popular mainstream coins and bulk commodities.
You're right, this thing hasn't finished dropping yet. We need to wait. Many retail investors see the rebound and think it's a bullish move, but how quickly can the trend really change? Look for a buying opportunity between 51,000 and 52,000. I won't specify exact levels; this is just personal advice. Profit and loss are your own responsibility.
post-image
Empty it out, empty it out, empty, empty, empty, empty, empty, empty, empty, empty, empty, empty, empty, empty, empty, empty, empty, empty, empty, empty, empty, empty, empty, empty, empty, empty, empty, empty, empty, empty, empty, empty, empty, empty, empty, empty, empty, empty, empty, empty, empty, empty, empty, empty, empty, empty, empty, empty, empty, empty, empty, empty, empty, empty, empty, empty, empty, empty, empty, empty, empty, empty, empty, empty, empty, empty, empty, empty, empty, empty, empty, empty, empty, empty, empty, empty, empty, empty, empty, empty, empty, empty, empty, empty
post-image
So, can we short US stocks now? So, can we short US stocks now? So, can we short US stocks now? So, can we short US stocks now? So, can we short US stocks now? So, can we short US stocks now? So, can we short US stocks now? So, can we short US stocks now? So, can we short US stocks now? So, can we short US stocks now? So, can we short US stocks now? So, can we short US stocks now? So, can we short US stocks now? So, can we short US stocks now?
post-image
Where is a good place to buy Bitcoin at the bottom? Does anyone have a position? Let's discuss. I think 57,000 or 49,000 are okay. If not, then 46,000. Where is a good place to buy Bitcoin at the bottom? Does anyone have a position? Let's discuss. I think 57,000 or 49,000 are okay. If not, then 46,000. Where is a good place to buy Bitcoin at the bottom? Does anyone have a position? Let's discuss. I think 57,000 or 49,000 are okay. If not, then 46,000. Where is a good place to buy Bitcoin at the bottom? Does anyone have a position? Let's discuss. I think 57,000 or 49,000 are okay. If not, then
post-image
BTC-1.40%
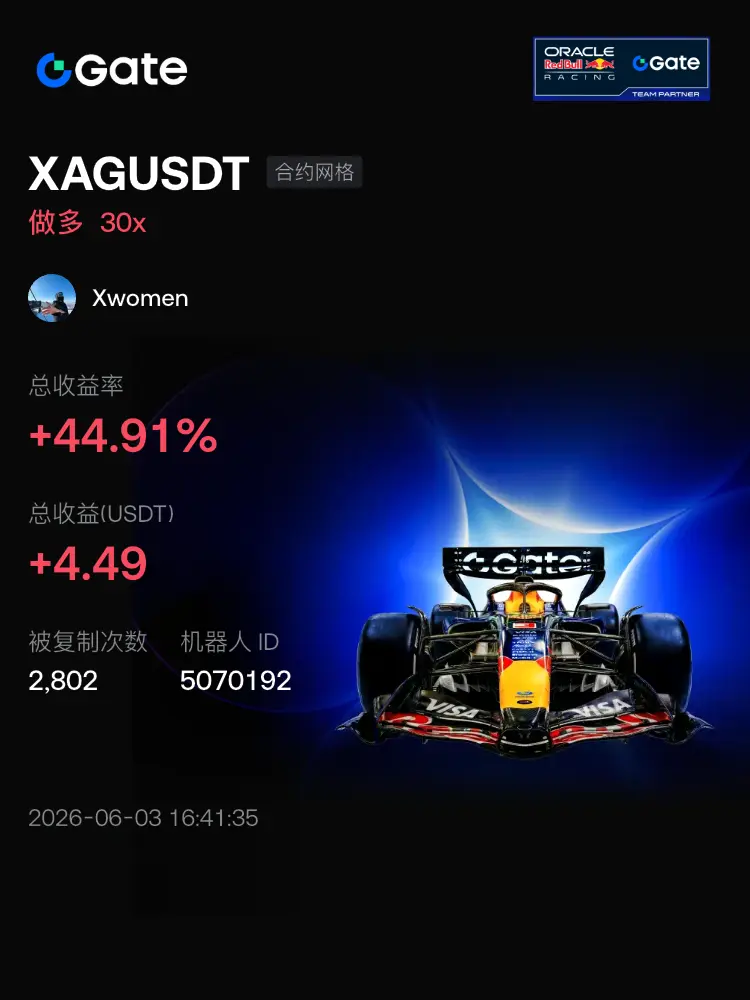
#交易机器人# I am using the XAGUSDT contract grid bot on Gate, let's copy trades together.
post-image
SOL really is like this, I kept shorting it as it kept rising before, short at 92.5, it rose to 99, and when I finally closed my short, it dropped so much. I'm truly convinced. Can I go long now?
SOL re
SOL-3.55%
  • 1