Square
Following
Hot
News
Notifications
Profile
Share your thoughts
placeholder
Article
Why Do Some Tokens Have High Trading Volume but Their Prices Still Fail to Rise?

In the crypto market, a puzzling phenomenon sometimes occurs:

Trading volume keeps growing, and market discussions become increasingly lively, but the token price continues to fluctuate within a range.

Many people assume that rising trading volume means money is flowing in and that the price will soon break out.

But that is not always the case.

Trading volume reflects trading activity, while price changes depend on how buyers and sellers transact and whether the market can continue absorbing selling supply.

post-image
market update
live-cover
LIVE3,731
Trenches
Max
M
bade
b
Max
5qaP...pump
Market Cap
$.
Change
.
24h Vol
$.
Holders
.
mihao
m
bade
b
mihao
4Cxj...pump
Market Cap
$.
Change
.
24h Vol
$.
Holders
.
AGT
A
bade
b
AGT
0x5d...e274
Market Cap
$.
Change
.
24h Vol
$.
Holders
.
DacityCoin
D
bade
b
DacityCoin
DKYc...pump
Market Cap
$.
Change
.
24h Vol
$.
Holders
.
Max
M
bade
b
Max
HPSp...h53z
Market Cap
$.
Change
.
24h Vol
$.
Holders
.
11.12 SOL Market Analysis

Short: around 84.50-85.20, stop loss at 86.20, targets 82.10/80.00.

SOL is currently at 83.54. After plunging from 85.80 to 82.11, the market is now moving sideways around 83.5. The bulls' attempts to push higher are very weak, with price largely held down by the short-term moving averages. The overall bearish mood remains unchanged.

The current price is in the middle of the range, so chasing shorts now could easily get shaken out by a rebound. The 84.50-85.20 area overhead is where positions were left behind during the earlier sharp drop. If price rebounds to test
post-image
SOL-0.74%
Remember: your skills determine how much you can earn, while risk management determines how much you get to keep.
The crypto world has never lacked people who get rich overnight; what it lacks are people who can hold on to their money after making it.
Survive first; only then can you talk about turning things around.
$BTC $ETH $ZEC
post-image
BTC-0.67%
ETH-1.26%
ZEC+1.16%
Why can adding more technical indicators actually make trading decisions more complicated?

Many traders go through a phase when they first start studying technical analysis:

Moving averages aren’t enough, so they add RSI; RSI isn’t enough, so they add MACD; worried that their trend assessment might be inaccurate, they add Bollinger Bands, volume, and other indicators.

The charts become increasingly crowded, and the analysis looks more and more professional—but do trading results really improve as a result?

Not necessarily.

Adding indicators increases the amount of information, but not nec
post-image
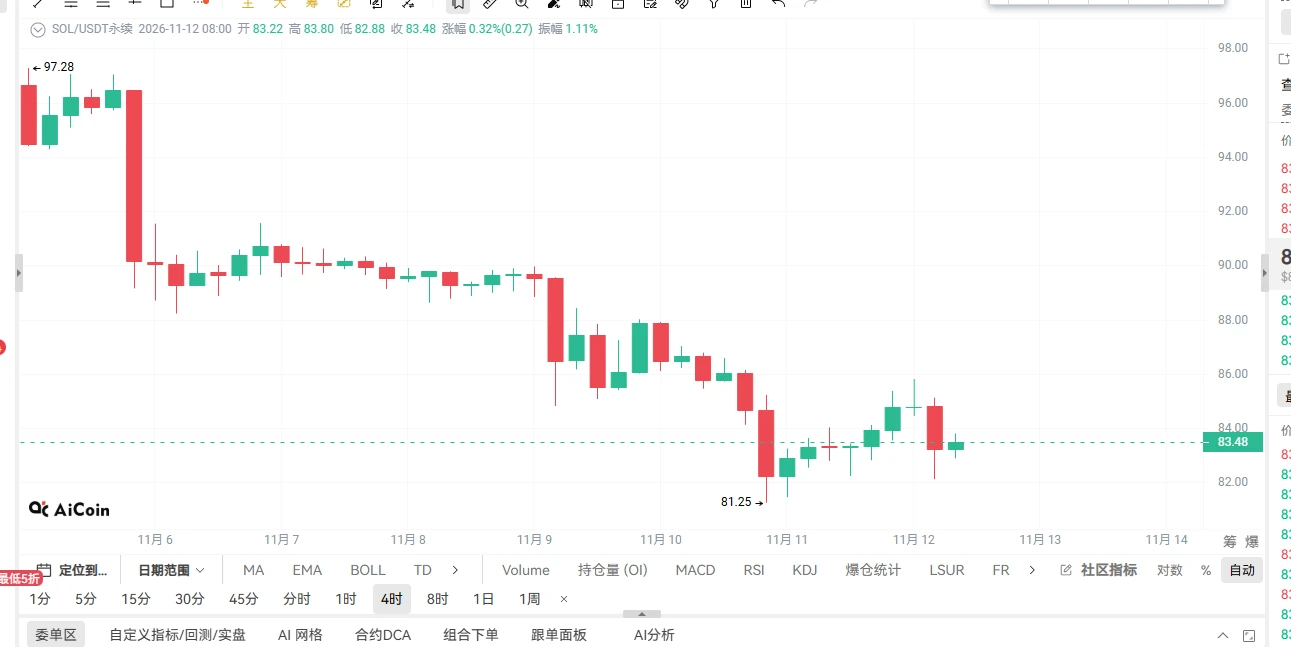
November 12 SOL’s rebound lacks momentum; under pressure, favor shorting rallies
Today’s strategy
Entry timing: Price rebounds to the 84.6-85.2 range
Stop-loss: 85.9
First target: 82.8-82.2
Second target: 81.3-80.8

Key conclusion
According to authoritative reports by the Huaxia Times, expectations for an easing of U.S.-Iran nuclear tensions continue to build, geopolitical risk premiums are fading rapidly, and international oil prices continue to decline. Global risk appetite is generally weak, with high-beta altcoins under more pronounced pressure. On the macro front, news from the Federa
post-image
SOL-0.77%
USIDX+0.11%
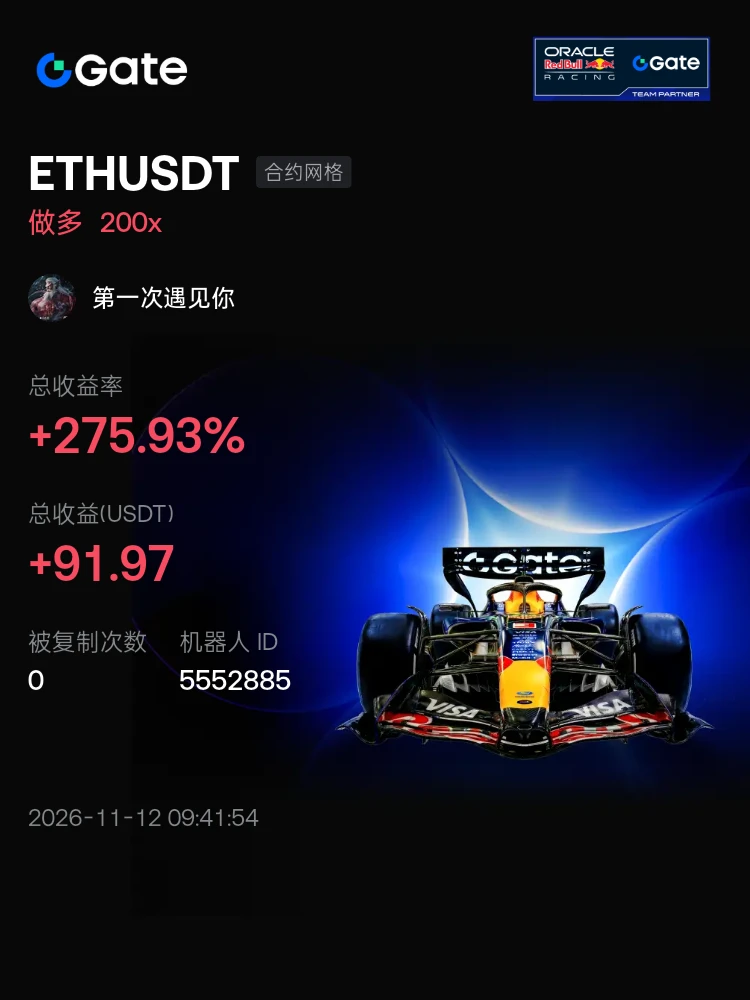
#交易机器人 I'm using an ETHUSDT futures grid bot on Gate; join me in copy trading
post-image
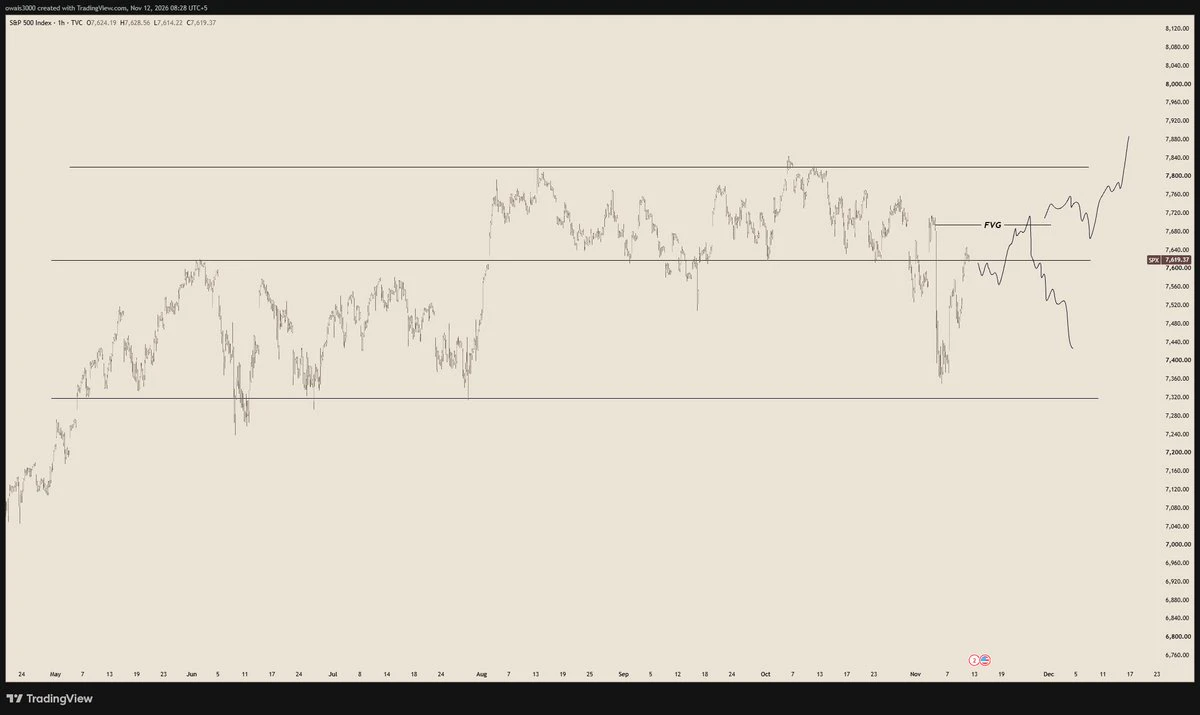
You should really be looking at S&P 500 chart.
These are some clean ranges and good price action, this is my plan for now.
post-image
SPX500+0.19%
[New Streamer]Market Prediction
live-cover
LIVE1,898
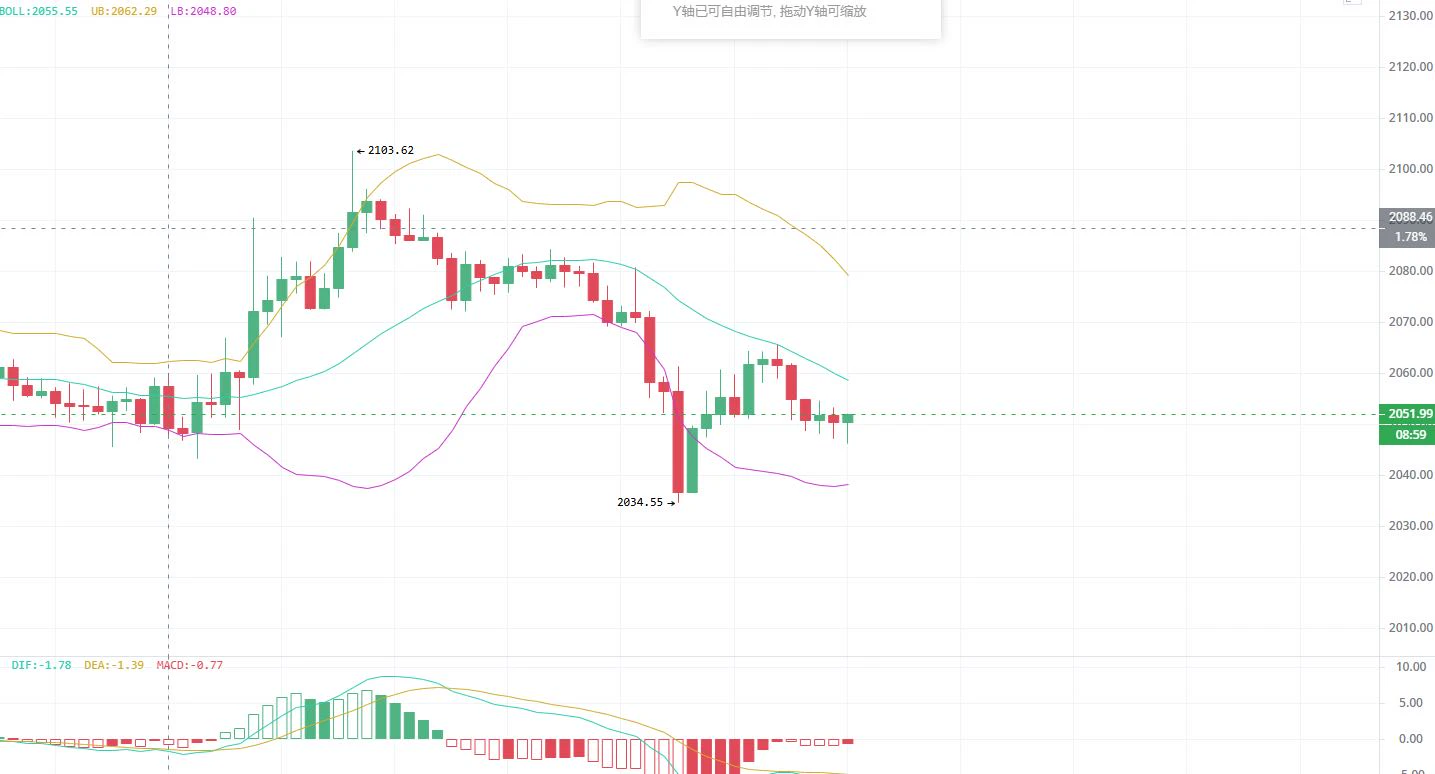
11.12 ETH Silk Road
#美国10月CPI全面超预期
【Market Analysis】
After rallying to the period high of 2103.62, the price came under pressure and pulled back, breaking below the Bollinger midline. The channel turned downward, with the price falling to a low of 2034.55 before stabilizing and recovering slightly. MACD is currently below the zero line. Although bearish momentum has eased, the trend structure has not yet reversed. The market is currently in a low-level consolidation and bottom-building phase after a sharp drop, serving as a pause after the decline. Overhead moving-average resistance remains h
post-image
ETH-1.23%
$IDOL – Short [ max 3-5% + leverage ]Entry: 0.0285 – 0.0305Stop-loss: 0.0321 [12% above entry price]Take-profit 1: 0.0255Take-profit 2: 0.0236Take-profit 3: 0.0215[ Price is returning to the shorting zone, the opportunity is here, everyone ]
post-image
IDOL-6.71%
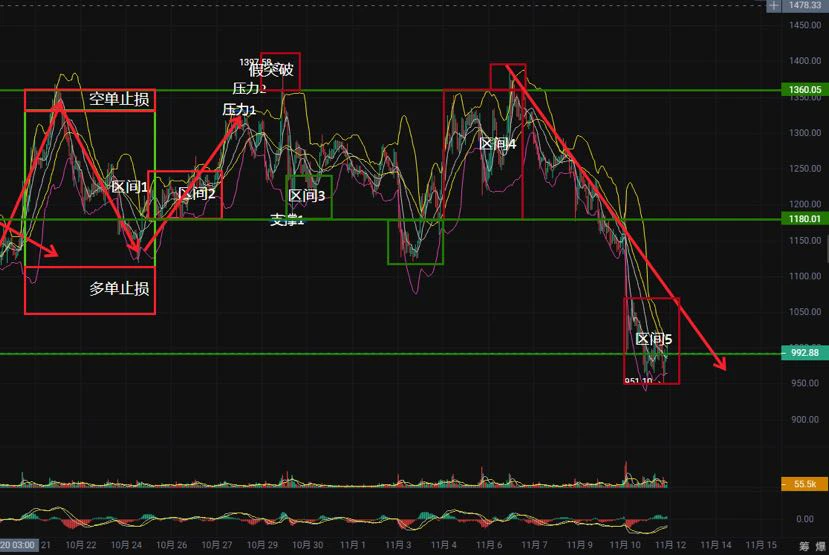
11.12 Achen ZEC Public Strategy
[Short Strategy] $ZEC
  Entry range: around 1040-1070
  Stop-loss: 1100
Take-profit levels
  First target: 1032
  Second target: 996
Trend target: 976
Long-term target: below 953

[Market Analysis]: The Bollinger Bands are opening and diverging downward. The larger time frame remains bearish, with no sign of convergence or reversal. The MACD lines are below the zero axis, with no golden-cross recovery pattern. Market depth shows a balance between longs and shorts, while heavy selling of major assets over the past five days has driven the
post-image
ZEC+1.29%
The hotter the prediction market gets, the more important it is to stay calm! What risks lie behind $1.8 billion in revenue?

Seeing Polymarket’s annualized revenue surpass $1.8 billion, many people may first wonder: Is this sector about to produce another wave of wealth stories?
Don’t rush to start dreaming about retirement!
Prediction markets are indeed heating up. U.S. platforms saw nominal trading volume exceed $14.5 billion in October, further raising the industry’s profile.
But behind all the buzz, there are several questions worth considering.
First, trading volume is not the same as pl
SNDK+13.75%
  • 16
2013-2026
A lot has changed in these 13 years
☀️ GM! The market has rebounded, but don't rush to call it just yet. 🧐
The Nasdaq rose 1.6% overnight, while $CRWV surged about 24.7%, as AI tech stocks rebounded. But BTC is still under pressure around $74K , and PPI is due tomorrow evening. 👀

📌 Today's featured topic: Do you think this rebound is for real?
💻 AI tech stocks: Can this earnings-driven rebound continue?
₿ BTC: When will it catch up?
📊 Trading strategy: Look for opportunities now, or wait for more confirmation?

🎁 Share your market insights and trading strategies on Gate Square. Post to earn red envelope rewards, with lar
post-image
NDAQ-0.29%
CRWV+24.85%
BTC-0.67%
Yesterday’s BTC long setup: the first target was banked, and the second was only a little over 200 points from the key level.

“Hitting the bullseye from a hundred paces is no accident; even a hair’s breadth reveals deep skill.”

Whatever direction the market takes, its structure was mapped out long ago. Enter at the Bollinger Band support level and anticipate resistance at MA60. The market never lacks opportunities; what’s lacking is the eye to recognize the structure in advance. $BTC ‌
BTC-0.65%
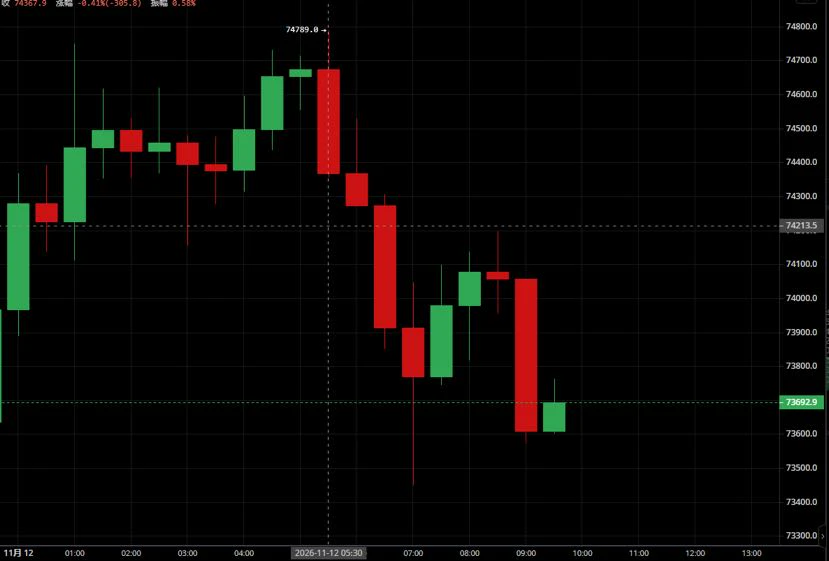
11.12 $BTC Early-Morning Outlook
The bearish structure persists, with the rebound to 74789 meeting resistance and pulling back; the primary bias is to short rallies, while using small positions to trade rebounds at support and widening the range to cover key support and resistance levels.
#美国10月CPI全面超预期
Support: 73200-73500 (first support), 72600-73000 (strong support zone)
Resistance: 74400-74700 (first resistance), 75200-75500 (strong resistance zone)
Short: Open positions in batches on a rebound to 74400-74700; add at 75200-75500; stop-loss at 75800; first target 73500, then look to 72800
post-image
BTC-0.67%
  • 1
Why Can a Trading Strategy’s Returns Look Stable While Hiding Significant Risk?

A trading strategy earns a little each day, posts multiple consecutive wins, and rarely incurs a loss.

At first glance, this may seem like a very stable strategy.

But if the market suddenly reverses, the profits accumulated so far may disappear quickly, or even turn into losses far greater than expected.

Why does this happen?

Because stable returns do not mean low risk, and a high win rate does not guarantee long-term profitability.

To judge whether a strategy is reliable, you need to look at the risk structu
post-image
Jensen Huang never met me but he still fucked my position.
post-image
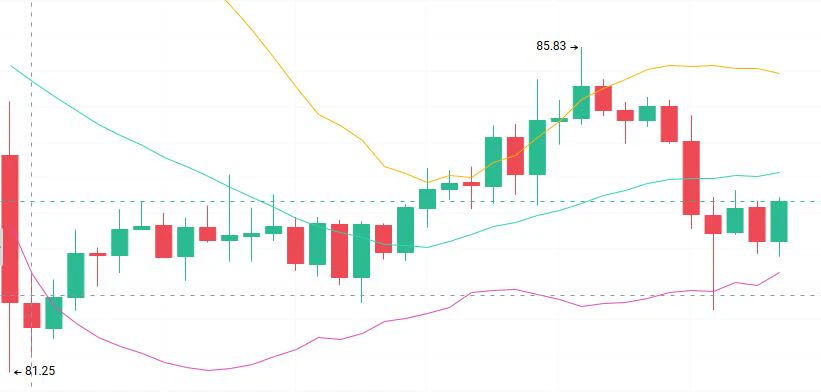
11.12 SOL Analysis

Analysis: Short near 84.5-85.5 on a rebound, with a stop at 86.2, first target 82.5, and second target 81.3

On the 1H chart, the price rebounded from a low of 81.25 to a high of 85.83 before facing resistance and pulling back, breaking below the cyan moving average. The yellow Supertrend resistance line is near 85.5. The 84.5-85.5 zone is a confluence resistance area with concentrated trapped positions; the price is likely to weaken again if it rebounds into this area, so favor shorting at higher levels. #美国10月CPI全面超预期 $SOL ‌
post-image
SOL-0.77%
Load More

Join 40 M users in our growing community

⚡️ Join 40 M users in the crypto craze discussion

💬 Engage with your favorite top creators

👍 See what interests you

Trending Topics

GateIPOAccessAnthropic

246.63k Views2.29k Discussing

Gate IPO Access Phase 3 features Anthropic (ANT), with USDT subscription interest starting from 100 USDT. Successful allocations will be delivered as real shares to Gate Stock Accounts. Indicative price: $70–$78/share Subscription: Nov 12–17 (UTC+8) Allocation is not guaranteed. Please manage risk accordingly.

GateGlobalComplianceExpansion

53.89k Views468 Discussing

USIranTalksShowNewProgress

170.63k Views1.43k Discussing

View More