
Square
Following
Hot
News
Notifications
Profile
Share your thoughts
placeholder
Article
I @blknoiz06
post-image
Build a small position in $JCT to capture potential long-term upside. – Long entry: 0.010– 0.011 Stop-loss: 0.0081 Take-profit 1: 0.014388 Take-profit 2: 0.021907 Take-profit 3: 0.028496 Small position only. Volatility is high after the recent rally.
post-image
JCT-3.26%
Trenches
牛逼
牛
bade
b
牛逼
0x96...7777
Market Cap
$.
Change
.
24h Vol
$.
Holders
.
STONK
S
bade
b
STONK
6GmA...UNgx
Market Cap
$.
Change
.
24h Vol
$.
Holders
.
BTC
B
bade
b
BTC
C5xp...pump
Market Cap
$.
Change
.
24h Vol
$.
Holders
.
PUSSY
P
bade
b
PUSSY
FZxH...Loat
Market Cap
$.
Change
.
24h Vol
$.
Holders
.
PIEVERSE
P
bade
b
PIEVERSE
0x0e...25a9
Market Cap
$.
Change
.
24h Vol
$.
Holders
.
Would you let an AI agent sign a transaction for you, anon? My cat's robot intern is already doing the paperwork. Probably nothing.
post-image
$XAU ‌ (Gold) Trend: Bearish The price has the potential to decline toward the 4,098–4,073 area. The price failed to break through the 4,131 resistance level. Selling pressure is evident following a rebound. Short-term momentum is beginning to weaken. Alternative scenario: If the price manages to break firmly above 4,131, there is potential for a bullish move toward 4,140. Conclusion: Currently bearish, though not yet fully confirmed. Await further confirmation.

Note: Crypto and stock transactions carry the risk of loss. Please conduct your own research (DYOR) before trading. This informatio
post-image
XAU+0.38%
  • 3
$BINC
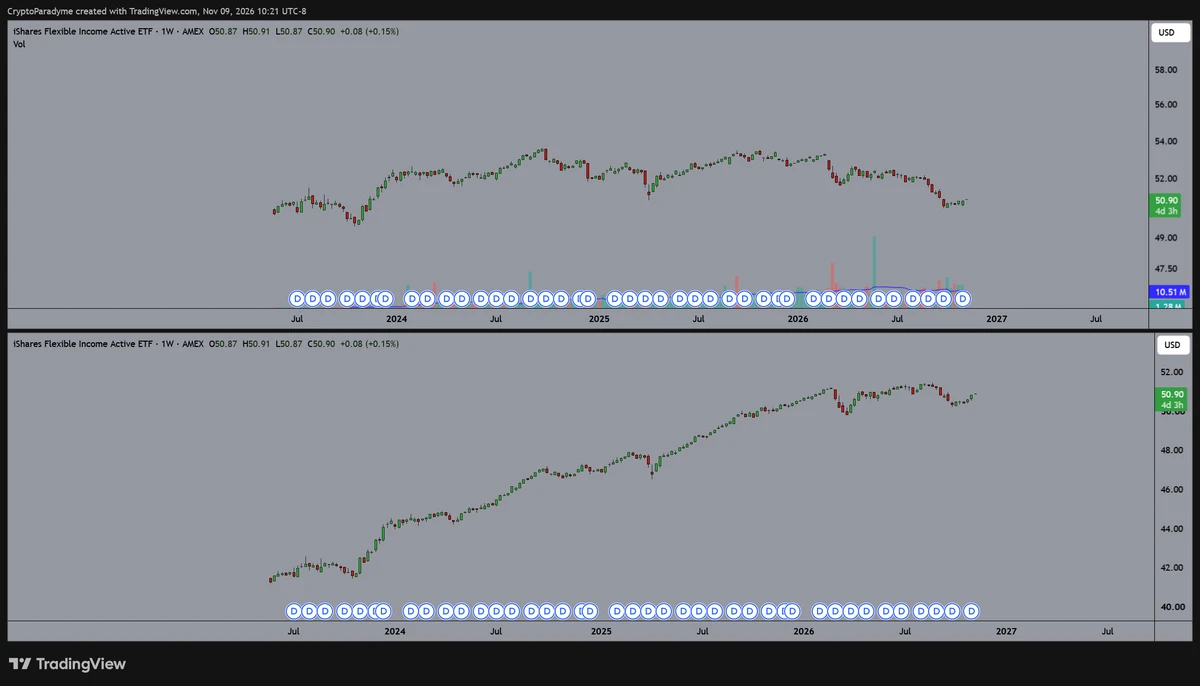
not a name people talk about much but when you adjust for total returns it's pretty much up only.
~ a full retrace to listing price with the bond shenanigans a few months ago.
if you're into income assets at all, seems like a discount still.
post-image
$BINC
not a name people talk about much but when you adjust for total returns it's pretty much up only.
~ a full retrace to listing price with the bond shenanigans a few months ago.
if you're into fixed income at all, seems like a discount still.
post-image
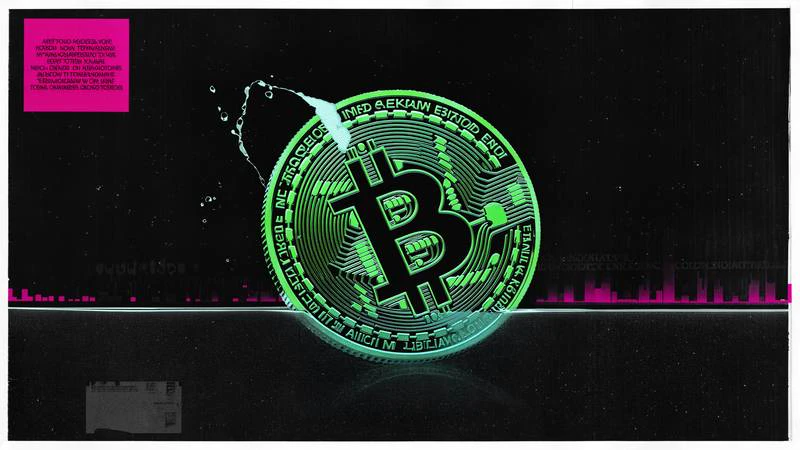
Bitcoin Trades Below Strategy’s $75,451 Average Purchase Price
MicroStrategy's disclosed 849,327 BTC were worth about $63.58 billion at the Sunday quote, below their $64.08 billion acquisition cost.
⚠️ Personal market analysis only. NFA — manage risk and DYOR.
Educational content, not investment advice or a recommendation to buy, sell, deposit, or withdraw any asset. No paid promotion or referral/affiliate links.
post-image
BTC-0.67%
Live Trading Session: Crypto & Forex Levels
live-cover
LIVE209
#NvidiaCEOUnderInvestigation
NVDA Under Pressure: Congressional Testimony Request and Technical Breakdown

While the broader semiconductor sector attempted to recover, Nvidia ($NVDA) continues to face significant selling pressure. The primary catalyst for the recent negative sentiment is the news that the U.S. Congress has summoned CEO Jensen Huang to testify regarding alleged ties to a Chinese spy. This development adds further regulatory and geopolitical uncertainty for the company.

Technical Analysis (1D Chart)

The daily chart shows a clear downward trend across all indicators:

· Price
NVDA-5.65%
  • 7
$INIT is showing signs of a strong rebound! After consolidating near $0.12 for a long time, buyers are entering with fresh momentum. The latest 4-hour candle is pushing toward resistance at $0.142. Add INIT to your watchlist. A confirmed breakout could kick off a new rally. Buy and trade $TRUMP
$SNDK
post-image
INIT-2.53%
TRUMP-0.95%
SNDK-0.18%
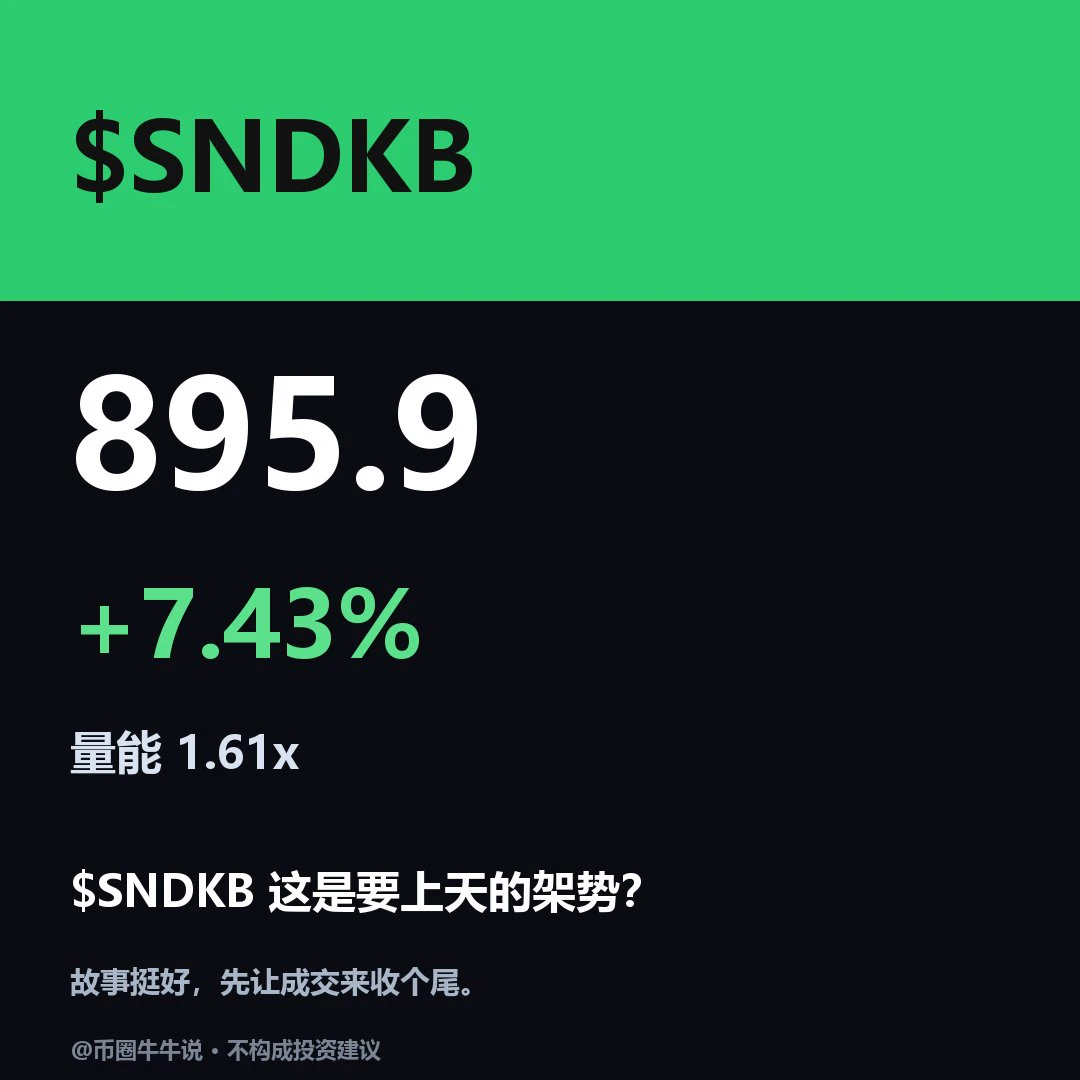
$SNDKB Currently at 895.9, up 7.44% over 24H (range: 790.72–904.83). 1H is strong, with an RSI of 68.25; 4H is strong, with an RSI of 64.29. Price needs to break above and hold 904.83; a drop below 790.72 would signal weakness. In the next review, watch whether price can hold above 904.83 or rebound after losing 790.72. Market volatility is high; for observation only.
post-image
The most critical point in today's market
$AMD 's positive contribution to Q basically offset Nvidia's drag. Estimated at the same time:
AMD: contributed about +0.42 percentage points to Q.
$NVDA : down about 5.33% at the time, dragging Q down by about −0.41 percentage points.
AMD is currently above today's extreme position-reduction level, with calls above it seeing substantial position reductions.
$AVGO is also nearing the GEX Wall at 320.
For Q, here comes the key point: whether AMD can hold above a market price of 500.
For bulls, today's target price has been more than met. Whether bulls
post-image
AMD+12.64%
NVDA-5.65%
AVGO+8.60%
[New Streamer] Market Updates!!!
live-cover
LIVE981
What does a protocol funding its own build look like?
@turtledotxyz booked $1.04M in Q3 revenue (Turtle and Lunar Strategy, cash in basis, net of intercompany).
It came from services and distribution while the tools were still being built.
➙
post-image
TURTLE-1.65%
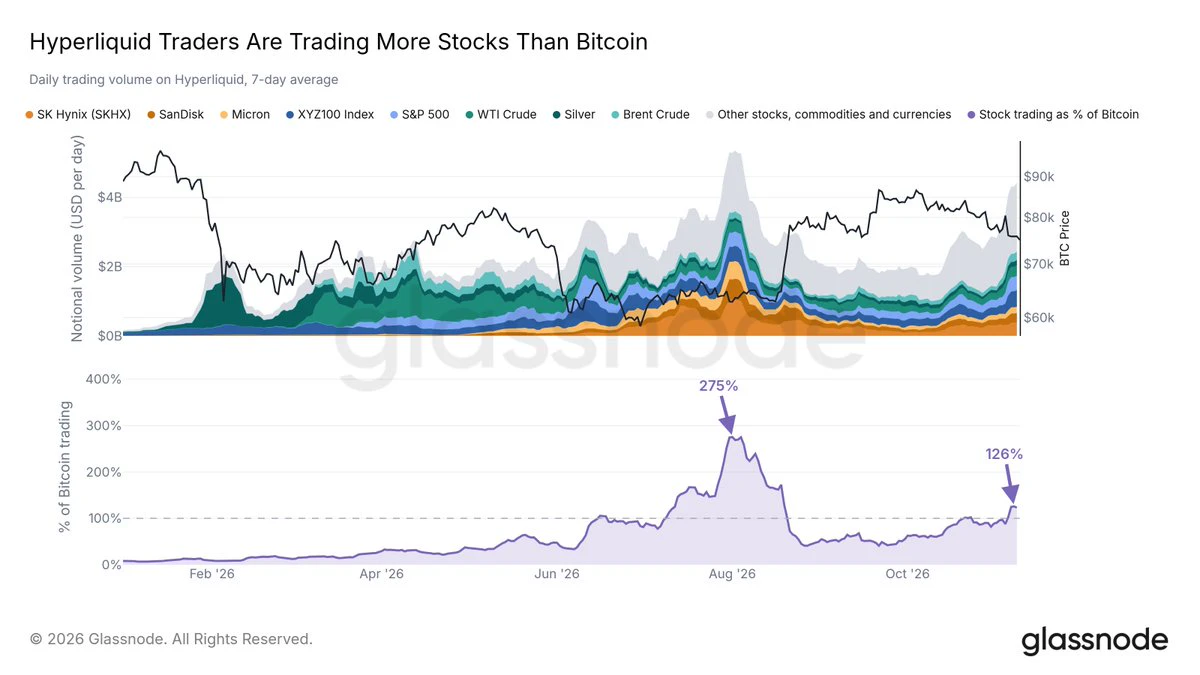
Equities volume on Hyperliquid has overtaken bitcoin:native volume again.
Both Bitcoin and stocks have been grinding lower for weeks but crypto-native traders seem to be chasing the stock dip.
The last time the ratio peaked, in August, BTC was near its lows before breaking out.
post-image
HYPE+0.24%
BTC-0.67%
#$XAU

Gold still over $4100 dollar and it still staying strong , according to analysis in this Month Gold prices will end between $4000 dollar and $4200 dollar ..
post-image
The worst off are Nvidia shareholders.
A photo of Jensen Huang and Alice Huang had been up on her WeChat Moments for over half a year. Everyone thought it was AI-generated and scrolled right past.
But some people didn’t scroll past. The people who first broke the story on X opened short positions on Nvidia as they tweeted about it. Based on prices around those days, they’ve now made nearly 20%.
With the same photo, some people liked it after seeing it, while others opened a short position. With the same photo, some people liked it after seeing it, while others opened a short position.$NVDA ‌#
NVDA-5.65%
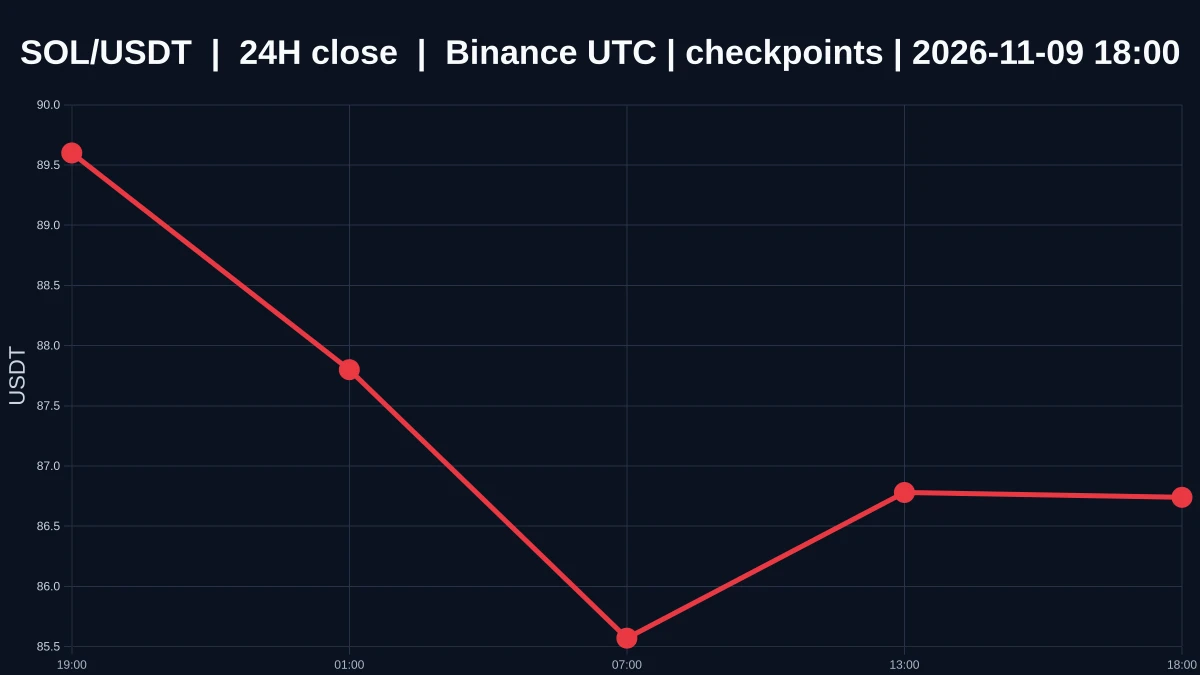
$SOL ’s Price Has Already Moved—Why Has Trading Volume Yet to Catch Up?

$SOL is currently priced at 86.71, down 2.726% over 24 hours. The 1-hour and 4-hour trends both point to weakness, but the volume ratio is only 0.0787, indicating notably low market participation. This mismatch between price direction and trading activity reflects a disconnect between short-term capital flows and the lack of broader market consensus.

Looking at key levels, the current price is just 1.69 points above the 1-hour support level at 85.02 and 13.01 points below the 1-hour resistance level at 89.72. This positio
post-image
SOL-0.77%
$BTC ‌ BTC may see further weakness after failing to sustain its gains. The price remains below the MA5 and MA30, indicating that bearish pressure is still dominant. - Support: 74,314 – 73,550 - Resistance: 75,000 – 75,211 - MACD: Momentum is beginning to improve, but a bullish reversal has not yet been confirmed. Conclusion: BTC has the potential to decline and test the 74,314 area—or even 73,550—should selling pressure persist. The bearish scenario would be invalidated if the price manages to break through and hold above 75,211.

Note: Crypto and stock transactions carry the risk of loss. P
post-image
BTC-0.65%
  • 3
  • 1
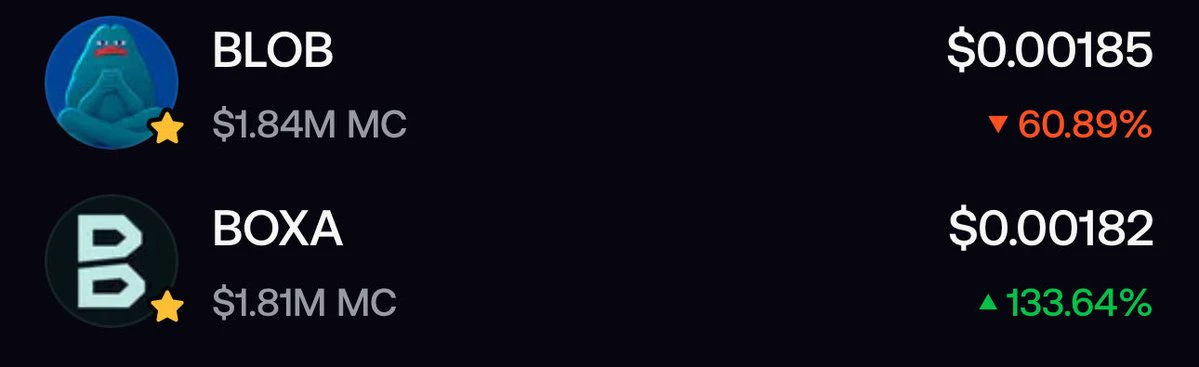
Both 100M coins btw.
Both shared sub 200K.
post-image
BTW-7.42%
Load More

Join 40 M users in our growing community

⚡️ Join 40 M users in the crypto craze discussion

💬 Engage with your favorite top creators

👍 See what interests you

Trending Topics

USCPIDataIncoming

42.29k Views2.03k Discussing

The U.S. October CPI report will be released on November 10 at 8:30 a.m. ET. September CPI came in at 3.7% year over year, and markets will be watching closely for signs that inflation is cooling, especially in core CPI. A softer-than-expected reading could strengthen rate-cut expectations, while hotter inflation may pressure risk assets through higher Treasury yields and a stronger dollar. How do you think this CPI print will move $BTC, U.S. stocks and gold?

RedBullDoublePodiumInBrazil

8.81k Views30.59k Discussing

BTCFlashCrash

191.29k Views66.58k Discussing

View More