Share your thoughts
placeholder
Article
XRP is range-bound but the 1h setup screams short before the move down.

$XRP /USDT - SHORT

Trade Plan:
Entry: 1.3936 – 1.3996
SL: 1.4251
TP1: 1.3752
TP2: 1.3610
TP3: 1.3396

Why this setup?
Why now? The 1h price sits at 1.3966 inside a tight entry zone between 1.3936 and 1.3996, while the 15m RSI at 48.47 shows neither overbought nor oversold exhaustion. The 1h ATR of 0.011872 proves the volatility is compressed enough for a decisive break, and the daily trend being range-bound means a directional snap is overdue. The invalidation level at 1.4101 is the hard line in the sand that separate
XRP-0.51%
🚀 NVDA Testing Key Levels — Is The AI Leader Ready For Another Breakout?
$NVDA is trading around the $230.36 level, and this area is becoming a key decision point for the next move. After dropping toward lower support zones, Nvidia showed strong recovery momentum and buyers stepped in again, pushing the stock back above the $230 area.
The biggest reason investors continue watching NVDA is the strength of the AI story. Nvidia remains at the center of AI infrastructure growth, with demand for advanced chips and data center solutions continuing to support the long-term trend. Recent earnings mo
NVDA+0.87%
Nobody is talking about this bullish setup hiding in plain sight right now.

$USELESS /USDT - LONG

Trade Plan:
Entry: 0.22428 – 0.23130
SL: 0.19408
TP1: 0.25307
TP2: 0.26992
TP3: 0.29520

Why this setup?
Why now? The daily trend is firmly bullish, and the 1h ATR of 0.014044 shows volatility is compressing just before a potential expansion. The 15m RSI at 54.85 proves there is no overbought exhaustion yet, while the 1h price sitting at 0.22779 places us exactly at the entry reference. This means the entry zone between 0.22428 and 0.23130 is live, targeting TP1 at 0.25307 and TP2 at 0.26992,
USELESS+4.25%
$SPCX /USDT is range-bound on the daily trend but the 1h ATR whispers a short is forming.

$SPCX /USDT - SHORT

Trade Plan:
Entry: 150.04 – 150.28
SL: 151.35
TP1: 149.27
TP2: 148.67
TP3: 147.78

Why this setup?
Why now? The daily trend is range, which means the 1h price of 150.16 sits at a natural magnet for mean reversion. The 15m RSI reading of 48.86 confirms the short-term momentum is neither oversold nor overbought, allowing a clean entry within the 150.04 to 150.28 zone. The 1h ATR of 0.496517 quantifies the volatility contraction before a potential snap-back toward TP1 at 149.27. If t
SPCX-0.67%
Greece was amazing btw.
the views were insane, the food/wine was delicious, the people were incredibly friendly, and the history is fascinating
plus I ate like a king while I was there and somehow lost 7 pounds.
unreal.
post-image
I did nothing—just went to the restroom, and when I came back, the candlestick chart had already done the work for me. During the intraday bottoming phase, $HYPE hovered around 83.949 for most of the day. It ranged sideways at the bottom without breaking down, so I judged that this wasn’t distribution but accumulation. I told myself then: hold this level and wait for it to show its hand. Bottoming is the biggest test of patience, but as long as the structure remained intact, I chose to believe. 🤣

I opened a long position and then went to take care of other things. When I opened the chart ag
post-image
HYPE-2.21%
ETH+0.24%
BTC-0.55%
$XLM /USDT is range-bound, but the 1h setup hints at a short squeeze nobody is talking about.

$XLM /USDT - SHORT

Trade Plan:
Entry: 0.19221 – 0.19365
SL: 0.19983
TP1: 0.18775
TP2: 0.18430
TP3: 0.17913

Why this setup?
Why now? The daily trend is range, yet the 1h ATR of 0.002876 shows volatility is compressing, which often precedes a directional burst. The 15m RSI at 58.47 is neither overbought nor oversold, meaning the next impulse can run hard without a warning divergence. The entry zone at 0.19293 aligns perfectly with the 1h price, giving a clean trigger for a short bias. TP1 at 0.187
post-image
XLM+5.28%
Insiders are quietly stacking shorts on $XAU /USDT while the 1h price holds a suspiciously flat range.

$XAU /USDT - SHORT

Trade Plan:
Entry: 4411.58 – 4417.00
SL: 4440.26
TP1: 4394.81
TP2: 4381.82
TP3: 4362.35

Why this setup?


Debate:
Are we about to sweep 4456 and trap the shorts, or is this range about to explode downward?

⚠️ Personal market analysis only. NFA — manage risk and DYOR.
Educational content, not investment advice or a recommendation to buy, sell, deposit, or withdraw any asset. No paid promotion or referral/affiliate links.
XAU-0.29%
Gate New Listing: $STONKBROKER
🔹 Trading pair: $STONKBROKER / $USDT
🔹 Trading time: September 7, 19:00 (UTC+8)
🔹 0-fee swap start time: September 7, 20:00 (UTC+8)
Go to trading: https://gate.com/zh/trade/STONKBROKER_USDT
Go to swap: https://www.gate.com/zh/convert/USDT/STONKBROKER
Learn more: https://www.gate.com/zh/announcements/article/101592
post-image
No trades, no analysis, just sheer luck—this performance is embarrassing even to talk about. When I opened the chart early today, I stared at the line from $LIT 's 3.753 to 4.6 for several seconds: +1085.07%. I was about to curse the price action, but then I looked at my account and thought, forget it—the market is always right, Dad😂.

Actually, while everyone else was running, I noticed something: each pullback was shallower than the last, someone was always buying below, and the sell orders were hitting with less and less force. The bottom was clearly being supported. So I called for a long
post-image
LIT+4.94%
LAB-2.60%
DOGE+1.16%
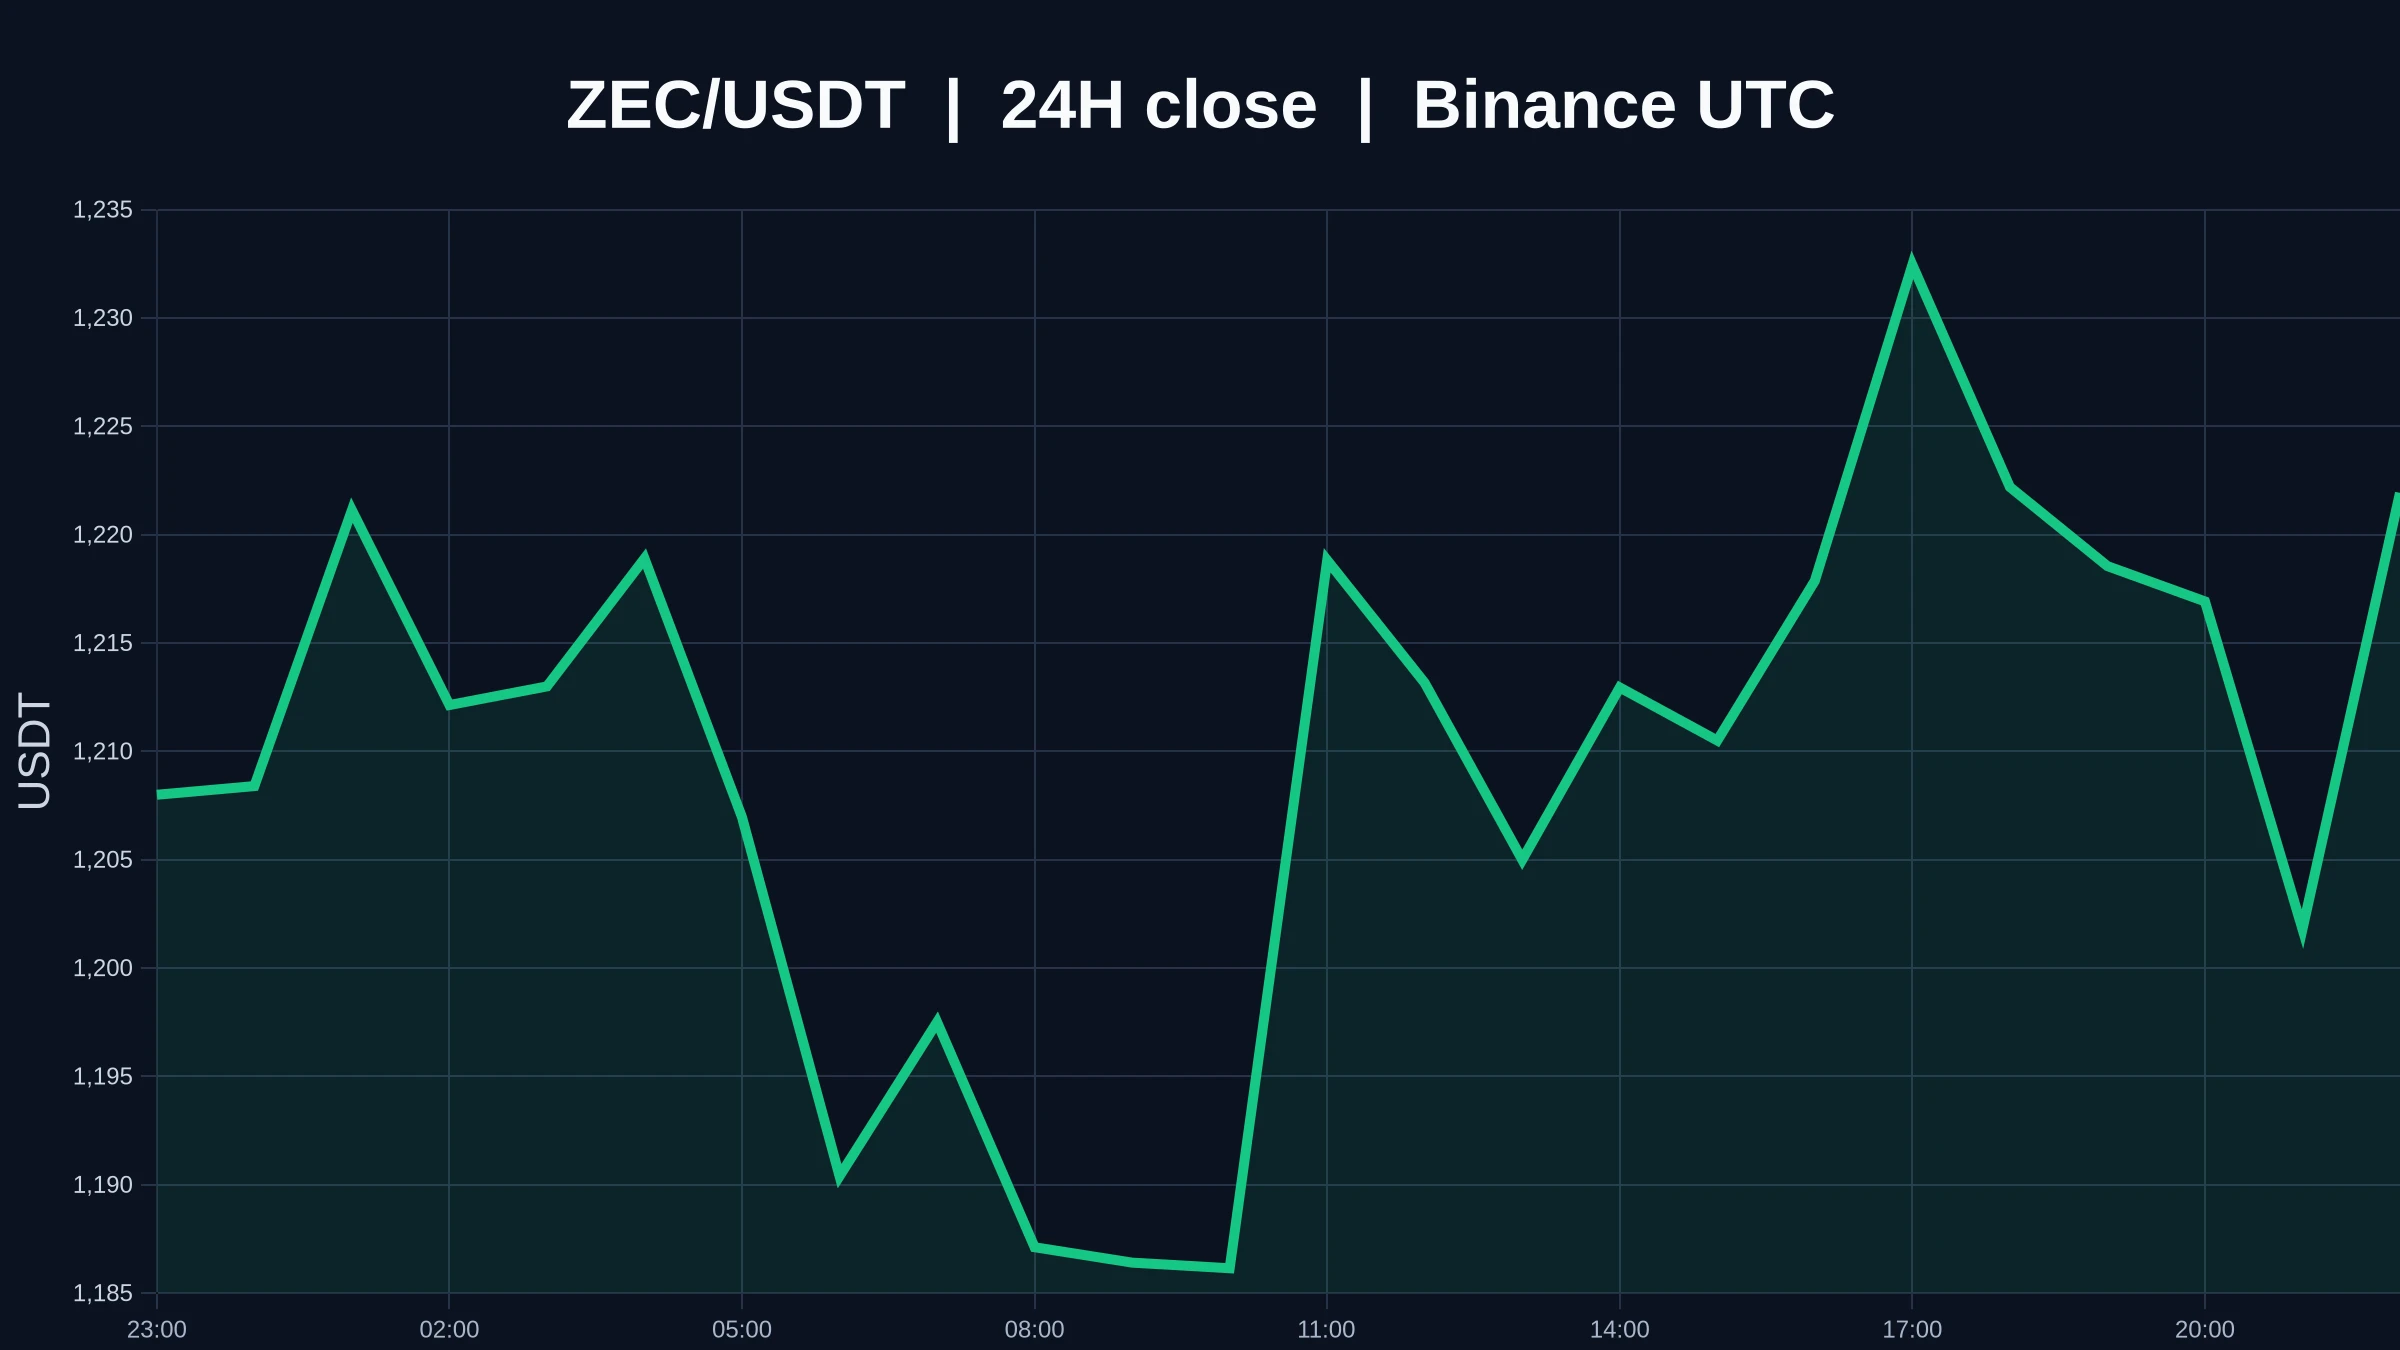
🚨 ZEC BREAKS $1,200 — NEW ALL-TIME HIGH! 🚀
Zcash ($ZEC ) is making headlines after breaking above the $1,200 level and entering fresh price-discovery territory. 📈🔥
💥 What’s happening?
• 🚀 ZEC breaks above $1,200
• 🏆 New all-time high
• 💰 Market cap climbs above $20B
• 🔝 ZEC enters the crypto top 10
• ⚡ Strong momentum fueled by ETF interest and short liquidations
The rally has been incredible, but after such a sharp move, volatility can be extremely high. Traders are now watching whether ZEC can hold above $1,200 and continue the breakout.
Is ZEC heading toward $1,500 next? 👀🔥
#ZEC #
post-image
ZEC-4.37%
9.8 ETH Analysis
ETH surged to 2536 on the one-hour chart before coming under pressure and retreating. The price is trading below the middle Bollinger Band, and bullish momentum has weakened somewhat. MACD has formed a death cross, the negative histogram has expanded slightly, and RSI remains in the neutral zone, indicating shifting momentum between bulls and bears. Short-term resistance is concentrated in the 2516–2536 range, with the lower Bollinger Band at 2473 as the first support and 2459 as the key defensive low. Funds are showing net outflows, while upward momentum has weakened. If supp
BTC-0.53%
$SOPH I lost 110k U last week because I chased the AI narrative without setting a stop-loss. I’ve recovered now because I’ve learned to let the data speak. SOPH is currently at 0.0052, up 25% in 24 hours, with a high of 0.0055 and a trading volume of 78 million U. This kind of volume can’t be generated by retail traders alone.
Key point: It has already risen 30% from 0.0041, but without massive volume, which indicates that the chips are still in the hands of the main players. My plan: don’t chase at the current price; buy on a pullback to 0.0048–0.0050, set a stop-loss at 0.0045, and target 0.
SOPH+28.70%
WLD+12.07%
Why is SYMBOL about to break lower when everyone expects a bounce?

$SLX /USDT - SHORT

Trade Plan:
Entry: 0.06923 – 0.06963
SL: 0.07139
TP1: 0.06796
TP2: 0.06698
TP3: 0.06551

Why this setup?
Why now? The daily trend is range-bound, which often precedes a sharp directional move once momentum decides. The 1h ATR sits at 0.000816, meaning the average candle range is tight enough for a clean breakdown to deliver a high-ratio entry. The 15m RSI reads 42.92, confirming sellers are in control but not yet exhausted. The entry zone is 0.06923 to 0.06963, targeting the 1h price of 0.06943 as a prec
SLX+0.40%
This $DOGE long position has been a bit grueling to hold. A dip in the middle wiped out quite a few short chasers, coming within just a few points of my protection level. I did not manually cut it at the time because the four-hour structure had not yet broken down.
I entered based on a double bottom on the hourly chart. After the right-side breakout, price pulled back to the previous high neckline and held firm, so I went long after confirmation. The entry was not particularly cheap, but the stop-loss was very close—using limited risk to capture trend continuation.
After price surged into the
post-image
DOGE+1.16%
SOL-1.07%
XRP-0.51%
I wasn't even expecting to break even, but it directly put me in profit. This service really came through🙏. Held $LINK from 11.416 all the way to 12.761, +834.7%. All that waiting was worth it—really worth it.

The last thing I saw before bed was the market still grinding sluggishly, and I was honestly a little nervous too. But bottom consolidation is the most honest signal: funds were quietly accumulating, not buying blindly. So I didn't hesitate much—I placed a long order as planned and waited for the market to give me an answer. It really did, and rather forcefully.

I closed 75% of the
post-image
LINK+3.66%
BNB-0.95%
ADA+1.05%
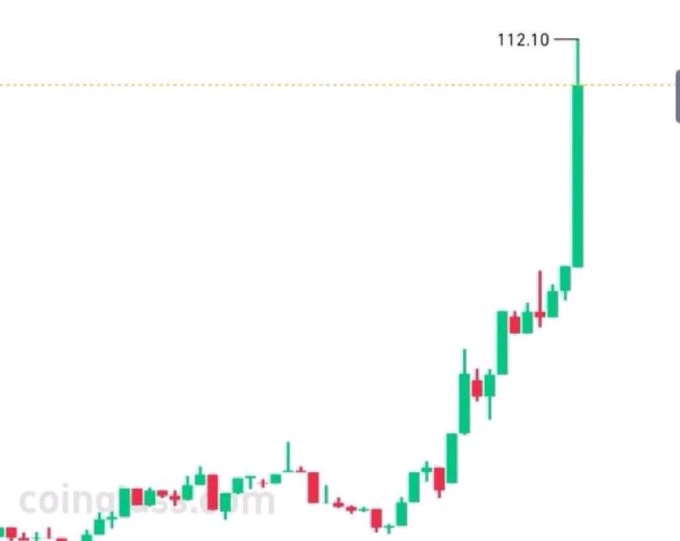
SKL pump pump big pump ath hype go
post-image
SKL+1.55%
PUMP+15.82%
HYPE-2.20%
Crypto Market and Trading Insights
live-cover
LIVE364
$CHILLGUY —don't touch it under any circumstances. I'm not here to urge you to buy the dip; I'm here to stop you. This coin has fallen more than 16% since launch, with the entire 11.6M trading volume piled up in retail capitulation selling. There is no sign of major players entering. Buying now is equivalent to handing out red envelopes to those holding high-priced tokens. It broke the previous high immediately after listing and is following the textbook route of a slow bleed.
But if you really can't resist, there's only one contrarian condition: wait for US-session sentiment to recover in two
CHILLGUY-14.81%
  • 1
Load More

Join 40 M users in our growing community

⚡️ Join 40 M users in the crypto craze discussion

💬 Engage with your favorite top creators

👍 See what interests you

View More