Square
Following
Hot
News
Profile
Share your thoughts
placeholder
Article
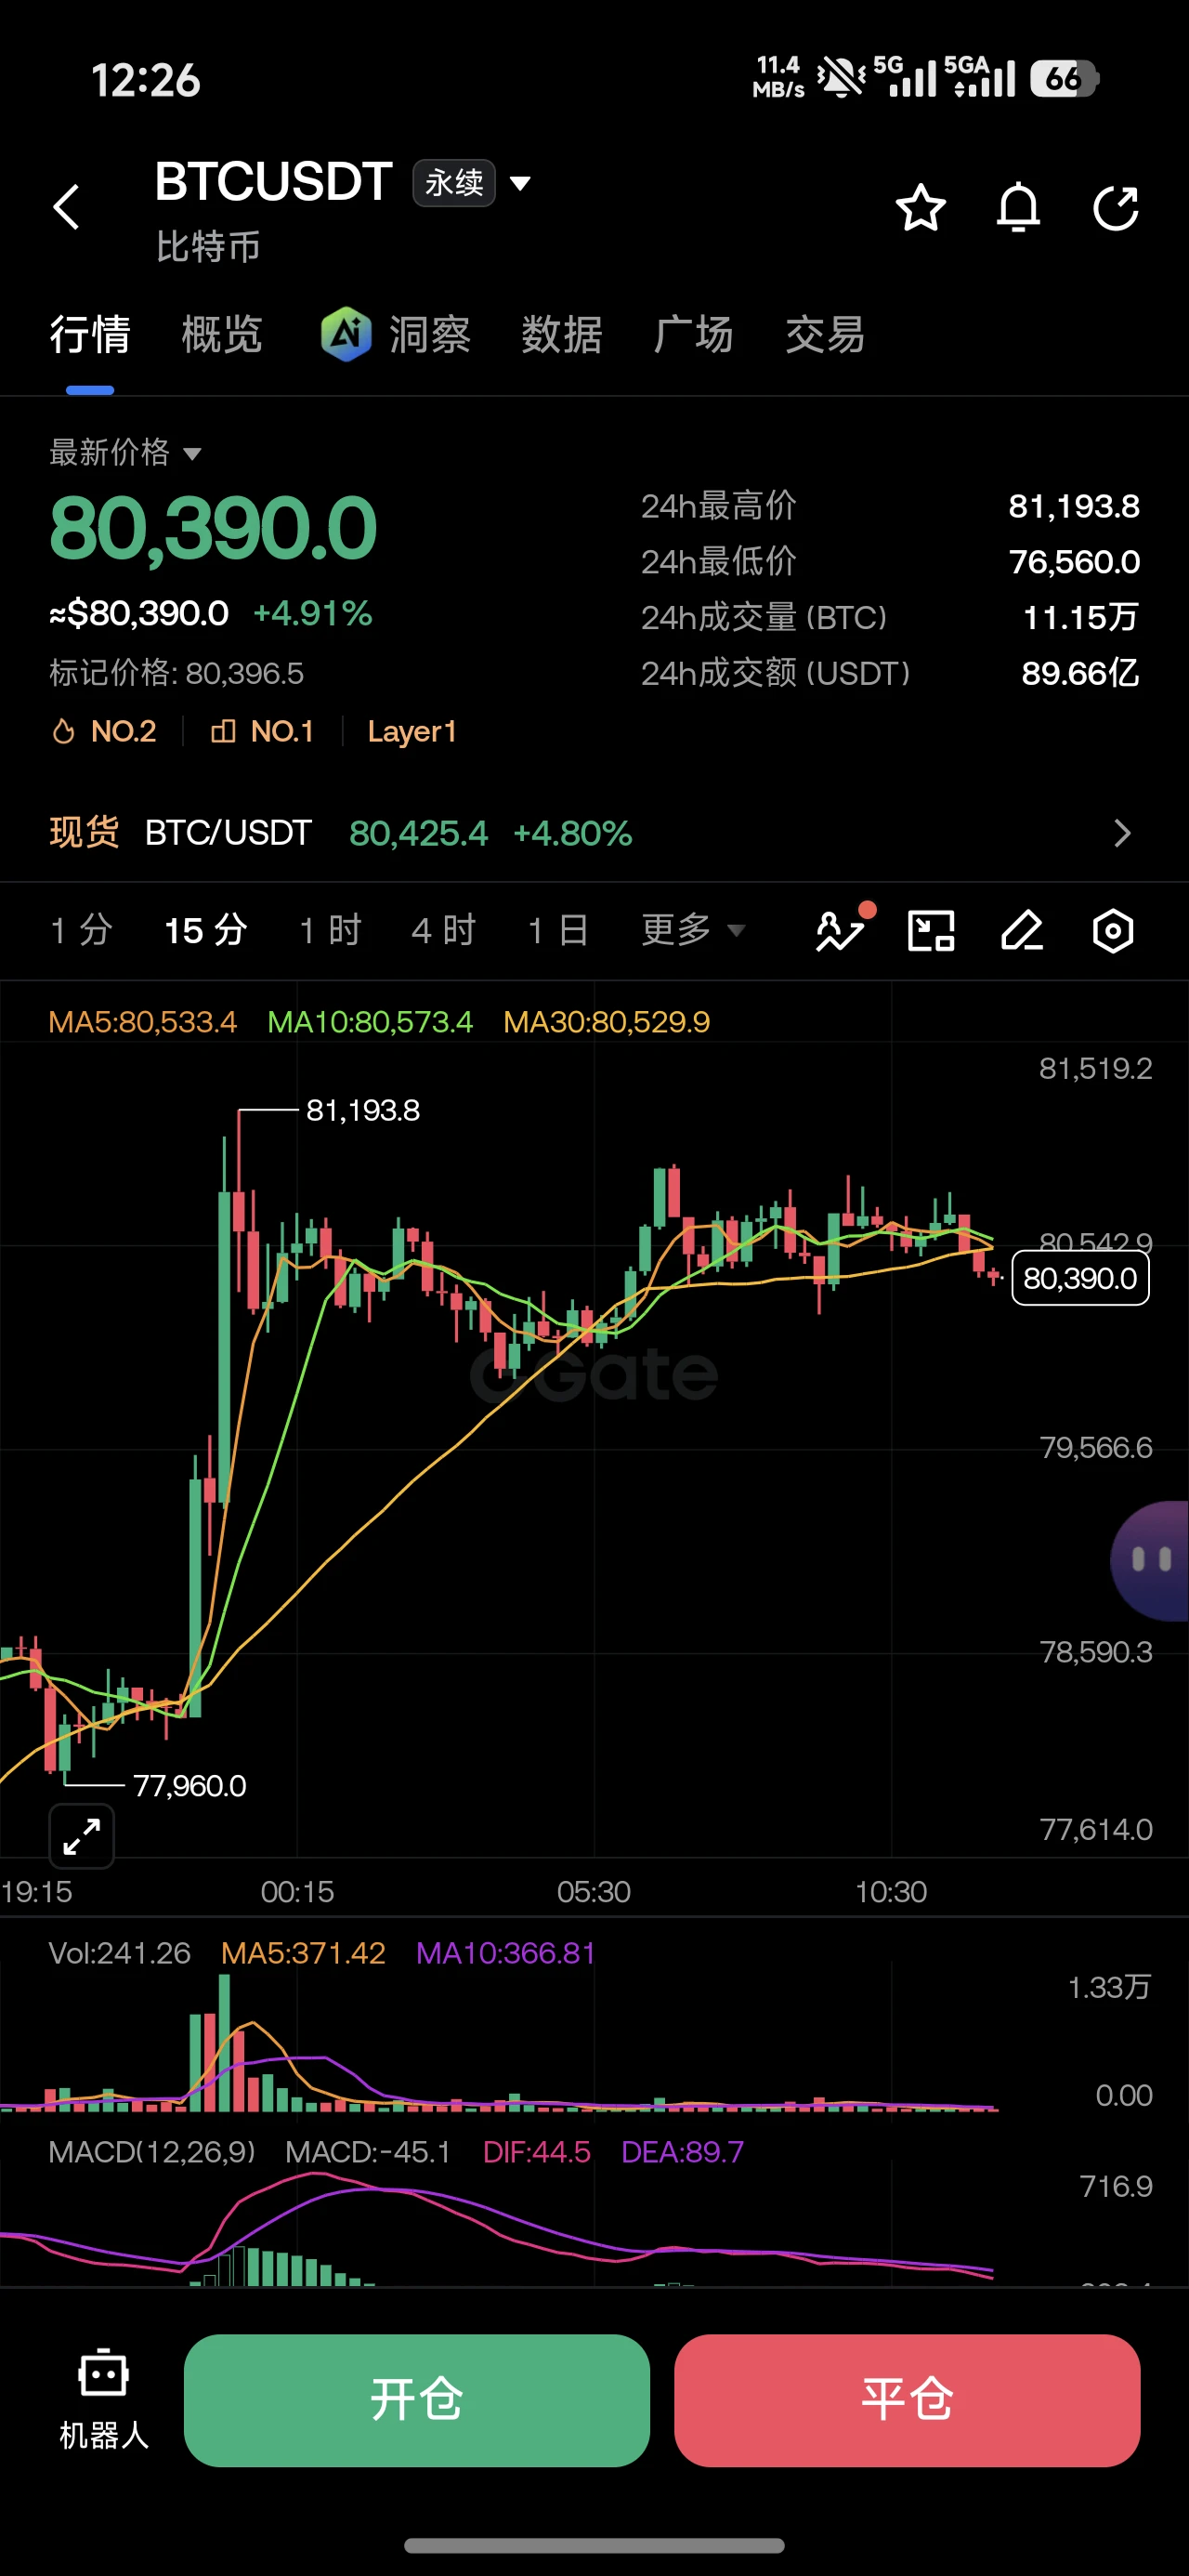
BTC rose 4.95% over the past 24 hours, climbing above $80k: 1-hour moving averages turned bullish, ADX stood at 39.7, and RSI at 69.6 was nearing overbought territory; the resolution of election uncertainty and institutional accumulation lifted sentiment, while ETF outflows and a bearish daily trend capped medium-term upside, leaving a clear divide between bulls and bears. #BTC重返8万
post-image
BTC-0.67%
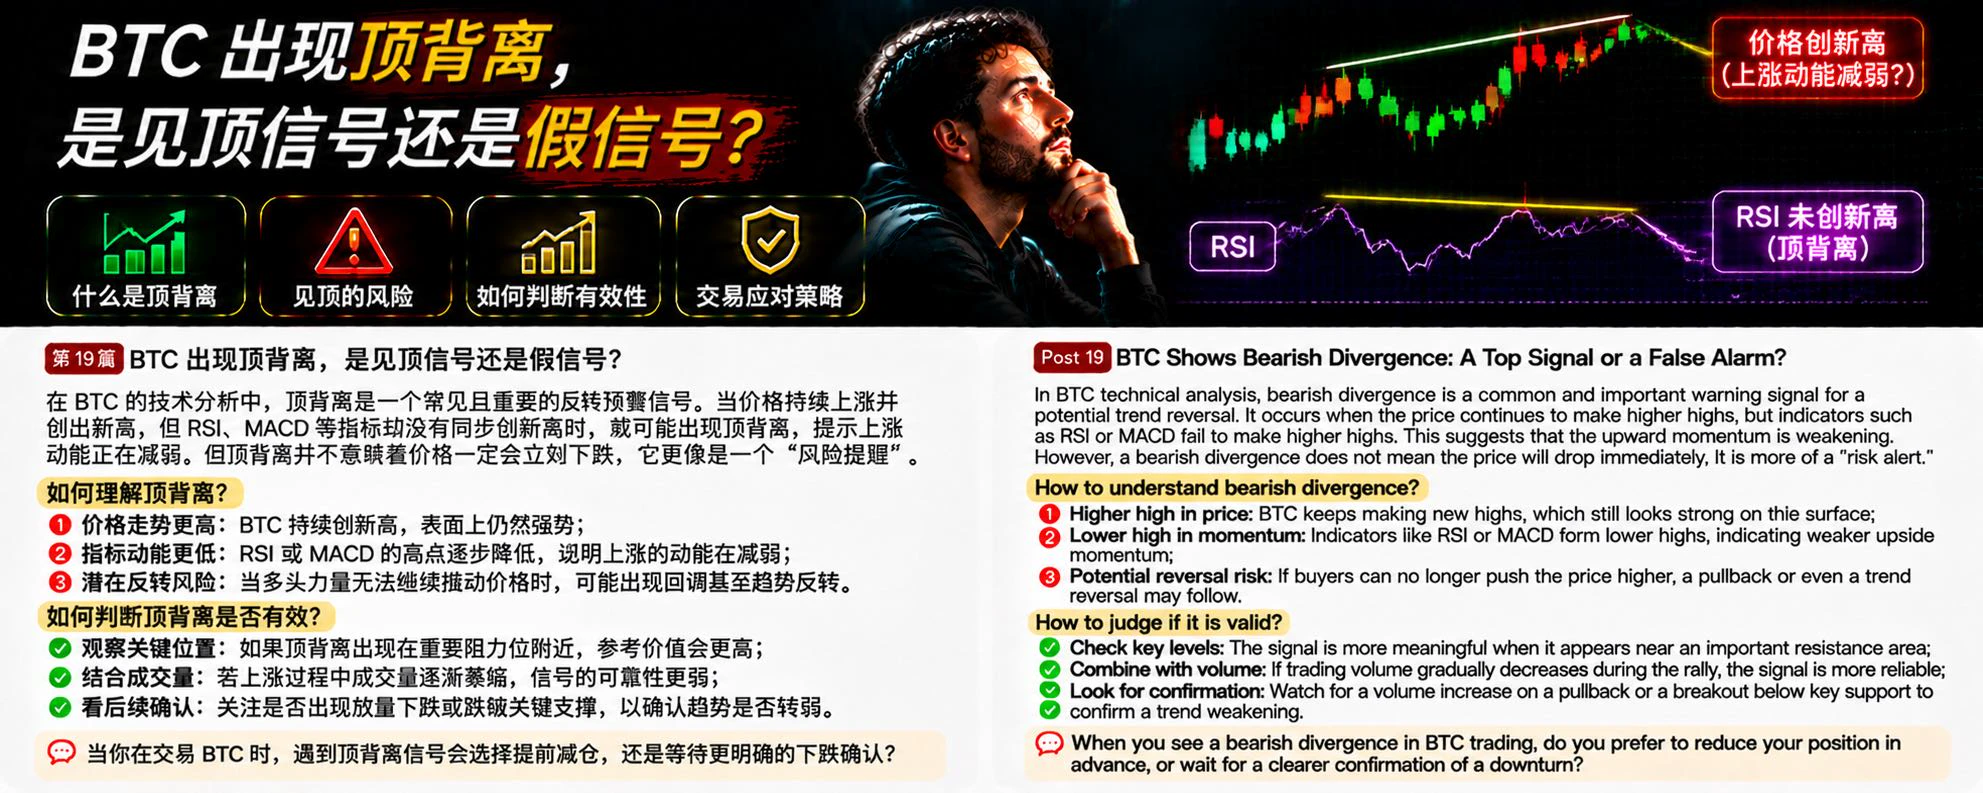
In BTC technical analysis, bearish divergence is a risk warning signal worth watching. Many traders see the price continually making new highs and assume the uptrend remains strong. But if the price keeps rising while indicators such as RSI or MACD fail to make new highs in tandem, bearish divergence may be forming.
What is bearish divergence?
Simply put, the price makes a higher high, while the technical indicator forms a lower high. This suggests that although the price is still rising, the momentum driving it higher may be weakening.
Why is bearish divergence worth watching?
First, upward m
post-image
BTC-0.67%
Trenches
ZIG
Z
bade
b
ZIG
0x8c...1145
Market Cap
$.
Change
.
24h Vol
$.
Holders
.
BTC
B
bade
b
BTC
C5xp...pump
Market Cap
$.
Change
.
24h Vol
$.
Holders
.
HIGH
H
bade
b
HIGH
7ymF...high
Market Cap
$.
Change
.
24h Vol
$.
Holders
.
STONK
S
bade
b
STONK
6GmA...UNgx
Market Cap
$.
Change
.
24h Vol
$.
Holders
.
LEEROY
L
bade
b
LEEROY
98HE...pump
Market Cap
$.
Change
.
24h Vol
$.
Holders
.
#USEarningsSeason
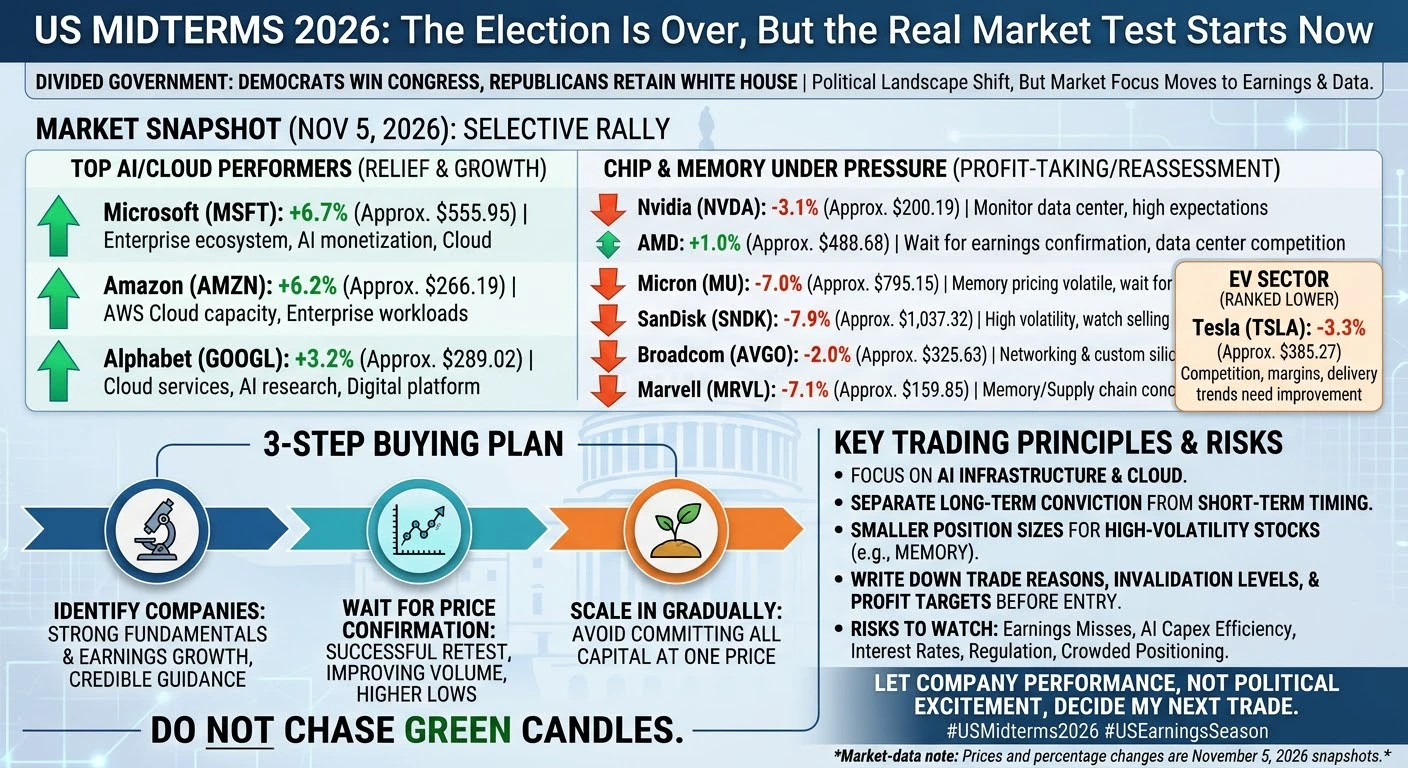
US Midterms 2026: The Election Is Over, But the Real Market Test Starts Now
The US midterm election results have changed the political landscape, but I do not believe one election can decide the market direction for the next several months. Democrats have secured control of both chambers of Congress, while Republicans retain the White House. This creates a divided government. In my view, the next phase will be driven less by political headlines and more by earnings, economic data, interest rates, regulation, capital spending and the ability of companies to turn demand into r
post-image
  • 4
It really is true😅
Huawei is still far ahead
post-image
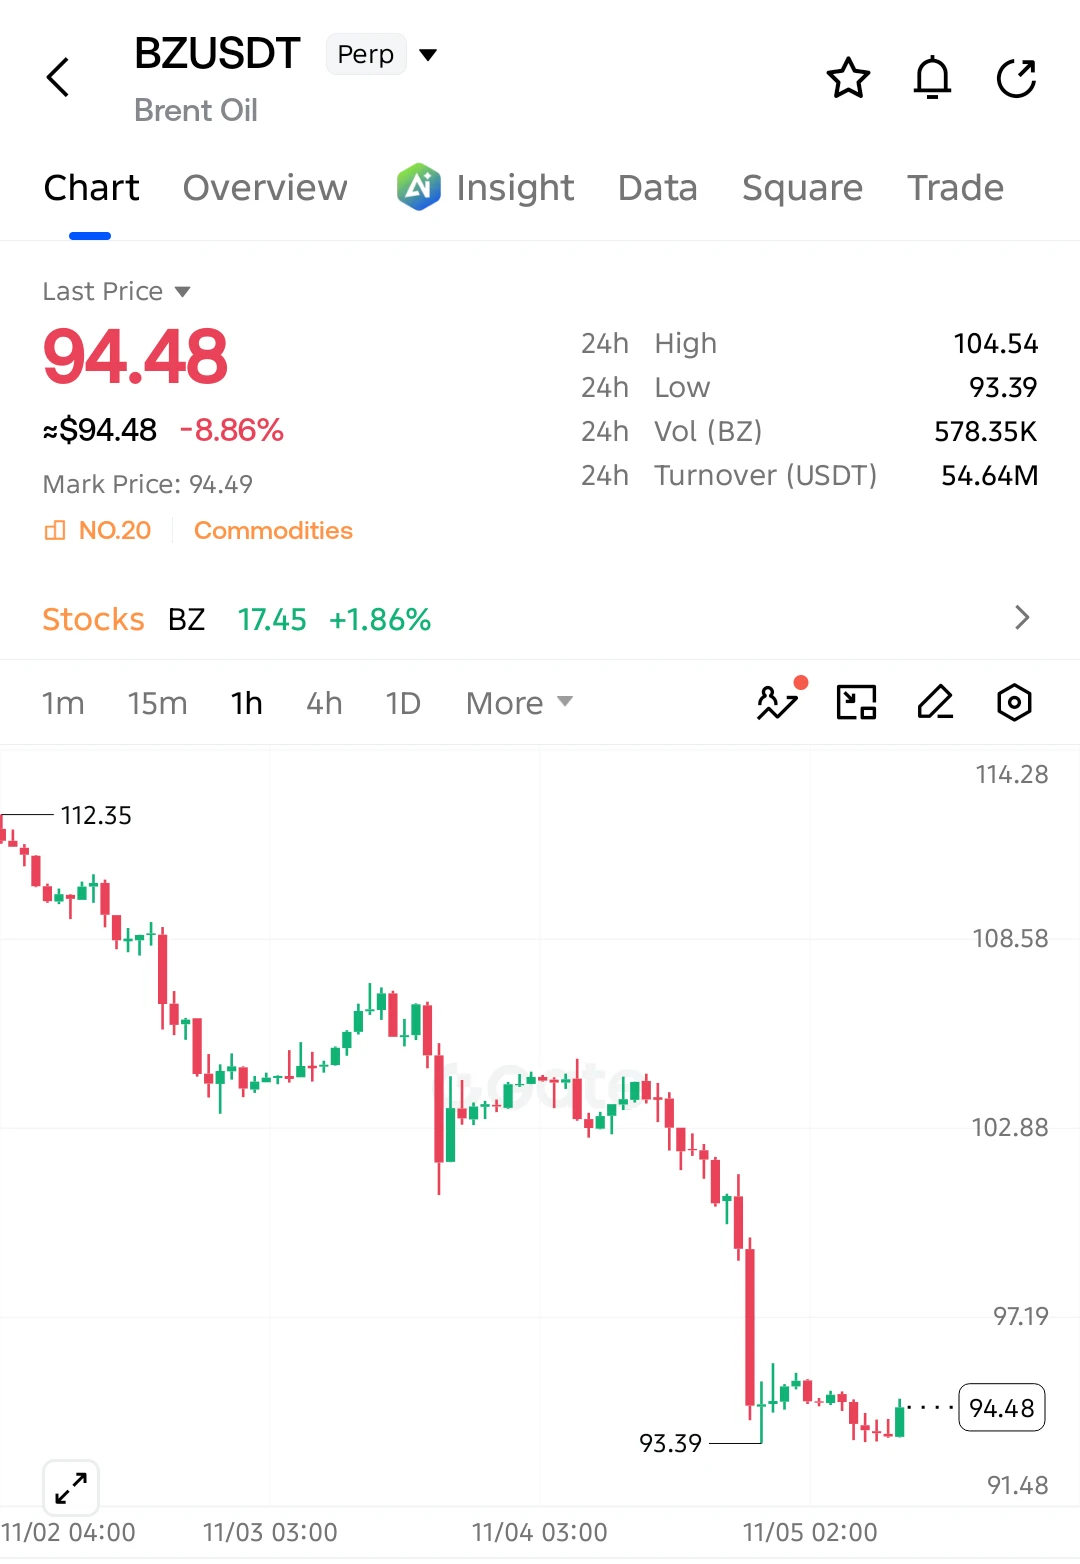
$BZ BEARS ARE CRUSHING THE MARKET!
Brent Oil has plunged 8.86%, and sellers remain firmly in control. Price is struggling near 93.39 support after a massive breakdown.
SHORT SETUP
Entry: 94.48
SL: 96.20
TP1: 93.39
TP2: 92.00
TP3: 90.50
Final Target: 88.00
The chart shows a clear bearish structure with consecutive lower highs and strong selling pressure. A breakdown below 93.39 could accelerate the decline toward 90.50 and potentially 88.00.
Invalidation: A sustained recovery above 96.20 weakens the bearish setup.
post-image
BZ-1.18%
  • 2
  • 1
November 4: Yesterday was a turning-point day, and Bitcoin’s bullish Bat pattern finally played out.
Trump got crushed in the midterms, making it impossible for him to implement his policies going forward. He also acknowledged the impact the Iran war has had on him, which suggests it will be difficult to keep going. Oil prices plunged, the U.S. Dollar Index pulled back, U.S. Treasuries declined, and liquidity was released.
From this perspective, Bitcoin, stocks, and gold all posted substantial gains.
But can this rally keep going? We have to ask that question. The current market isn’t being dr
BTC-0.67%
Thrusday Trades with Crypto Sat
live-cover
LIVE1,438
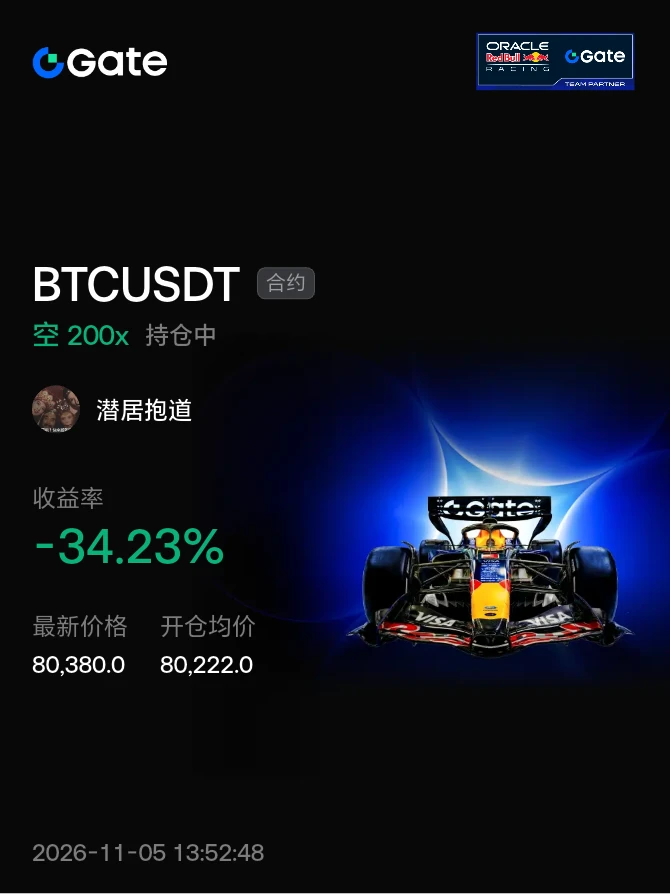
#晒出我的持仓收益 How much can this order take? Let’s wait and see
post-image
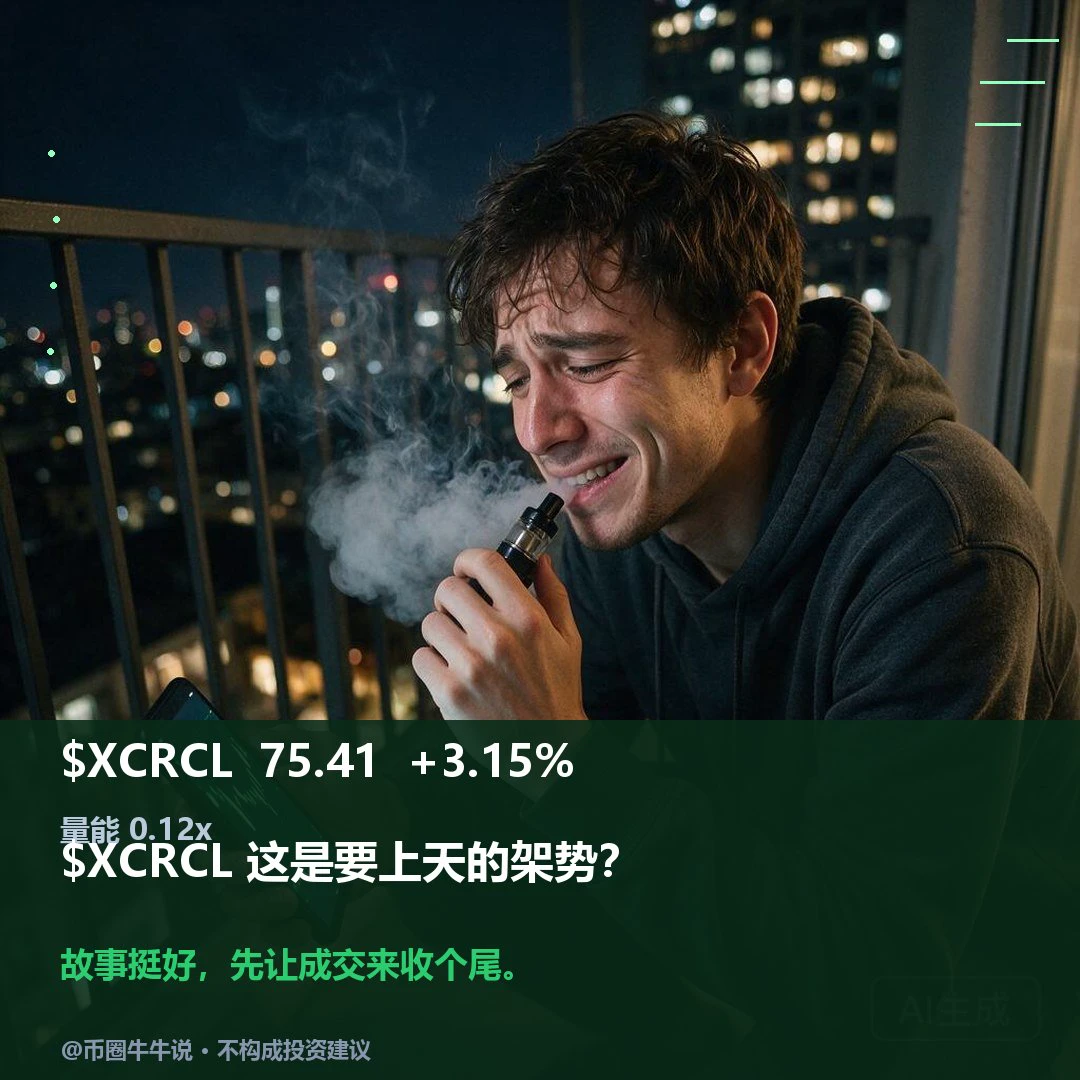
$XCRCL Currently at 75.41, up 3.15% over 24H (72.79–78.20). 1H is weak: RSI 65.55, and the current price is below the 1H EMA20 at 75.75. 4H is strong: RSI 58.72, and the current price is above the 4H EMA20 at 74.95. The 1H volume ratio is only 0.12, indicating insufficient participation. If price holds above the 78.20 resistance level, watch for continuation; if it breaks below the 72.79 support level, the short-term outlook may weaken. In the follow-up review, check whether price can hold above 78.20 and recover after losing 72.79. With the volume ratio at 0.12x, a break above or below these
post-image
$GT ‌• Market data: GT's current price fluctuates around $9.60–$10.00 USD. The token's market capitalization exceeds $1 billion, placing it around 60th in the global cryptocurrency rankings.
• Utility: GT holders receive significant discounts on trading fees, elevated VIP levels, and access to free airdrops on the Gate.io Startup platform.
• Deflationary model: The exchange conducts regular quarterly token burns. For example, in the third quarter of 2026, nearly 2 million GT (about $22.3 million) was permanently removed from circulation, systematically reducing the total supply and supporting
GT-2.41%
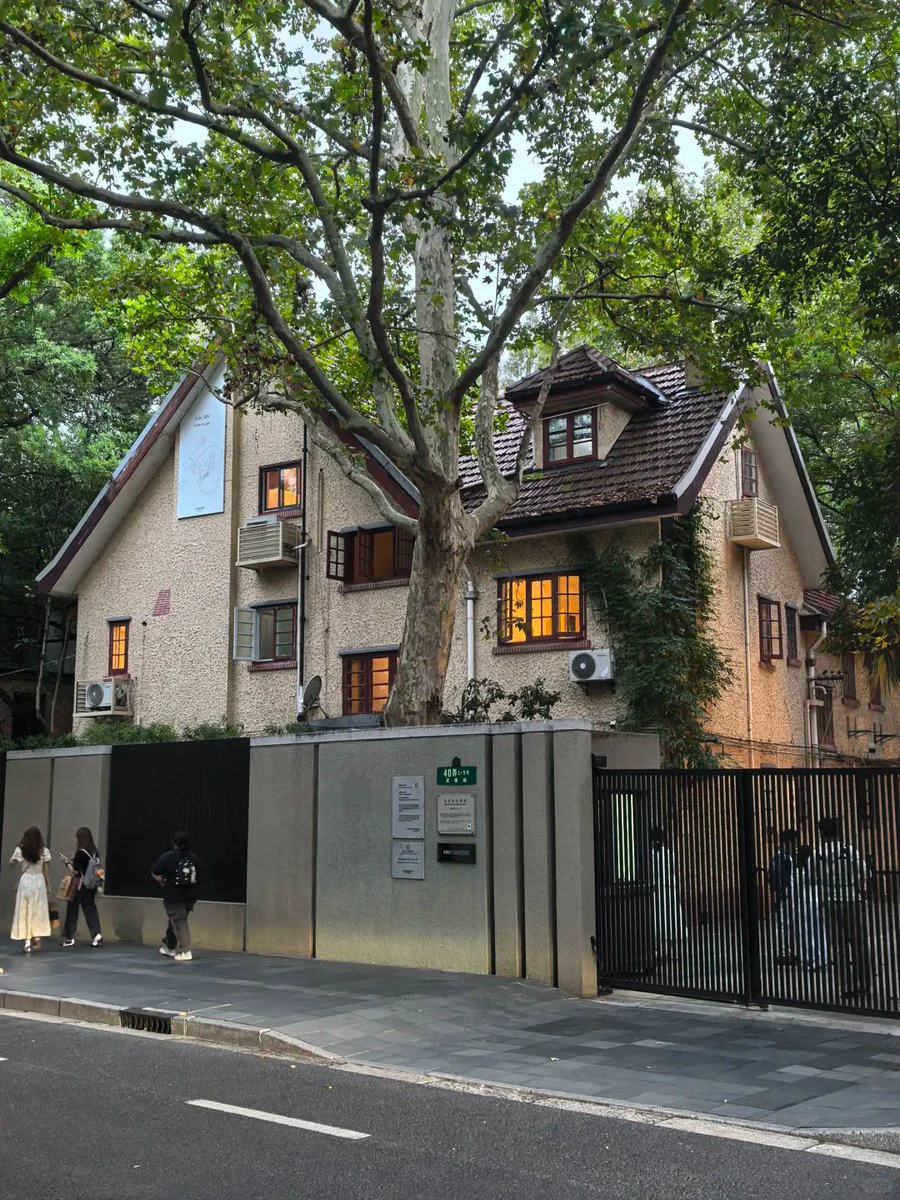
If you don't know, ask:
Who lives in these beautiful homes in Shanghai?
How much do they cost?
post-image
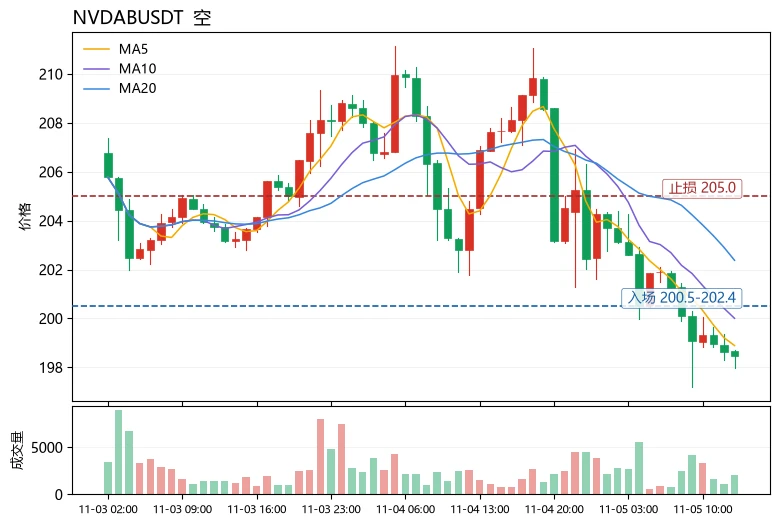
The most unusual thing in today's market is that overall sentiment remains neutral (Fear and Greed Index at 50), but
$NVDAB has already fallen to the edge of oversold territory—this isn't a broad-based decline; capital is picking favorites within the sector. BTC is flat and sentiment isn't panicked, yet it can't even hold above MA5 (198.89), with MA20 (202.377) overhead as resistance, indicating that selling pressure is coming from the asset itself rather than being dragged down by the broader market. RSI is just 33.3, near oversold but not at the bottom; the MACD histogram at -0.3728 still s
post-image
NVDAB
NVDABNVDAB
Pump.Fun
MC:$3.5KHolders:1
4.36%
LINK-0.18%
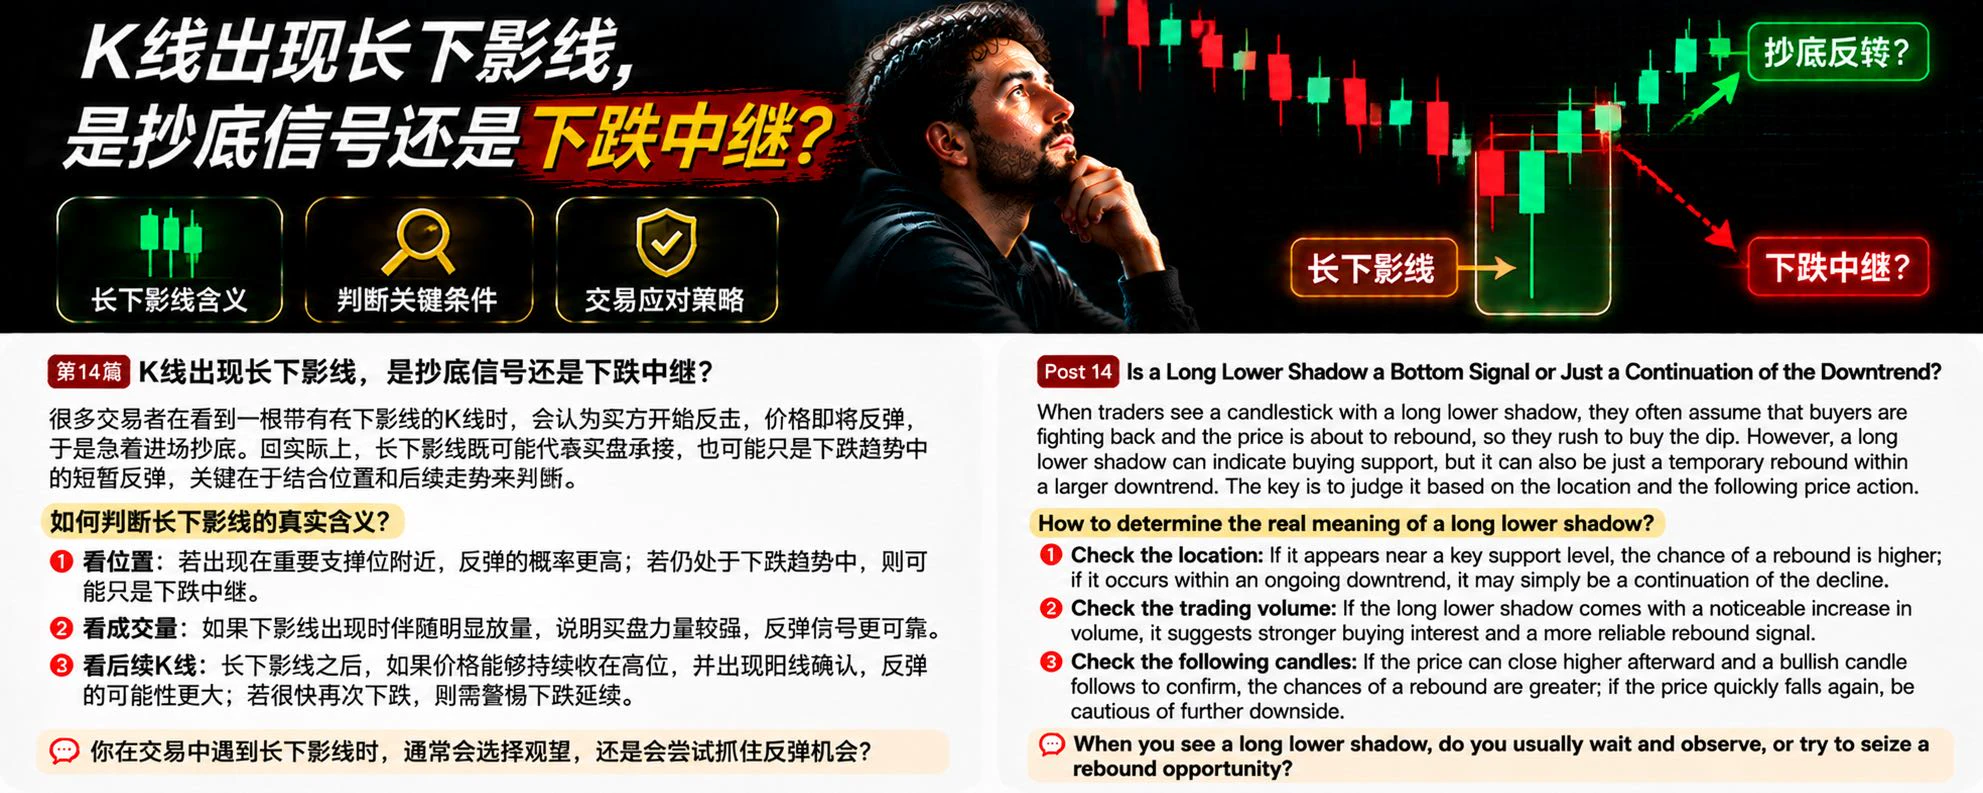
In BTC trading, many people see a candlestick with a long lower shadow and assume buyers are starting to fight back and the price is about to rebound, so they rush in to buy the dip. But in reality, a long lower shadow does not necessarily mean a trend reversal; it may simply be a brief rebound during a decline.
So how should you judge?
First, look at where it appears. If a long lower shadow appears near an important support level from earlier, it suggests that strong buying may have absorbed selling after the price fell into this area, making the rebound signal relatively more significant. Bu
post-image
BTC-0.67%
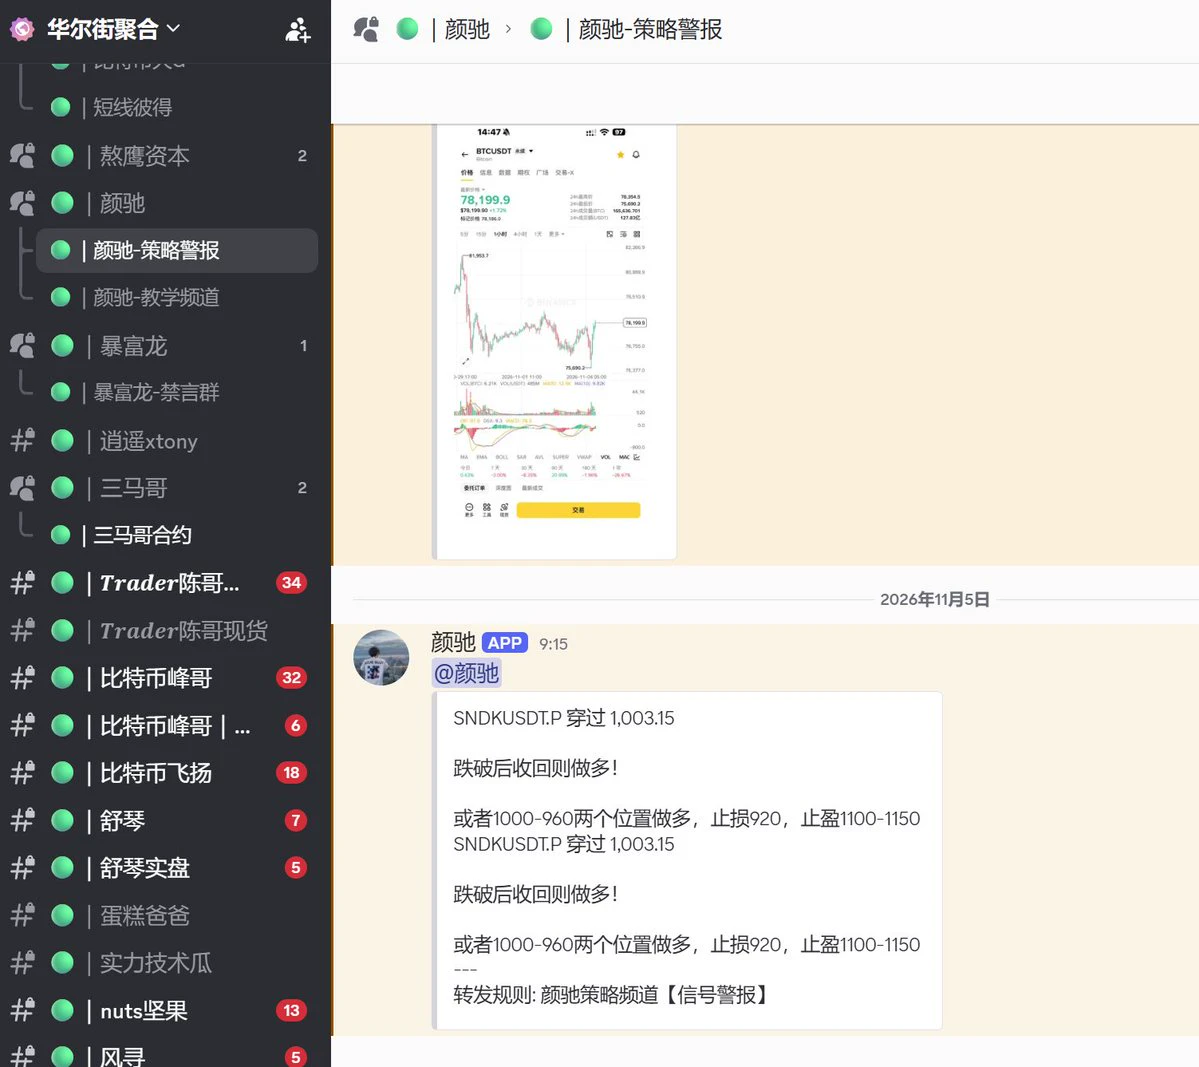
Yan Chi: Go long if SanDisk breaks below 1003.15 and then reclaims it, or go long at 1000–960. Stop-loss: 920; take-profit: 1100–1150.
#US stocks
post-image
SNDK-7.93%
#10月非农数据聚焦 ADP beats expectations: How will October’s nonfarm payrolls affect the Fed’s rate-hike outlook?
ADP private-sector employment data released Wednesday beat expectations, with hiring broadening across more industries, signaling some improvement in the weak U.S. labor market. Attention now turns to Friday’s nonfarm payrolls report; if it shows a resilient labor market, it could put pressure on the monetary policy outlook.
Solid data: ADP said U.S. businesses added a modest 86,000 jobs in October for a second consecutive month, exceeding Wall Street’s forecast of 75,000.
By industry, tr
ADP+2.57%
  • 8
Where exactly should you set your stop-loss?
A stop-loss isn’t better just because it’s closer, nor safer just because it’s farther away.
🔹 Look at market structure: Find the point where your trading thesis is truly invalidated.
🔹 Look at volatility: Factor in current market conditions to avoid mistaking normal fluctuations for a trend reversal.
🔹 Look at position size: The wider your stop-loss distance, the more you usually need to reduce your position size to control planned risk.
🔹 Look at overall risk: Consider slippage, leverage, fees, and other positions.
Core principle: Clarify your
post-image
🚨 @tether's physical gold reserves backing XAU₮ have surged 59% since early 2026.
Reserves reach a record $3.44B.
Growing demand for tokenized physical gold.
Gold is going increasingly onchain!
XAUUSD+1.32%
A stream does not strive to be first; it strives to flow on without end. Plants and trees do not strive to grow tallest; they strive to thrive from generation to generation. Be a long-term thinker, and time will provide the answer!
post-image
When exiting the previous trade, I reminded you: once in, take a quick short to catch the pullback.
Entered a short at 4137 and took profit at 4125, for 12 points—$2452 banked!
Next, don't rush to go long. Small timeframes often drive larger timeframes into a trend. The 15-minute pullback has played out, which may also mean the hourly chart is turning down from a high. Wait for the hourly candle to close to confirm whether the pullback will continue, or see whether selling volume continues to increase on the 15-minute chart before it loses momentum. Then decide whether to chase the short or ke
post-image
XAUUSD+1.32%
THURSDAY CRYPTO MARKET LIVE TRADING AND SCALPING
live-cover
LIVE1,562
Load More

Join 40 M users in our growing community

⚡️ Join 40 M users in the crypto craze discussion

💬 Engage with your favorite top creators

👍 See what interests you

Trending Topics

BTCBackAbove80K

28.32k Views41.2k Discussing

After a sharp dip, Bitcoin climbed back above $80,000 on May 9 and is currently trading around $80,200. Over 50,000 traders were liquidated in the past 24 hours amid fierce long-short battles. The recurring Iran-U.S. tensions remain the primary short-term variable. Following U.S. airstrikes, Iran\'s Revolutionary Guard claimed to have breached the Strait of Hormuz defense line, leaving the ceasefire outlook uncertain. On the technical side, the daily SMA20 ,$77,970 serves as key support, with the RSI recovering from oversold levels to 43. The $80,000 level is both a psychological barrier and a bull-bear dividing line.Holding above it could lead to a challenge at $85,000, while a break may trigger a retest of the $77,000 area.

DemocratsWinBothChambers

17.63k Views444 Discussing

GateLaunchesTaiwanStockTrading

14.77k Views310 Discussing

View More