


Share your thoughts
placeholder
Article
$120,000 in tuition fees, getting liquidated on leverage during last year’s SOL rally, plus chasing trash coins due to FTX’s lingering fallout, left me completely wiped out at the bottom of the bear market. I’ve only just recovered to $70,000 on this move today. I can’t claim to have turned things around, but the lesson is etched in my bones: FOMO without data to back it up is just giving money away.
Looking at $USELESS ’s current chart, my hands are shaking a little. The current price is 0.2506, up 35% in 24h, after surging as high as 0.2879 before crashing back down, with a low of 0.1833 and
SOL-3.08%
USELESS+30.90%
BTC-1.96%
🚨 JUST IN: Strategy says it holds $52 BILLION in net Bitcoin reserves after accounting for debt and preferred claims.
bitcoin:native $MSTR
BTC-1.96%
MSTR-1.49%
This trend is so obvious I don’t even need to think—the account is dancing on its own. While everyone was still watching from the sidelines, I already felt something was off. It had clearly moved sideways at the highs for so long, selling pressure kept building, yet trading volume kept shrinking. That wasn’t a good sign.

I saw it even more clearly as it formed a base intraday: insufficient support, with no one willing to buy on the way up. This kind of price-volume divergence couldn’t last long. So around 0.03576, I directly shared a short-selling idea, focusing on going with the trend.

No
post-image
SNDK+11.77%
ADA-4.65%
A few days ago, I was still calculating whether I had enough money for instant noodles this month; this morning, I was already wondering whether to add sausage. This wave from $BTC has really come through, with the opening price moving from 77967.8 to 79734.3 and delivering +393.09% gains—truly a lifeline.

Thinking back, when I took that last look before bed a few days ago, the market was still consolidating on declining volume. I judged that the bottom structure had already fully formed, and all it needed was a bullish candle to confirm the direction. As soon as the market opened today, it
post-image
BTC-1.96%
SOL-3.08%
ZEC+7.90%
$ETH Signal】Short-term short, 4H long bearish candle + selling pressure dominant
$ETH The 4H long bearish candle fell 2.18% through EMA20, with aggressive selling dominant and a buy ratio of 0.47. The 1H MACD histogram’s negative value expanded, with the rebound stalling around 2460. Order book depth was -1.15%, with clear suppression from sell-side orders.
🎯Direction: Short short
⚡Entry/limit order: 2445.5513 - 2452.9100
🛑Stop-loss: 2477.4391
🚀Target 1: 2416.1163
🚀Target 2: 2397.7195
🛡️Trade management:
- Execution strategy: Reduce the position by 50% after reaching Target 1 and move th
post-image
ETH-1.99%
Claude just produced the first computer-checked proof of Fermat's Last Theorem, working largely on its own for 11 days.
It wrote 13 million lines of Lean and proved 29,500 intermediate theorems. Full proof is on GitHub.
Would you trust an AI-checked proof more than a year of human referees?
CRYPTO THINGS YOU MAY HAVE MISSED — LAST 24 HOURS | 4 SEPTEMBER 2026
Institutions bought nearly $1B through crypto ETFs—yet bitcoin:native fell after one macro release.
That divergence matters.
🧵👇
1/3 — US JOBS CRUSHED EXPECTATIONS
August payrolls rose 162,000 versus 56,000 expected. Unemployment held at 4.1%.
Markets lifted the probability of a September Fed hike to roughly 62%.
Higher-rate expectations strengthened the dollar, pushed yields higher and sent bitcoin:native down 2.3% to around $79,595.
Translation: liquidity remains more powerful than crypto-specific narratives. BLS | Reuters
post-image
BTC-2.35%
ETH-2.49%
HBAR-1.70%
XLM-3.27%
XDC-1.67%
#RedBullTradingTourSeason6
🏁 Red Bull Trading Tour Season 6: The Trading Race Is On!
The Red Bull Trading Tour Season 6 is bringing Formula 1-style competition to the crypto market, combining fast-paced trading with leaderboard-based competition. The campaign is being promoted through the partnership between Gate and Oracle Red Bull Racing, creating a racing-inspired experience for crypto traders.
The latest Season 6 messaging emphasizes that traders need more than speed—they need discipline, timing and risk management. Like an F1 driver studying every corner before accelerating, traders are
ORCL+3.07%
GT-2.55%
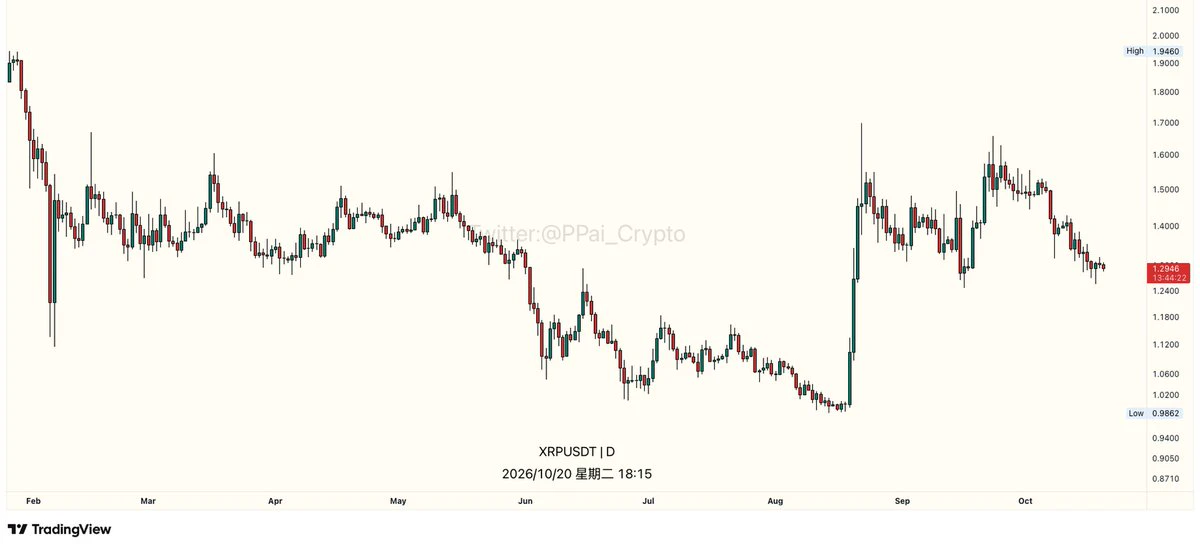
Altcoins chart against Bitcoin 👇
'
The all-time high + major trendline has been broken, and it was retested with more than 13 candles.
We can say a 100%—600% season is coming, God willing 🟩🔥
post-image
The $DASH 10x long position is making a push.
DASH+25.55%
This yield is making me nervous, and I’m worried the market will come to its senses tomorrow and blacklist me. 😂 When I checked the charts after lunch, $NIL made another push, but it clearly lacked follow-through, with shrinking volume and insufficient support. Every surge looked like a test. Seeing this setup, I knew it was a classic bull trap: the key resistance above was substantial, and there would be no one to take it higher. I told my friends right then, don’t chase it—wait until it runs out of steam; that’s our opportunity. Sure enough, it started falling in the afternoon and kept grin
post-image
NIL-1.42%
XRP-3.95%
LAB-0.23%
$PI Pi (π) is an irrational number, which means its decimal digits never end and never repeat in a specific pattern.
Mathematicians have calculated it to more than 100 trillion digits using supercomputers, but we are still far from "solving it," because it has no end.
For context, NASA uses only 15 digits of Pi for its most precise interplanetary calculations. Everything beyond that is purely mathematical curiosity, not a practical necessity.
Pi's infinite, patternless nature makes it a favorite symbol for concepts that resist simple boundaries, which is fitting given how often the crypto com
post-image
PI-1.95%
Just jumped in on this $HYPE long on the double bottom and bullish retest of the breakout.
Just running around town getting tings ready for the next job.
NFA, DYOR ⚠️
#HYPE #Crypto #Trading
post-image
HYPE-1.64%
A deeper correction sub 58k would be a movie 🍿📺
$BTC
post-image
BTC-1.96%
market update
live-cover
LIVE320
Everyone’s staring at $BTC /USDT’s range—but the 4h clock just started ticking for a short.

$BTC /USDT - SHORT

Trade Plan:
Entry: 79556.5 – 79834.1
SL: 81028.2
TP1: 78695.6
TP2: 78029.1
TP3: 77029.4

Why this setup?
Why now?
- Price is pinned at 79,695, but the 1D trend is *range*, not bullish—so upside is capped.
- RSI (15m) at 49.13 shows zero momentum; we’re in the no-man’s land before a breakdown.
- ATR (1h) of 555 means volatility is compressed—squeezes resolve fast.
- TP1 at 78,695 is only 1.2% away, but TP3 at 77,029 offers 3.4% if the range floor cracks.
- Confidence 55.
BTC-1.96%
I just casually tapped refresh, and it started dropping on its own, putting me in a very passive position😅. That’s because I had already placed a short position when the early-session sell-off began. At the time, every rebound in $BLESS was weak, volume failed to follow, and the resistance above was obvious. The trading volume was pitifully low, and I knew this kind of rebound without volume couldn’t last long.

My entry price was 0.011363. I originally wanted to wait for a lower entry, but it came down on its own. The current price has already reached 0.008609, bringing the return to +476.6
post-image
BLESS-0.93%
SNDK+11.77%
ZEC+7.90%
This is a support level for $CATE on a high timeframe. I don't think the price will spend much time here, as it showed strength during this pullback
post-image
CATE-11.22%
Our group chat is truly incredible! I learn a lot too. In fact, I don’t even need other platforms to track news flow or catalysts. The feed is exceptionally high quality 🦇
post-image
Load More

Join 40 M users in our growing community

⚡️ Join 40 M users in the crypto craze discussion

💬 Engage with your favorite top creators

👍 See what interests you

View More