Share your thoughts
placeholder
Article
2 years ago, Google was processing 9.7T AI tokens a month.
Today it is above 3.2 quadrillion. That’s a 330x increase.
There is no reliable global count so Google’s number can be best treated as a disclosed floor.
Even if growth slows to 2x a year, Google alone would reach 51 quadrillion tokens a month by 2030.
And that workload will look very different from someone opening a chatbot today. Long-running agents will hold context, divide jobs into subtasks, call other models, retry failures and verify each other’s work. One instruction could keep dozens of models active for hours.
Imagine a compa
post-image
GOOGL-1.12%
A pin-bar pullback was triggered in the morning. After that lower wick appeared, I noticed an opportunity to go long. The price then gradually stabilized, which served as a validation of my judgment. After entry, there was no particularly rapid trend; the price mainly moved upward in steps. This rhythm is actually more reliable than a sharp rally, because each upward move has key levels where positions change hands.

My buy order was completed within the long-entry range. Afterward, I observed that the positions in the market had not loosened significantly, so I was able to hold the trade wit
post-image
SOL-2.55%
ZEC-7.75%
A hand that set a stop-loss a few days ago trembled slightly; this morning I realized that was unnecessary filial piety😂. A few days ago before bed, $HYPE was still at that level. I checked it repeatedly, and the key level held while the critical position kept moving higher. This pattern is the most likely to produce a decent move. While everyone else was running, I instead felt that the opportunity had arrived.
Got in at 83.949; when I opened the chart this morning, it was at 85.274, +111.81%. Nailed it, brothers. Getting the rhythm right matters more than anything—the big bite of profit fee
post-image
HYPE-3.04%
LAB-2.57%
SNDK-0.01%
This isn’t a rebound; it’s a feeding tube stuck into an account that was about to flatline. 🔥

When $2Z plunged intraday, it was battered several times around 0.04895 without breaking support, but the downside pressure weakened each time. I recognized it as a washout, not distribution, so I stopped talking and went long directly.

The price has now recovered to 0.05027, with returns at +110.26%—that was a satisfying bite😋. Position management: take 80% off the table first, move the remaining 20% to the entry price for protection, and let the rest of the position make a push.

Those who k
post-image
2Z-3.11%
DOGE-0.13%
ADA-1.35%
Gate brings “Gold-Digging Dog” into the mainstream—Is Meme trading entering the social era?
This time, what I think is worth noting about Gate launching Gold-Digging Dog goes beyond 0 Gas.
Its official positioning is clear: Gold-Digging Dog focuses on a social trading ecosystem for Memes, and will support features such as Callout rankings, KOL rankings, and active account displays.
This means it is not merely a simple on-chain trading gateway, but is trying to bring “discovering trends” and “trading trends” into the same setting.
Previously, when we discovered a Meme coin, we might see someone
MEME-0.56%
  • 16
Everyone watching SYMBOL long is about to get blindsided.

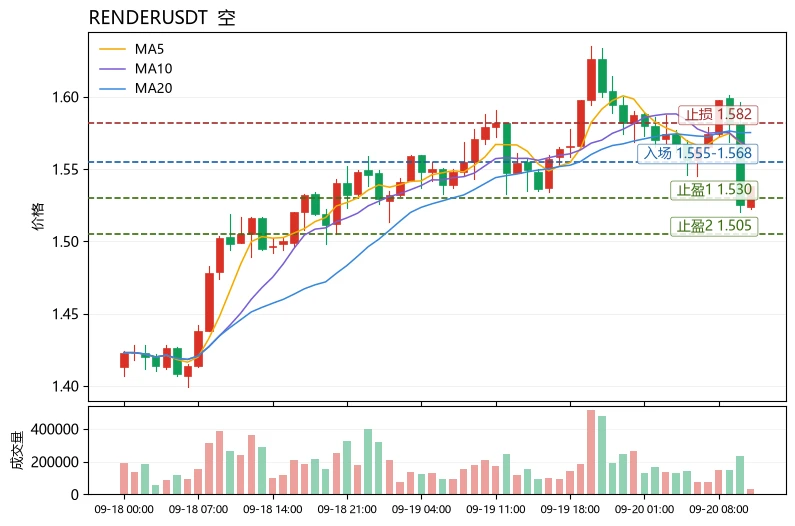
$SUI /USDT - SHORT

Trade Plan:
Entry: 0.8238 – 0.8310
SL: 0.8618
TP1: 0.8016
TP2: 0.7844
TP3: 0.7586

Why this setup?
Why now? The 1h price is sitting at 0.8274, right inside a tight entry zone of 0.8238 to 0.8310, which signals a clean spot to initiate a short. The 15m RSI reading of 57.06 shows the asset is neither overbought nor oversold, giving us room for a directional move rather than a random spike. The 1h ATR of 0.014325 confirms that volatility is compressed, meaning a breakout is overdue and likely to be sharp. With the d
post-image
SUI+0.69%
JUST IN: Polish prosecutors charge a suspect in the Zondacrypto probe with organized crime and misappropriation of $2.1 million in user funds.
Prosecutors are seeking pretrial detention.
post-image
9.8 Gold Morning Strategy
On the hourly chart, gold prices are generally fluctuating at low levels after the decline, trading below the middle Bollinger Band under pressure. The upper Bollinger Band continues to exert downward pressure, and multiple rebounds have failed to break through effectively. Bears have the upper hand in the short term, while the pace of the decline has slowed somewhat. Do not blindly bottom-fish in the morning; focus on opportunities to short when rebounds encounter resistance.
Key Levels
Resistance: 4420, 4440
Support: 4405, 4385
Strategy:
Short on resistance in the 4
post-image
XAUT-0.23%
I only wanted to freeload a breakfast, but the market ended up wrapping me in dumplings for half a year. When I opened the chart this morning, before the market had fully started moving, I saw buying pressure firmly supporting the lows.
The bottoming process failed to make a new low, and funds were still quietly entering, so I knew this opportunity wouldn’t get away. I went long directly at the time, entering at 0.6959.
It’s 0.77 now, with a return of +211.23%; isn’t it fair to say I delivered the answer? The brothers on board should all be waking up laughing.
The market is waited out, and pro
post-image
DOGE-0.13%
LAB-2.57%
hot Topics updates
live-cover
LIVE40
ethereum:native
Higher low or one thousand US dollars
post-image
ETH-1.06%
Market Alert

$XAU /USDT - SHORT

Trade Plan:
Entry: 4412.12 – 4417.04
SL: 4438.22
TP1: 4396.85
TP2: 4385.03
TP3: 4367.30

Why this setup?
Technical setup found.

Debate:
Thoughts?

⚠️ Personal market analysis only. NFA — manage risk and DYOR.
Educational content, not investment advice or a recommendation to buy, sell, deposit, or withdraw any asset. No paid promotion or referral/affiliate links.
XAU-0.33%
BTC, Gold, and Crude Oil Analysis
live-cover
LIVE73
This return has me feeling uneasy, worried the market will catch on tomorrow and blacklist me.

While the screen was glowing green, $BE instead formed an independent bottom. I said at the time that this wasn’t normal—rebounds don’t happen through shouting; you have to see whether real money is flowing in. Later, volume clearly followed through, and the bottom became firmly established, so I opened a position at 200.9.

The current price has reached 269.4, with an unrealized profit of +1643.2%. This move has been genuinely comfortable—the market was worth waiting for, the position was worth t
post-image
BE+0.60%
BNB-1.85%
SOL-2.55%
I originally wanted to cut my losses and sacrifice to the heavens, but the sacrifice never happened—the meat cooked itself. 😂

During the repeated fluctuations, $UNITREE fell short every time it tried to push higher, with clear resistance overhead. I had just one thought: with this kind of trend, it would be hard to justify not joining the shorts. I entered directly at 97.209, without expecting an immediate result. Who knew it would give me the answer in the middle of the night?

It’s at 80.2 now, with +840.4% on the entry, and the short position has been fully realized. It feels incredible
post-image
UNITREE+0.13%
SOL-2.55%
XRP-2.03%
JUST IN: Intel reportedly plans a 10% price hike for PC CPUs in early October, continuing a year of rising costs despite a slight PC market dip expected in 2027. Could pressure margins, potentially opening room for Arm-based rivals in IPC/edgeIoT. $INTC
post-image
INTC+4.52%
ARM+3.92%
I originally wanted to cut my losses as an offering to heaven, but heaven wasn't appeased—the meat roasted itself.

While everyone else was running, I wasn't in a hurry to leave. $HYPE That kind of drop was clearly padded with water, with funds quietly entering and each lower wick growing longer than the last. A bottoming grind without a breakdown means someone is setting the stage. What I gave at the time was: go long, with only one target—wait for it to make its move.

Well, the price has now climbed from 83.212 to 85.129, +163.58%. The gains this time may be a little thin, but I love them
post-image
HYPE-3.04%
SOL-2.55%
BTC-1.42%
$SNDK /USDT is about to break a hidden range that most traders are ignoring right now.

$SNDK /USDT - SHORT

Trade Plan:
Entry: 1783.05 – 1786.59
SL: 1801.79
TP1: 1772.09
TP2: 1763.60
TP3: 1750.88

Why this setup?
Why now? The 1h price is pinned at 1784.82 inside a tight range on the daily trend, which means momentum is coiled and ready to snap. The 15m RSI reading of 46.33 shows just enough bearish lean to favor a short move over a bounce. With the 1h ATR at 7.07183, the average candle size is small enough that the entry zone between 1783.05 and 1786.59 offers a clean limit with room to br
SNDK-0.01%
This was purely the market being in a good mood, casually tossing out some gold coins that happened to land right on my head.
I had just finished lunch and was checking the charts. The market was still dragging its feet, but I noticed funds quietly entering. Volume was expanding moderately while the price was still languishing at the lows—this setup felt like it was about to make a move.
Then it took off directly: $ENA climbed from 0.09610 all the way to 0.16474, with returns reaching +3439.18%. It was truly sluggish at first, but the result was truly sweet.
I took profit on 80% and left 20% o
post-image
ENA-6.94%
ETH-1.07%
ADA-1.35%
Why is everyone suddenly shorting silver when the daily trend is range?

$XAG /USDT - SHORT

Trade Plan:
Entry: 66.32 – 66.44
SL: 66.97
TP1: 65.94
TP2: 65.65
TP3: 65.21

Why this setup?


Debate:
Are we cleanly hitting TP2 or is this range about to trap the shorts?

⚠️ Personal market analysis only. NFA — manage risk and DYOR.
Educational content, not investment advice or a recommendation to buy, sell, deposit, or withdraw any asset. No paid promotion or referral/affiliate links.
XAG+0.12%
Load More

Join 40 M users in our growing community

⚡️ Join 40 M users in the crypto craze discussion

💬 Engage with your favorite top creators

👍 See what interests you

View More