Square
Following
Hot
News
Notifications
Profile

Knox_Crypto

vip
Spot Trader Community Builder
Live TradingPeak Tier VIP 00.1 Year(s)
5
Following
1.5k
Followers
1.2k
Liked
$XMR is showing signs of weakness as sellers continue to pressure the market. The current momentum looks fragile, and another move lower remains possible if resistance holds.

Key Figures

$492.28–$495.24 — Resistance and rejection zone
$510.00 — Invalidation level
$464.38 — First downside level
$456.38 — Next support zone
$439.13 — Deeper downside target
RSI: 47 — Momentum remains below the bullish zone.

Market Outlook

As long as XMR struggles to reclaim the $495 area, bearish pressure could remain dominant. A sustained rejection may open the door for further downside, while a break above
post-image
XMR+0.00%
  • 4
  • 3
$ETH A Key Support Zone to Watch
Ethereum is approaching a potentially important accumulation area between $1,600 and $1,800. This zone could attract buyers and provide a foundation for a broader recovery if market sentiment starts improving.

If ETH manages to hold this range and buying pressure gradually returns, the first major upside area to watch is $2,000, followed by $2,800. A stronger market recovery could eventually bring $4,000 back into focus.

I'm keeping a close eye on how price reacts around this support. Rather than chasing sudden moves, I prefer a gradual accumulation approach
post-image
ETH-1.26%
  • 2
  • 1
$LTC is showing signs of weakness as its recent recovery struggles to gain sustainable momentum. Despite attempts to move higher, the price is facing selling pressure around the current resistance region, suggesting that buyers are still finding it difficult to establish strong control.

The current market structure keeps the bearish outlook in focus, with attention on whether LTC can maintain its recovery or face another round of downward pressure. The setup is based on approximately 23x leverage, making risk management especially important in the current market conditions.

Key Figures

$44
post-image
LTC-0.07%
  • 2
  • 1
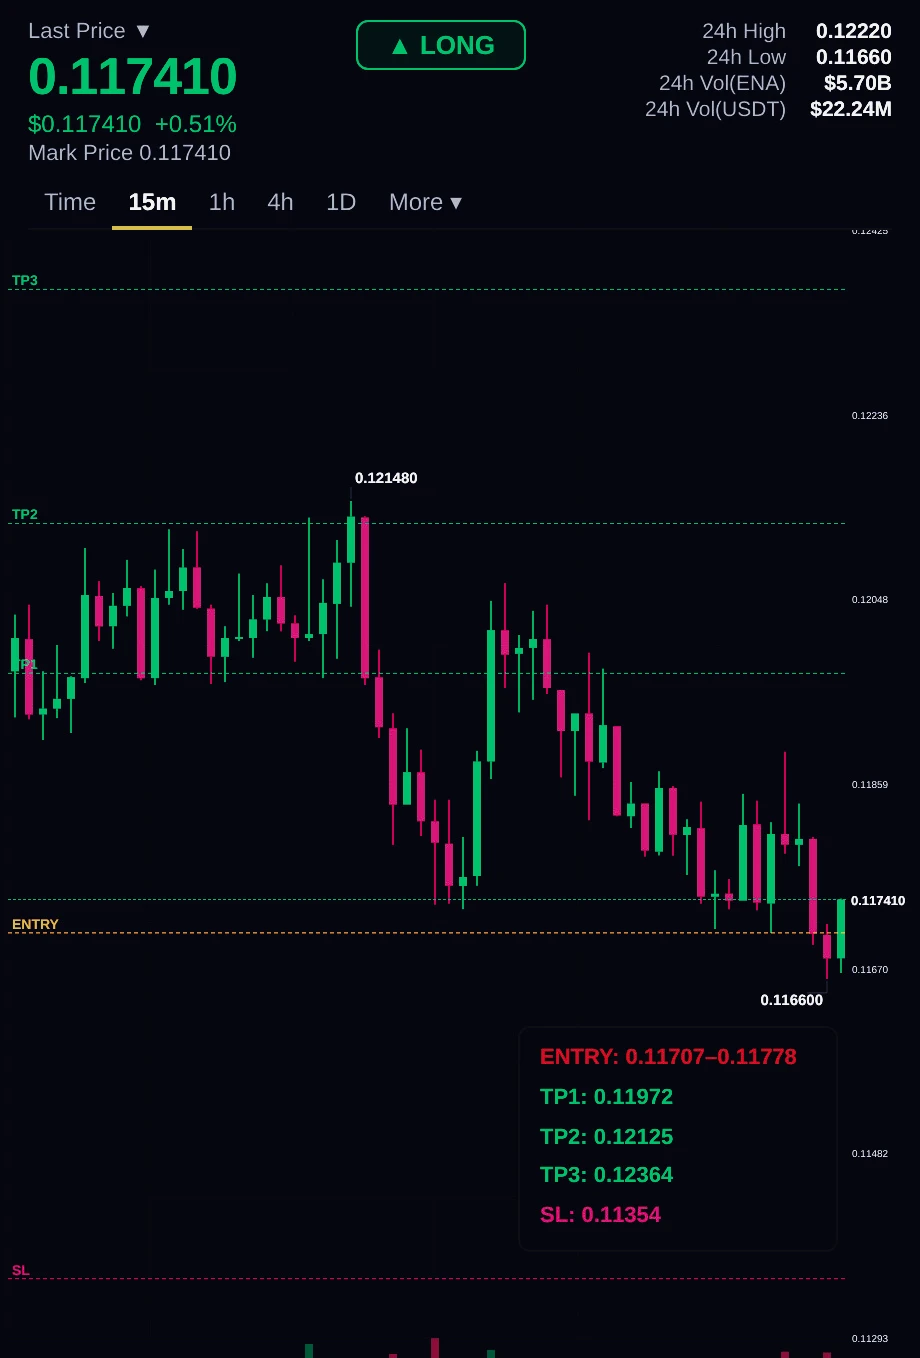
$ENA LONG SETUP — BUYERS DEFENDING KEY SUPPORT
Ethena ($ENA) is showing signs of a potential bullish recovery as buyers attempt to defend the current support zone on the 1H timeframe. Price is holding around $0.1171–$0.1178, suggesting that buying interest is emerging at these levels.
Funding is currently positive at +0.005%, while RSI sits at 44. This indicates that momentum has room to improve, although confirmation from buyers is still needed.
Key figures
$0.1171–$0.1178 — Entry zone and immediate support area.
$0.1197 — First upside target.
$0.1213 — Second resistance target.

#GateIPOAcc
post-image
ENA+8.04%
  • 1
BNB BEARS REMAIN IN CONTROL — SELLING PRESSURE PERSISTS
BNB is showing signs of weakness, with RSI currently around 43, indicating that bearish momentum remains stronger than buying pressure. The price is struggling to regain bullish strength, keeping the short-term outlook tilted toward the downside.$BNB ‌

Key figures

$590.69–$594.24 — Entry zone
$605.88 — Stop-loss level
$567.71 — First downside target
$560.29 — Second downside target
$545.10 — Extended downside target

Market outlook

As long as BNB remains below the $594.24 region, sellers may continue to dominate. A rejection from this
BNB-0.76%
  • 1
$SOL FACES SELLING PRESSURE — BEARS WATCHING FOR A DEEPER CORRECTION
Solana is showing signs of weakness after struggling to maintain upward momentum near a key resistance area. Buyers have attempted to push the price higher, but selling pressure is becoming more noticeable, suggesting that the recovery may be losing strength.

The current structure favors a cautious bearish outlook, especially if SOL continues to face rejection around the 71.30 region. A failure to reclaim this area could give sellers another opportunity to push the price toward lower support levels.

Key figures

$71.14–$71
post-image
SOL-0.77%
$NEAR BULLISH MOMENTUM: BUYERS DEFEND $3.087 SUPPORT AS RECOVERY CONTINUES
NEAR is showing signs of renewed buying interest after bouncing from the $3.0870 support zone. Price is currently trading around $3.183, indicating that buyers are attempting to maintain control and extend the recovery.

The key area to watch is $3.130–$3.087. As long as buyers continue defending this zone, the bullish structure remains intact. A strong breakout above $3.198, supported by increasing trading volume, could provide further momentum for an upward move.

Key figures

$3.183 — Current market price

$3.130–$3
post-image
NEAR+1.17%
  • 8
  • 4
$INIT SHOWS STRENGTH AFTER 32% RALLY — CAN BUYERS PUSH TOWARD $0.15?
INIT is showing encouraging bullish momentum following its recent 32% surge. Buyers are attempting to maintain control, with the $0.1320 area becoming an important level to watch.

As long as price stays above this zone, the recovery structure remains constructive. A move above $0.1397 could attract additional buying interest and create room for a continuation toward $0.1450 and potentially $0.1520.

Key figures

$0.1320–$0.1340 — Important support and price-holding zone.

$0.1397 — Key resistance and bullish breakout level.
post-image
INIT-2.53%
  • 3
  • 2
Tom Lee Sees the Recent Crypto Sell-Off as a Temporary Setback, Not the End of the Bull Cycle.

Tom Lee believes the latest pressure across crypto markets is being driven by several external factors rather than a breakdown in the long-term market outlook.

He points to Nvidia-related margin calls, investors reducing exposure ahead of the anticipated Anthropic IPO, the release of previously frozen hack-related funds, growing concerns around AI disruption, and increased US scrutiny of chip exports.

Despite these challenges, Lee remains confident that the broader crypto supercycle is still intac
NVDA-4.11%
  • 2
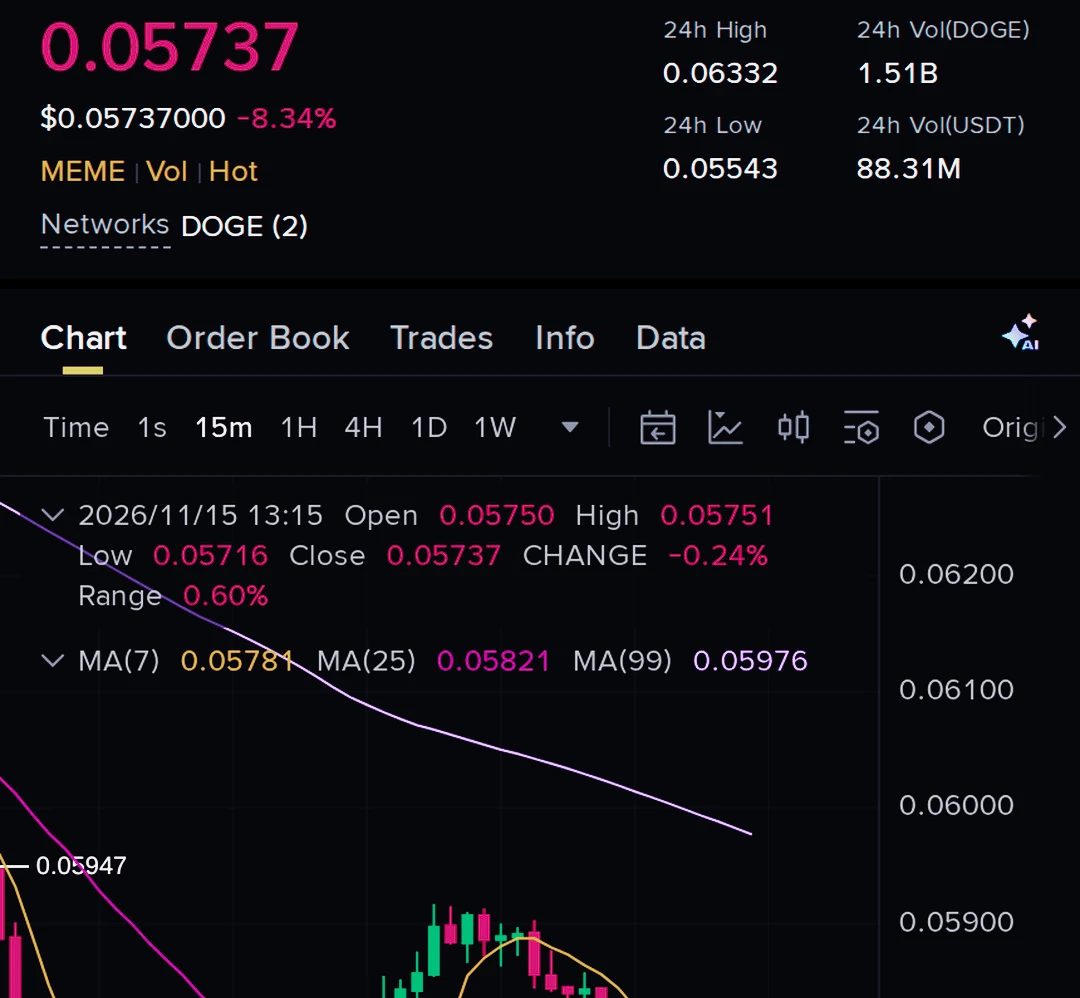
$DOGE BEARISH MOMENTUM REMAINS IN FOCUS
Dogecoin is still struggling to regain its previous support area, suggesting that buyers have not yet shown enough strength to reverse the current short-term weakness. Every unsuccessful recovery attempt keeps selling pressure relevant, while the inability to establish a stronger position above the previous support zone gives sellers an advantage.

#GateIPOAccessAnthropic
post-image
DOGE-0.22%
  • 3
  • 3
$WLD is showing signs of a potential bearish reversal after facing rejection near resistance. Momentum needs close attention, especially as RSI has cooled down to 42.

Negative funding at -0.044% also highlights unusual positioning in the derivatives market. If sellers maintain pressure, WLD could revisit lower support zones.

Key figures

$0.2600–$0.2616 — Resistance and rejection zone

$0.2693 — Important invalidation level

$0.2477 — First downside support

$0.2414 — Secondary support

$0.2320 — Major downside level

Market outlook

A sustained rejection below resistance could strengthen b
post-image
WLD-5.61%
  • 4
$SOL Market Analysis: Bears Are Testing Lower Support
Solana is showing continued bearishpressure as sellers attempt to push the price below its recent support structure. With SOL trading around $72.96, the market remains vulnerable to further downside if buyers fail to defend the current region.

Key figures

$76.50 — Upper resistance area

$73.50 — Important short-term price zone

$72.96 — Current reference price

$71.80 — First downside support

$70.00 — Psychological support level

$68.50 — Next potential support

$66.00 — Deeper downside area

Bearish Scenario

If SOL fails to reclaim th
post-image
SOL-0.77%
  • 2
  • 1
$HYPE Shows Bullish Potential as Buyers Defend Key Support
HYPE is attracting attention as buyers attempt to defend the current support zone on the 1H timeframe. The RSI is around 30, indicating oversold conditions and the possibility of a short-term recovery.

Funding is currently at +0.002%, while price action suggests buyers are stepping in around the $65.80–$66.20 region. However, sustained buying pressure will be important to confirm a stronger upward move.

Key figures

- $65.80–$66.20 — Important support and reaction zone
- $63.81 — Critical downside level
- $68.16 — First upside resis
HYPE+0.24%
$INJ Recovery Faces Selling Pressure as Bears Regain Control
INJ is struggling to maintain its recent recovery, suggesting that bearish pressure is still present. Sellers appear to be gaining strength, while the price continues to face difficulty moving higher.

A rejection from the current area could open the door for further downside toward the lower support zones. However, continued selling pressure will be important to confirm bearish momentum.

Key figures

- Entry Zone: $7.649–$7.674
- TP1: $7.432
- TP2: $7.240
- TP3: $7.049
- Stop Loss: $7.868
- Leverage: 40x

#INJ #GateIPOAccessAnthro
INJ-1.67%
  • 3
  • 3
$XAU Shows a Potential Bullish Recovery From Support
Gold ($XAU) is attempting to recover after bouncing from a key support area. Buyers are showing renewed interest, and the next move will depend on whether bullish momentum can sustain itself.

Key figures

- Take Profit: $3,923.481
- Stop Loss: $3,856.893

A continued hold above support could strengthen the bullish outlook, while a break below the support region may weaken the recovery and bring further downside into focus.

Price confirmation remains important before expecting a stronger upward move.

#GateIPOAccessAnthropic
XAU+0.38%
  • 3
$NIGHT Shows Strong Bullish Momentum as Buying Pressure Increases
NIGHT is gaining upside momentum as buying activity strengthens and trading volume continues to expand. The EMA structure remains positively aligned, suggesting that buyers are maintaining control of the short-term trend.

Key figures

$0.04809 — Current price

+8.94% — 24-hour gain

$0.04751–$0.04769 — Important price zone

$0.04703 — Key support

$0.04817 — First upside level

$0.04863 — Next resistance

$0.04909 — Higher upside level

Bullish Scenario

If NIGHT holds above the $0.0475 area, continued buying pressure could su
NIGHT-3.10%
$SUI Shows Early Recovery Signs – Is a Bullish Bounce Building?
SUI is showing signs of a potential recovery after recent selling pressure. Buyers appear to be stepping back into the market, suggesting that bearish momentum may be weakening in the short term.

However, the recovery still needs confirmation. Holding above the $0.7700 area could help strengthen bullish sentiment and create room for further upside.

Key figures

$0.7700–$0.7730 — Important recovery zone

$0.7640 — Key support level

$0.7780 — First upside resistance

$0.7830 — Next resistance area

$0.7900 — Higher recovery targ
post-image
SUI-1.05%
  • 1
$ZEC Recovery Faces Renewed Selling Pressure

$ZEC attempted to regain bullish momentum, but the latest recovery is showing signs of weakness. Buyers are struggling to maintain upward pressure, while sellers appear ready to take control again.

The $908–$911 region remains an important area to watch. Continued weakness could expose lower support zones, while a strong move above resistance would challenge the current bearish outlook.

Key figures

$908.94–$911.38 — Recent price recovery zone

$928.06 — Key resistance and invalidation level

$884.88 — First downside support

$860.10 — Second su
post-image
ZEC+1.16%
  • 3
  • 3
$ETH Recovery Faces Selling Pressure as Bears Regain Control
Ethereum is struggling to maintain its recent recovery, with sellers beginning to regain momentum. The current price structure suggests that upside strength is fading, keeping downside levels in focus. If ETH fails to reclaim nearby resistance, further weakness could develop toward lower support zones.
Key figures
$2,008.81–$2,011.11 — Previously identified price area
$2,042.12 — Key resistance and invalidation level
$1,962.90 — First downside level
$1,919.02 — Next support area
$1,869.36 — Deeper downside level

#JensenHuangResigns
post-image
ETH-1.26%
  • 1
Load More