Square
Following
Hot
News
Notifications
Profile

EqunixHub

vip
Crypto Analyst, Market Insight, AI Coin Analyst.
Live TradingOn-chain AnalystCrypto Market ResearcherQuant Trader
77
Following
4.4k
Followers
7.8k
Liked
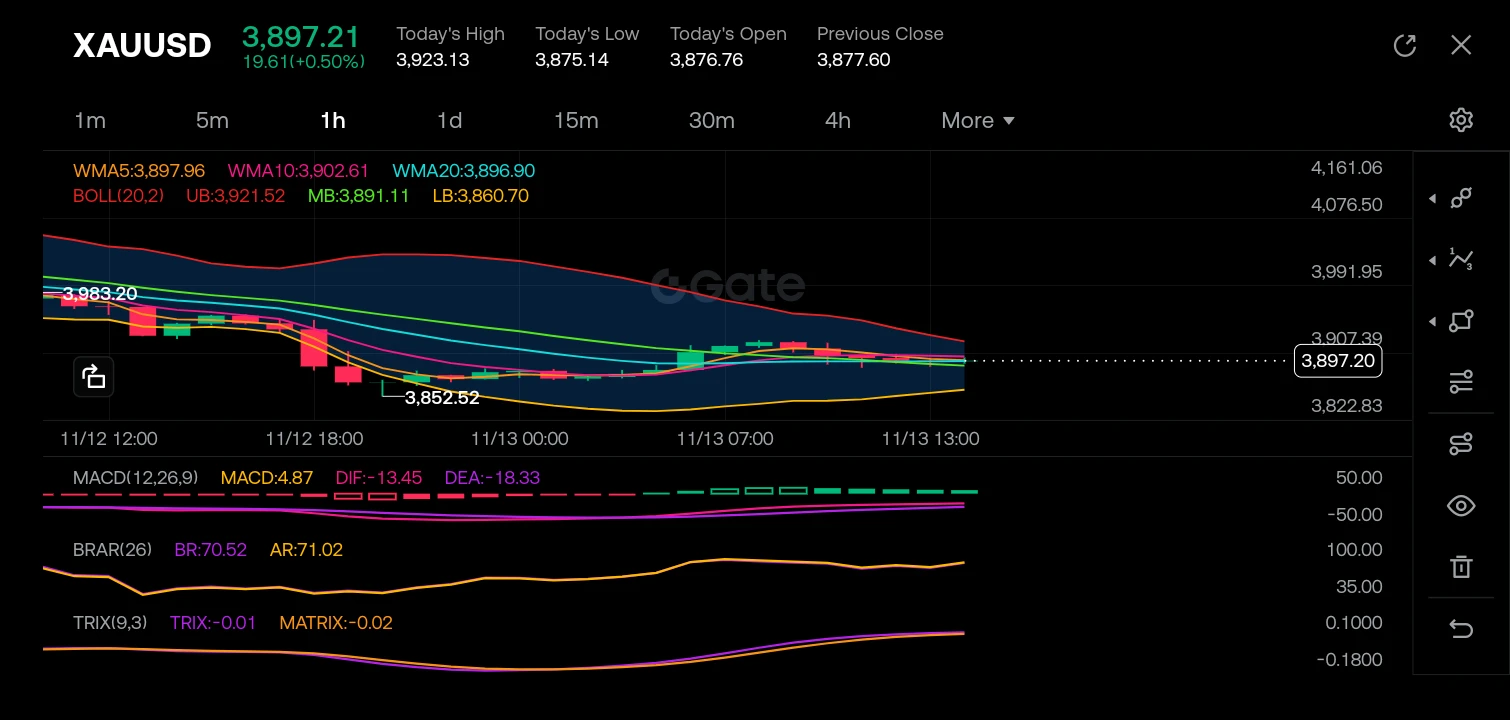
$XAUUSD ‌
Looking at the 1H chart, the market structure is currently in a corrective consolidation phase following a prior downtrend. Price recently swept liquidity to the downside, bottoming out at a swing low of 3,852.52, before forming a base and attempting a recovery. The K-line analysis shows a shift from heavy bearish momentum into a choppy, range-bound environment, with price now hovering around 3,897.21, attempting to establish support above the WMA5 (3,897.96) and WMA10 (3,902.61).

The recent price action prints a series of small-bodied candles with wicks on both sides, suggesting i
post-image
XAUUSD+0.00%
  • 5
  • 1
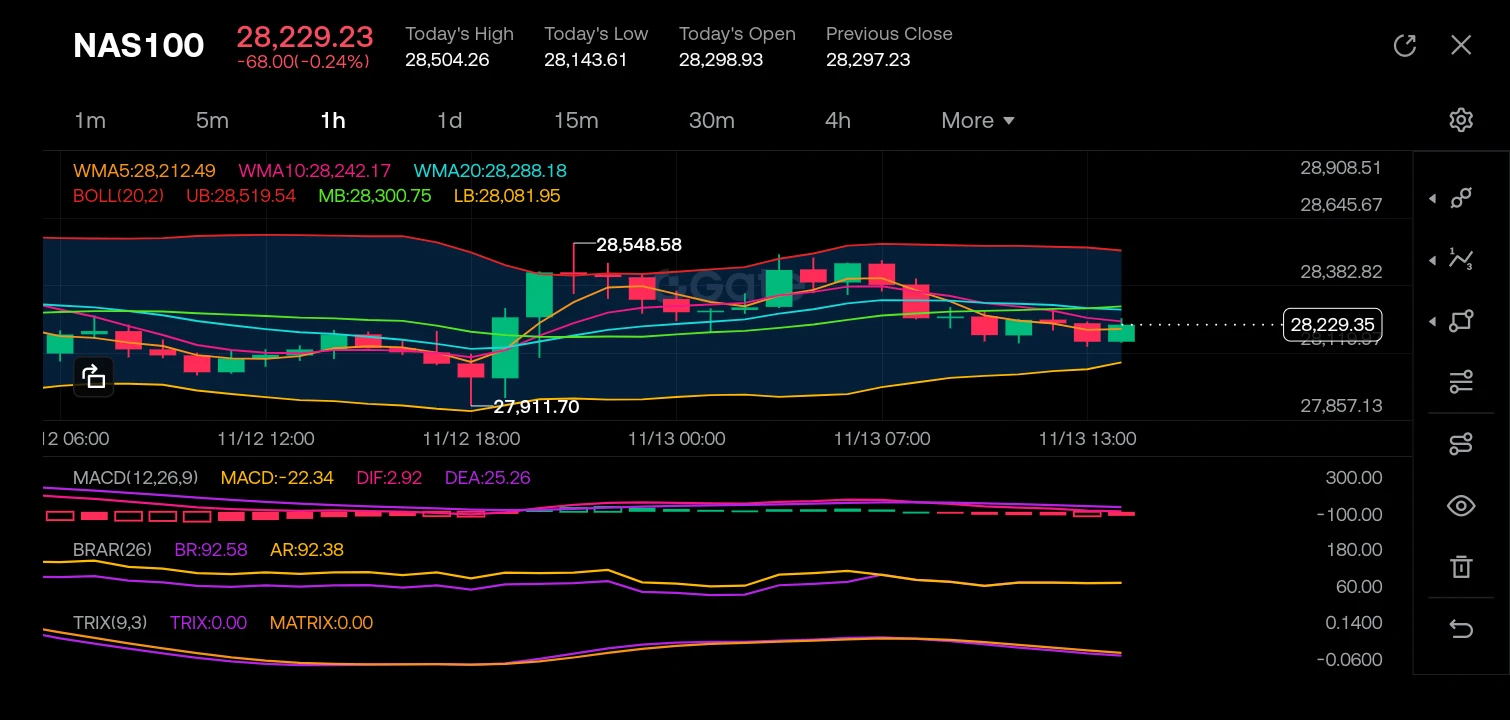
$NAS100 ‌
Looking at the 1-hour chart, the market structure has shifted from a bearish downtrend into a consolidation phase, having established a solid support base around the 27,911.70 level and a local resistance peak at 28,548.58, though the current price action is struggling to maintain the highs near the 28,300 level where the midline of the Bollinger Bands is acting as dynamic resistance.

The recent K-lines are showing indecision with alternating red and green candles hugging the middle Bollinger Band (MB: 28,300.75), and we are currently seeing small-bodied candles forming a potential
post-image
NAS100+0.00%
  • 3
  • 2
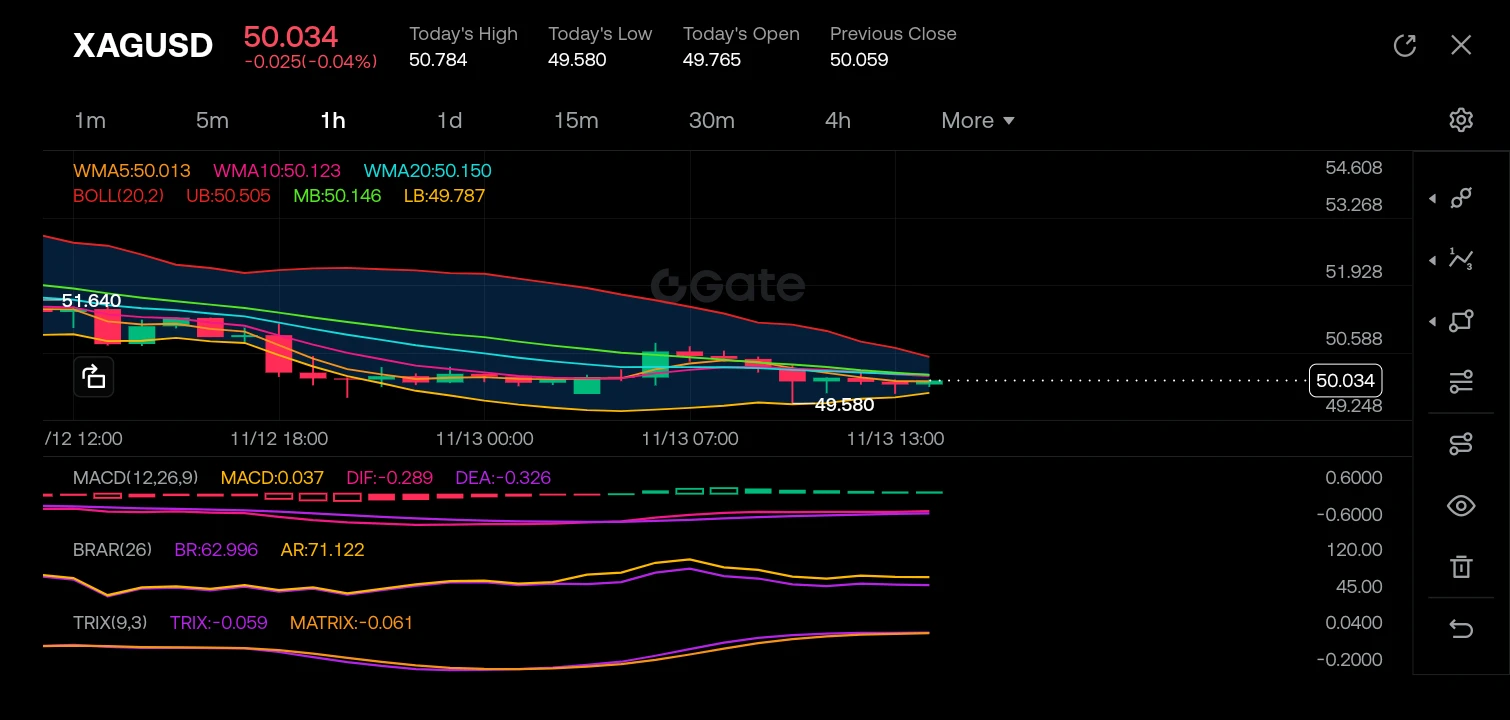
$XAGUSD ‌
Looking at the 1-hour timeframe, the market structure has shifted from a clear bearish downtrend into a low-volatility consolidation phase. The price previously made a sharp drop, bottoming out at 49.530, and has since been grinding sideways in a tight range. The K-lines are currently printing small bodies, indicating indecision and a battle between buyers and sellers. Price is currently hovering at 50.034, wedged right in the middle of the Bollinger Bands (UB: 50.505, LB: 49.787) and slightly below the middle band (MB: 50.146). The moving averages (WMA5, WMA10, WMA20) are clustered
post-image
XAGUSD+0.00%
  • 4
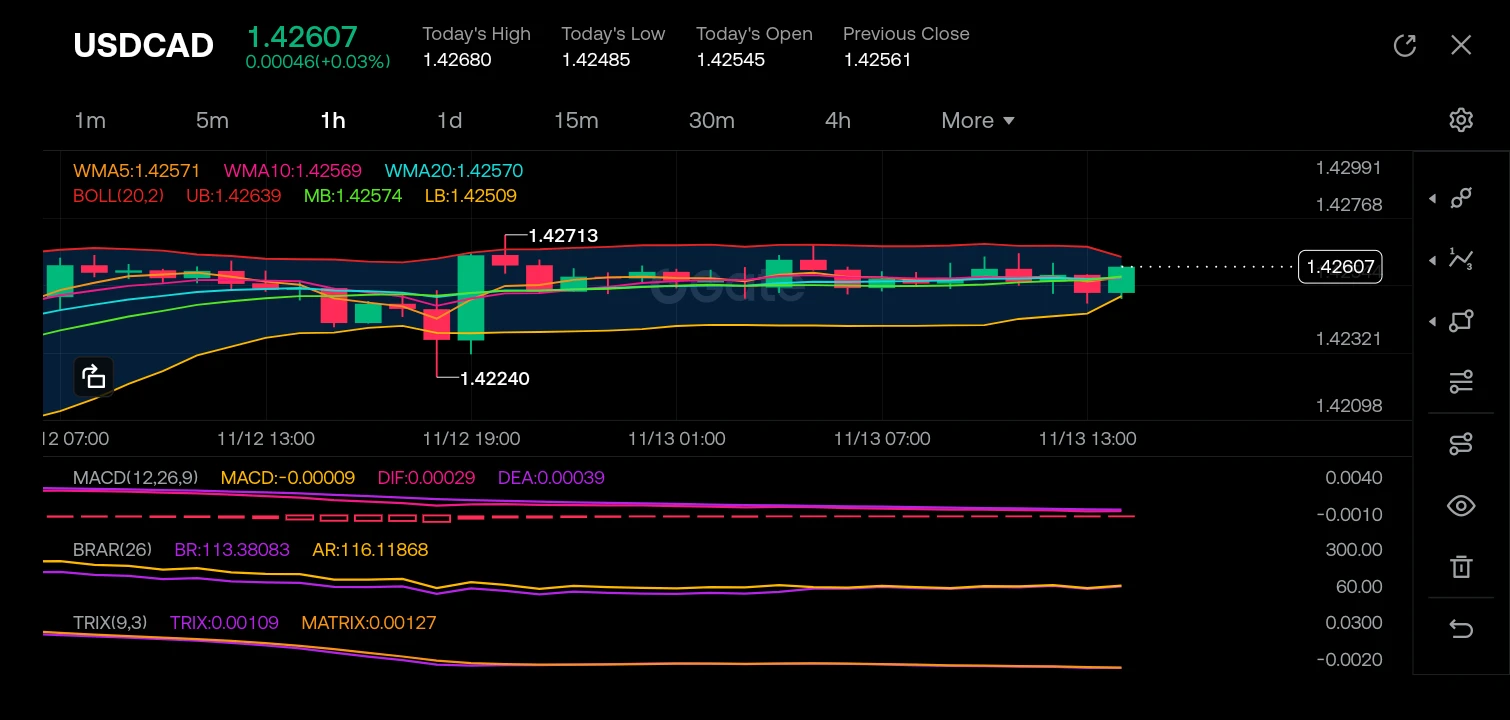
$USDCAD ‌
Looking at the 1-hour chart, the market structure recently shifted from a bearish impulse down to 1.42240 into a consolidation phase, forming a potential short-term bottom. The K-lines are currently compressing tightly between the upper Bollinger Band (1.42639) and the middle band (1.42574), indicating a period of low volatility and indecision. Price is hugging the middle band, acting as dynamic support, while the WMA lines (5, 10, 20) are converging flat, confirming a ranging market rather than a trending one.

The recent candles are showing small bodies with wicks on both sides (D
post-image
USDCAD+0.00%
  • 2
$EURUSD ‌
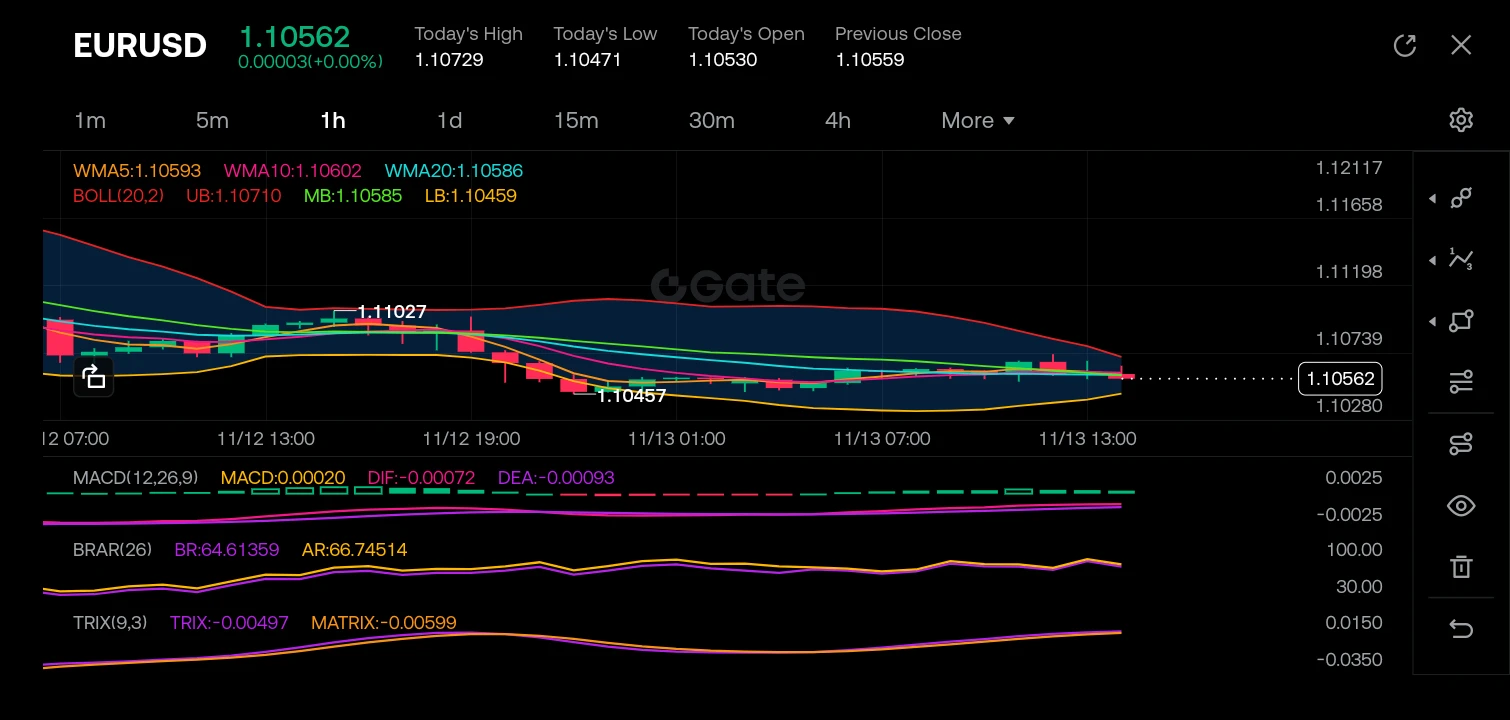
Looking at the 1-hour timeframe, the market structure has recently shifted from a bearish impulse to a consolidation phase. After a sharp drop from the highs near 1.11027 down to the 1.10457 liquidity grab, price has stopped making lower lows and is currently forming a base. The structure is attempting to transition into a bullish correction or reversal as price pushes back above the short-term moving averages (WMA5 and WMA10) and tests the middle Bollinger Band.

The K-line action shows a series of small-bodied candles with mixed colors, indicating indecision and a compression in v
post-image
EURUSD+0.00%
  • 5
$XBRUSD
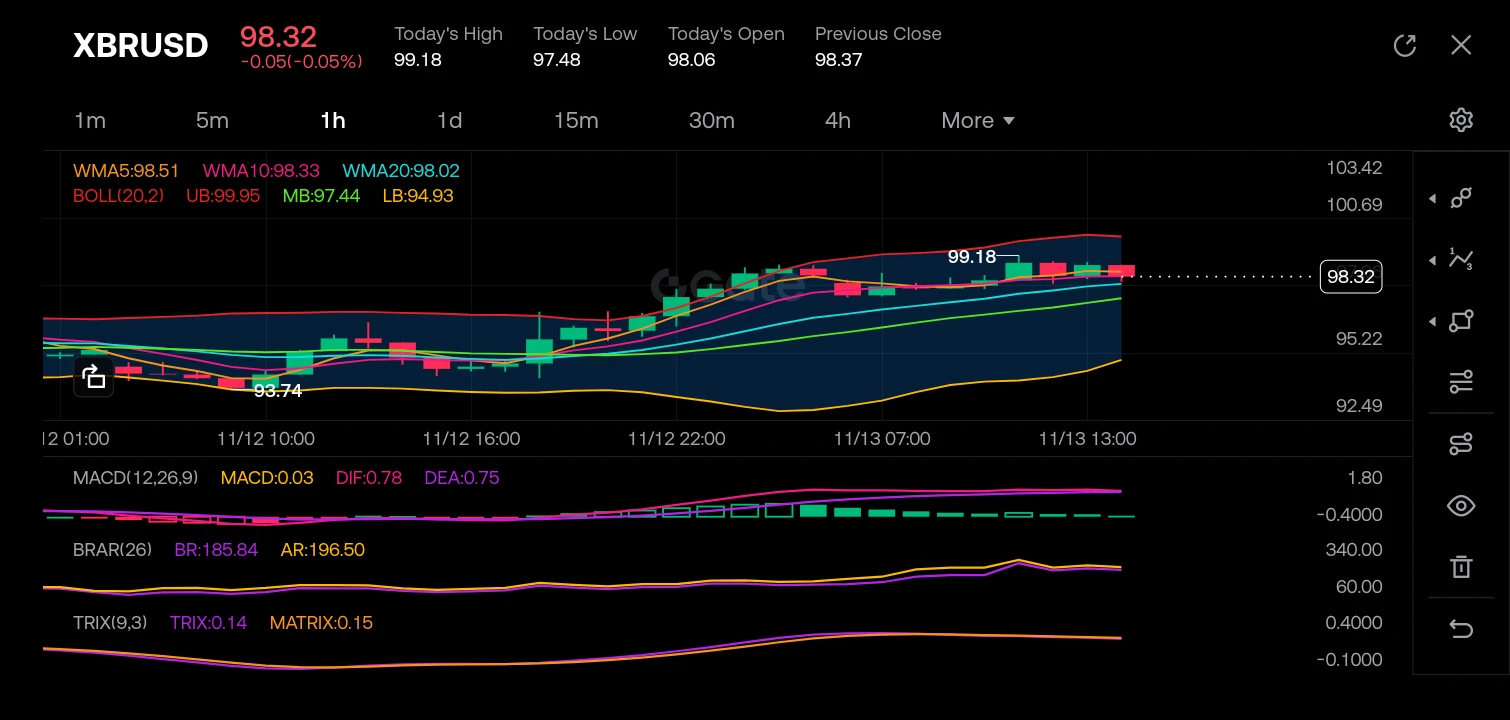
Looking at the XBRUSD (Brent Crude) 1-hour chart, the market structure has clearly shifted from a bearish downtrend to a bullish reversal structure. Price successfully bottomed out at 93.74 and has since established a series of higher highs and higher lows. The K-line analysis shows strong bullish momentum, with the price action currently riding above the WMA5 (98.51), WMA10 (98.33), and WMA20 (98.02), while the Bollinger Bands have expanded upward, confirming the volatility and trend direction. The MACD is well into positive territory (DIF 0.78, DEA 0.75), though the histogram is fla
post-image
XBRUSD+0.00%
  • 1
  • 2
$XTIUSD ‌
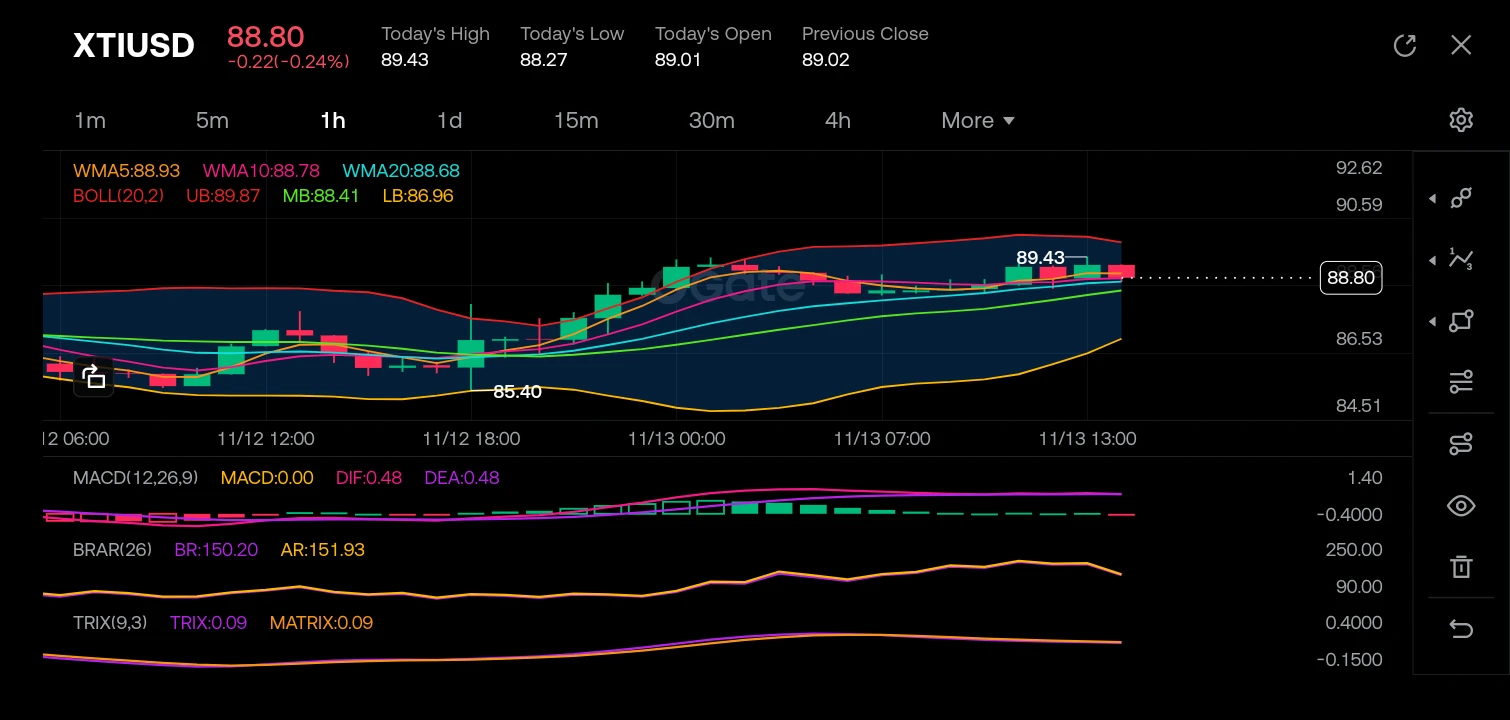
The market structure has recently shifted from a bearish retracement to a bullish recovery, as price bounced firmly off the 85.40 support level and established a higher low. Price is currently trading at 88.80, consolidating just below the upper Bollinger Band (UB: 89.87) and above the key moving averages (WMA5: 88.93, WMA10: 88.78), indicating strong short-term momentum. The K-line analysis shows a series of bullish candles with shallow pullbacks, and the MACD (0.48) remains in positive territory above the zero line, confirming the buyers are in control despite the slight intraday
post-image
XTIUSD+0.00%
  • 4
$NG ‌
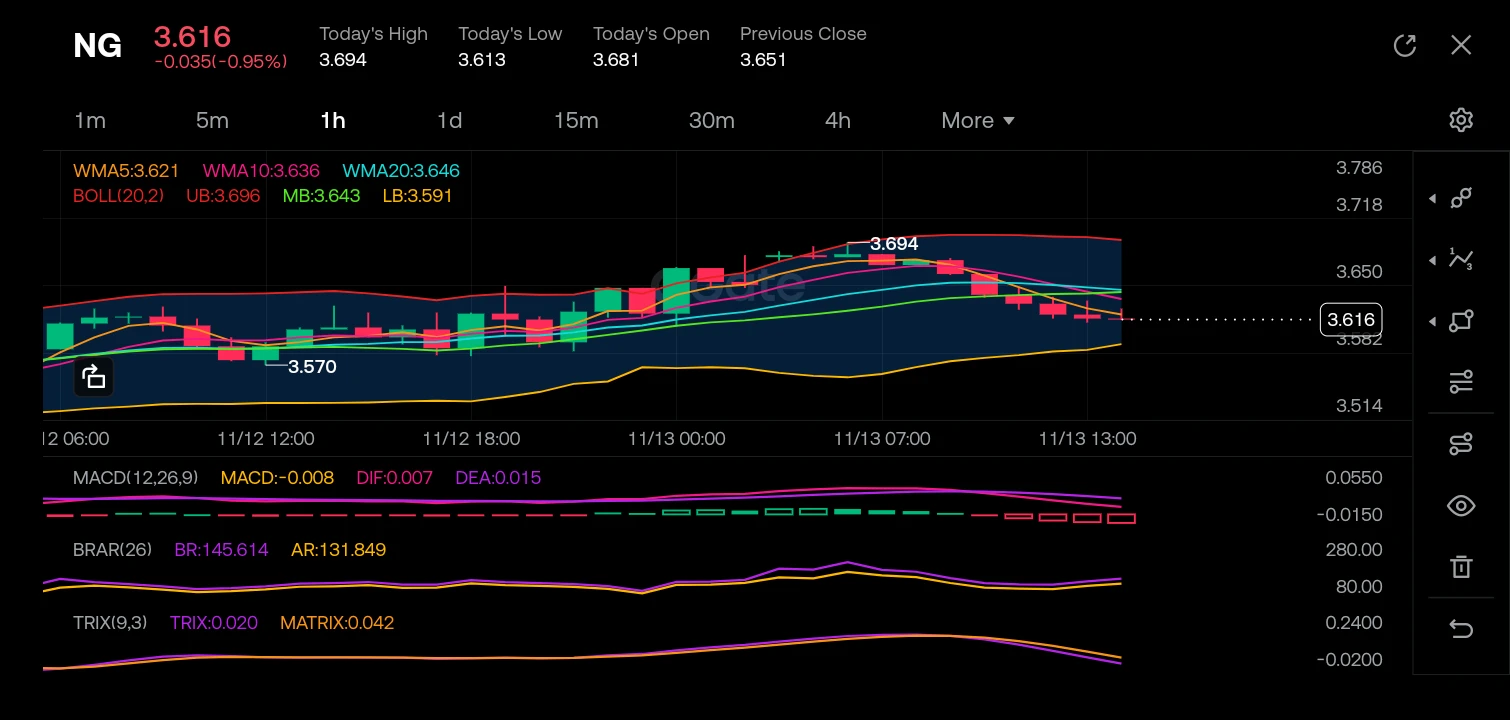
Looking at the 1-hour NG (Natural Gas) chart, the market structure recently transitioned from a bullish impulse (pushing from a low of 3.570 up to a peak of 3.694) into a bearish corrective phase. The K-line analysis shows a clear rejection at the 3.694 high, followed by a series of lower highs and lower lows. Price has now broken below the middle Bollinger Band (MB: 3.643) and is riding the lower half of the channel, currently resting at 3.616, just above the lower band (LB: 3.591). The WMA lines (5, 10, 20) are compressing and flattening, signaling a loss of bullish momentum, while th
post-image
NG+0.00%
  • 1
$HYPE
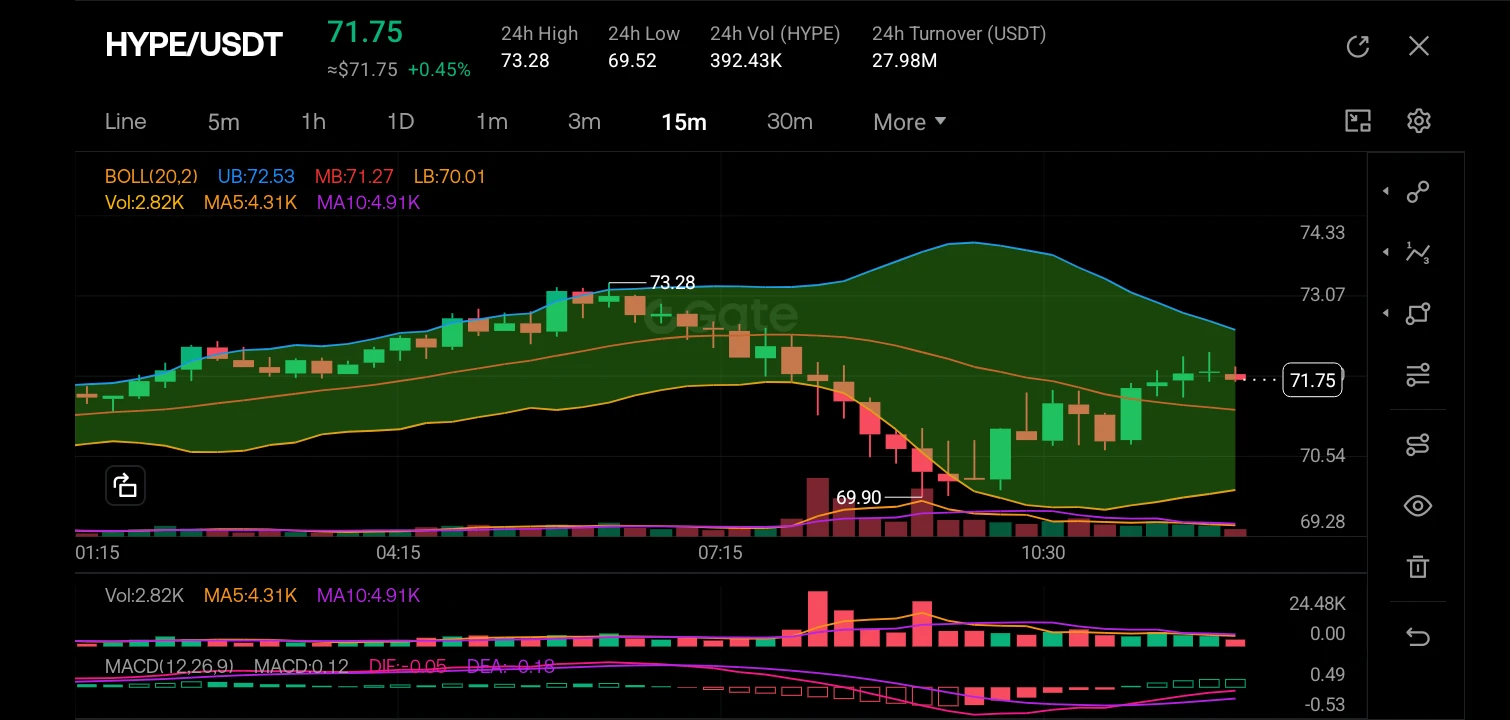
The market structure has recently shifted from a sustained bullish uptrend to a corrective bearish phase. Price formed a local peak at 73.28 and aggressively sold off, breaking below the middle Bollinger Band (MB: 71.27). However, the most critical structural event is the price action around 10:30, where the price pierced the lower Bollinger Band (LB: 70.01) and wicked down to a low of 69.90. Since that dip, the K-lines show a change in character: the price has rejected the lower boundary and is now printing higher lows, consolidating back toward the mid-band. The volume profile confirm
post-image
HYPE+0.24%
  • 2
  • 1
$ARIA ‌
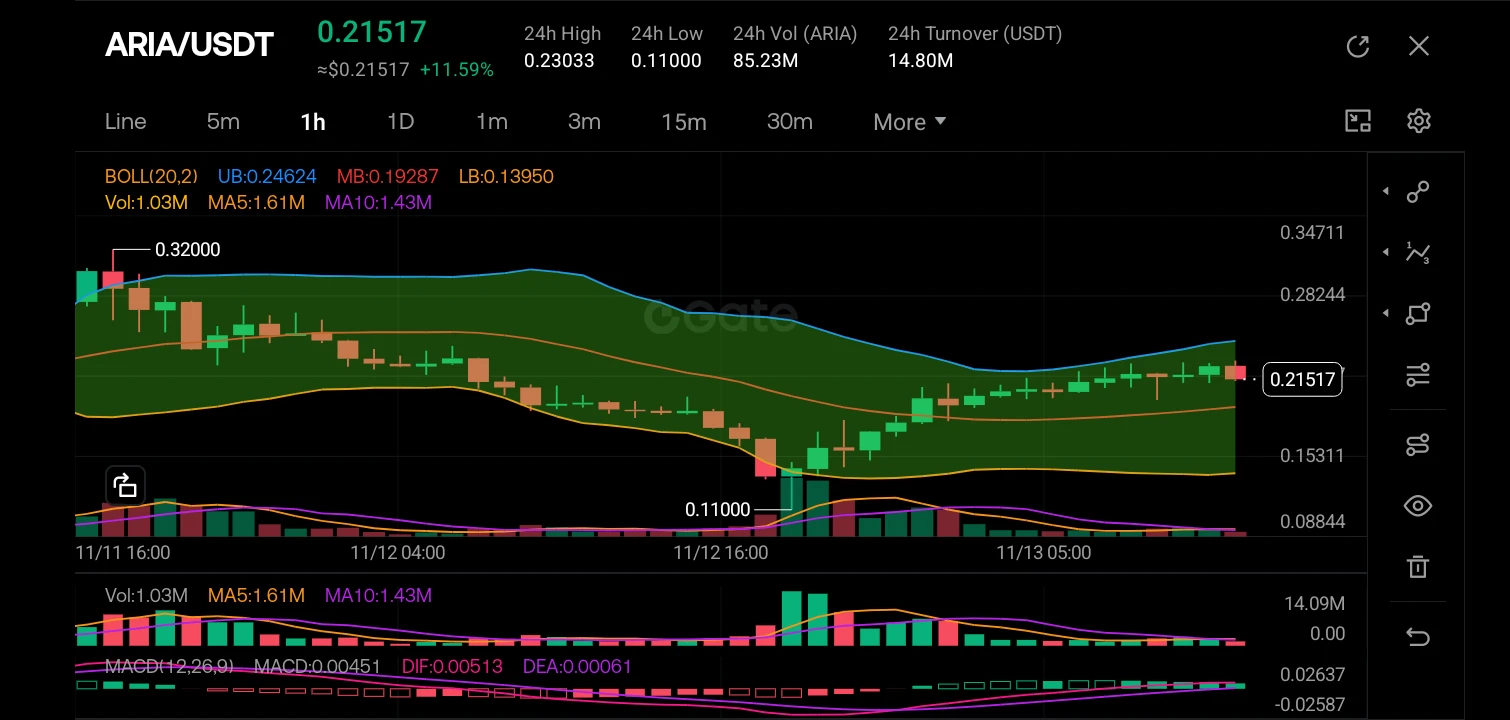
The market structure has shifted from a heavy downtrend to a bullish reversal. After a steep drop to the 0.11000 floor, we see a structural break to the upside (BOS) as price reclaimed the 0.19 level and pushed to 0.21517. The K-lines (candles) show strong buying momentum with consecutive green closes, pushing the price from the lower Bollinger Band toward the upper band (UB: 0.24624), indicating high volatility and a potential overextension in the short term. The MACD is showing a bullish crossover with the histogram expanding green, confirming the current momentum.

I am observing a
post-image
ARIA+22.03%
  • 2
  • 2
$UNI ‌
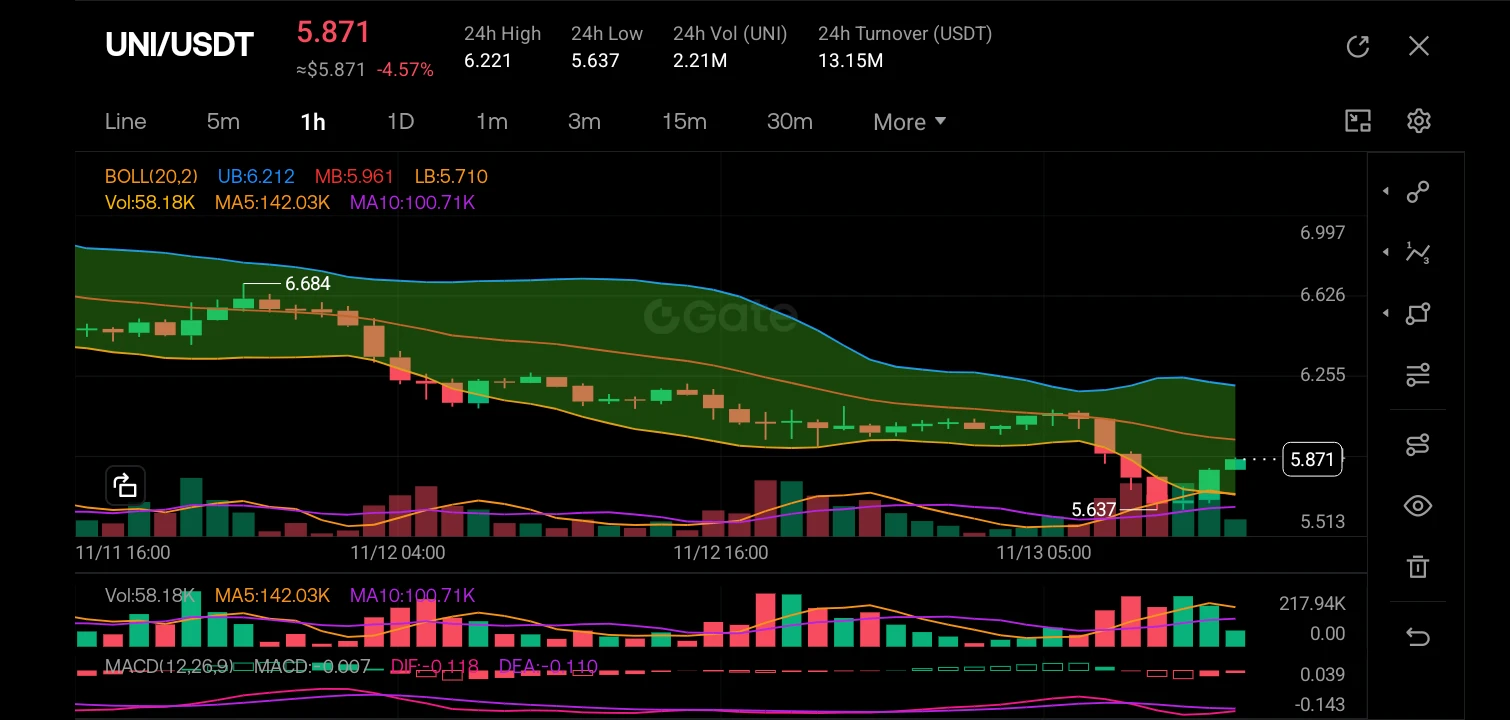
The market structure has shifted from a clear downtrend to a potential consolidation phase. After a sustained sell-off from the 6.68 high, price established a local bottom at 5.637 and has begun printing higher lows with a series of consecutive green candles, indicating that bearish momentum is waning and buyers are stepping in to defend the 5.60-5.70 zone.

The current price action (5.871) is pressing against the middle Bollinger Band (MB: 5.961) after bouncing off the lower band (LB: 5.710). Volume is slightly declining on the bounce, but the MACD is showing a bullish convergence wit
post-image
UNI+3.05%
  • 1
  • 2
$PEPE ‌
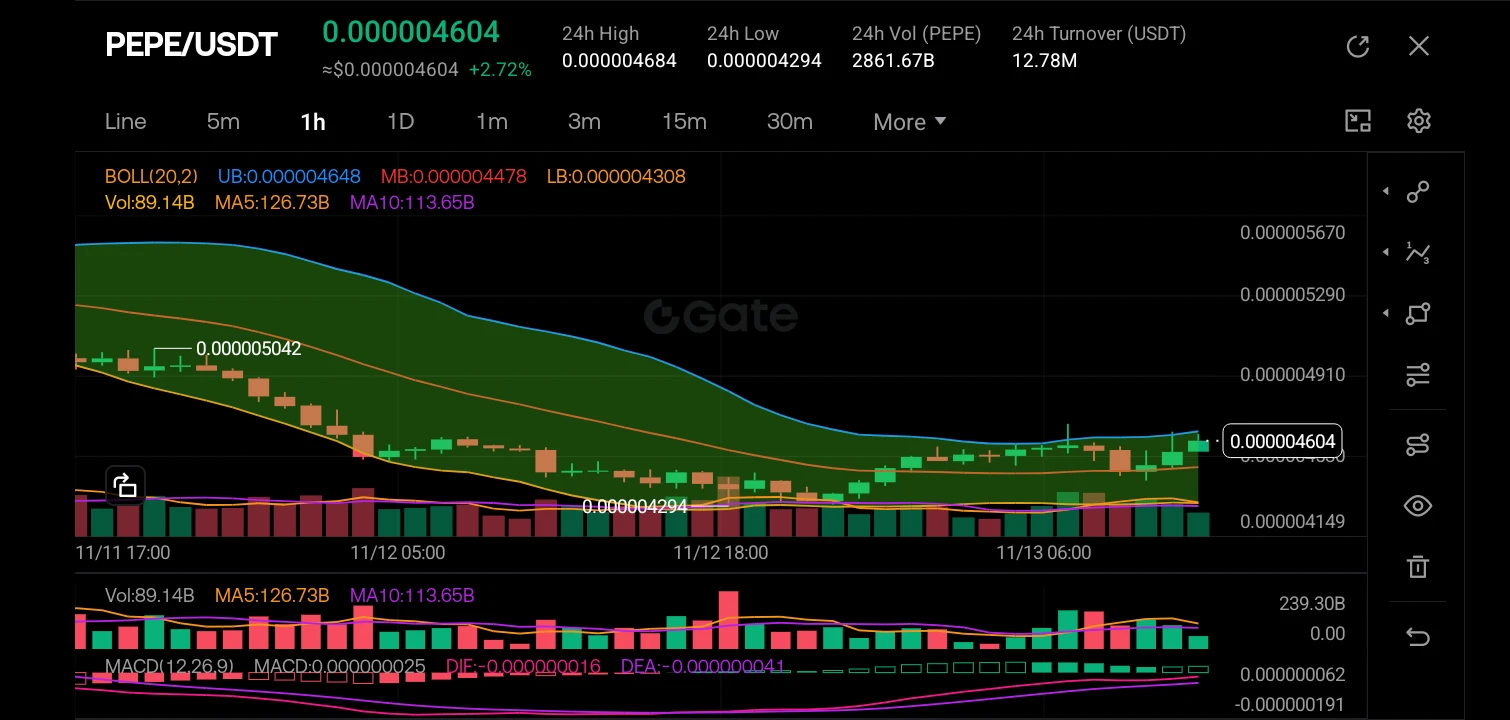
The market structure has recently shifted from a sustained downtrend to a short-term consolidation and potential reversal phase. After a steep drop, the price bottomed out around the 0.000004294 level and has been forming a rounded base, pushing back up to the current price of 0.000004604. The K-line analysis shows a series of higher lows forming, and the price has successfully broken above the middle Bollinger Band (MB: 0.000004478), which is now acting as dynamic support. The Bollinger Bands are also beginning to narrow slightly, indicating a decrease in volatility and a potential s
post-image
PEPE+0.97%
  • 2
  • 2
#JensenHuangResigns

🔷️Market Shocker: Jensen Huang Resigns as NVIDIA CEO, Sparking AI Sector Uncertainty

In a stunning and unexpected turn of events, Jensen Huang has resigned as CEO and stepped down from the board of directors of NVIDIA, sending shockwaves through the global financial and technology sectors.

The announcement, which rapidly climbed to the number one trending topic on social media platforms like Gate Square with over 500,000 views, has left investors scrambling to assess the future of the world's leading artificial intelligence chipmaker.

🔷️Immediate Market Fallout

The
NVDA-4.49%
AMD+5.86%
  • 3
  • 1
$XRP ‌
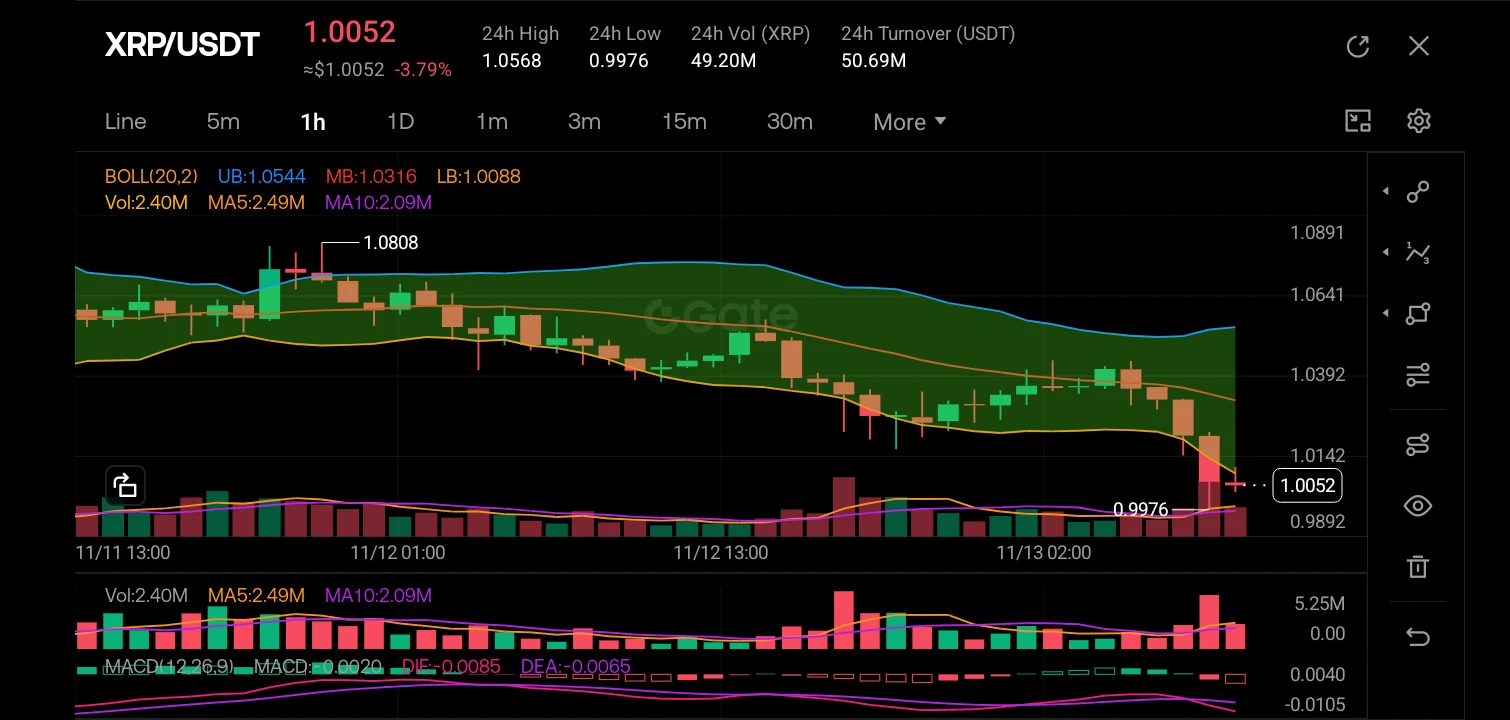
The market structure has clearly shifted bearish, transitioning from a consolidation phase near the 1.0641 level into a sharp breakdown. The K-line analysis shows a series of lower highs and lower lows, with the price currently piercing the lower Bollinger Band (LB: 1.0088) and trading significantly below the middle band (MB: 1.0316). The recent price action is dominated by strong red candles, indicating heavy selling pressure, while the MACD histogram is expanding downward and the signal lines (DIF and DEA) have crossed below the zero line, confirming strong bearish momentum.

The mos
post-image
XRP-1.15%
  • 2
  • 2
$SOL ‌
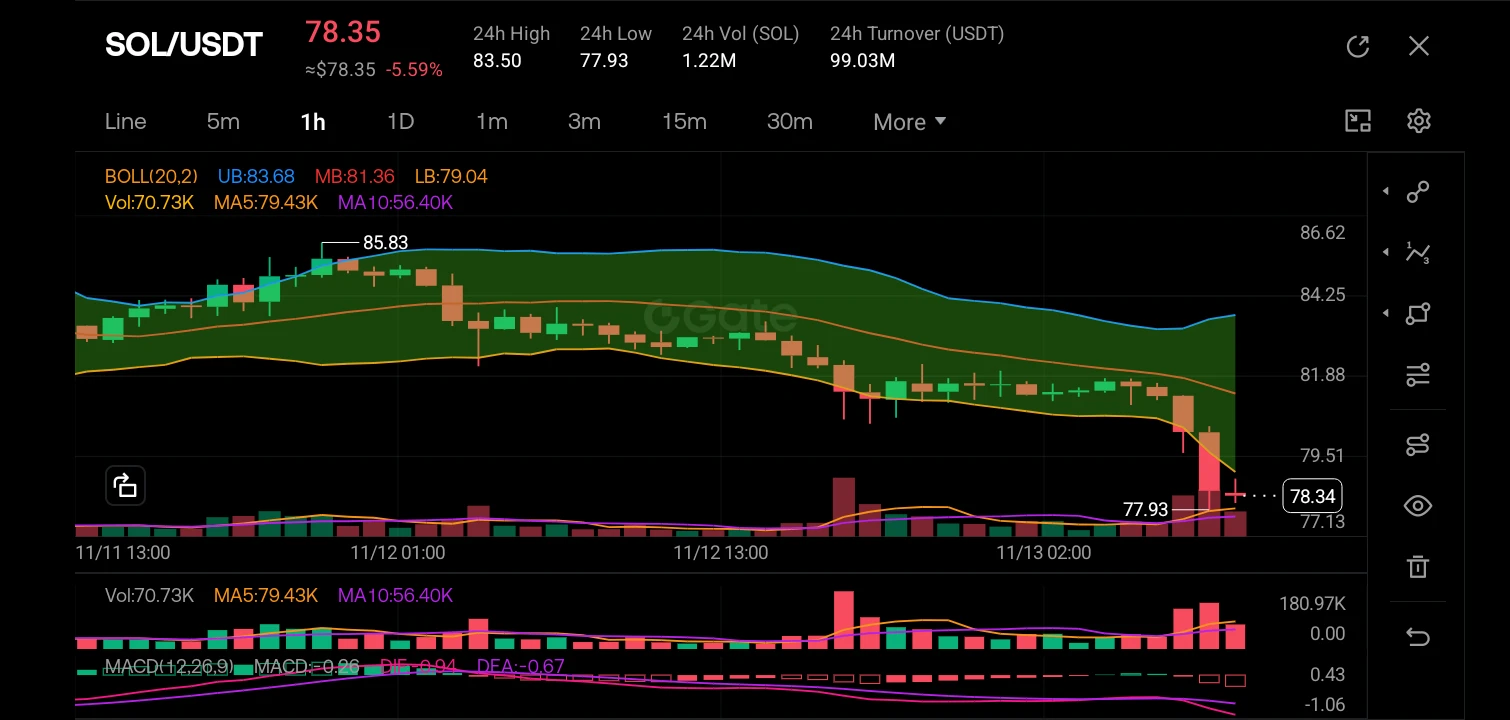
The market structure has shifted decidedly bearish, transitioning from a consolidation phase near the 85.83 high into a sharp impulsive breakdown. The K-line analysis reveals a massive bearish marubozu-style candle that sliced through the lower Bollinger Band (LB: 79.04) and the middle band (MB: 81.36), indicating strong selling pressure and a volatility expansion to the downside. Price is currently hovering at 78.35, well below the moving averages, confirming the bearish momentum.

The most prominent candlestick pattern is the Bearish Engulfing/Long Red Candle that occurred during the
post-image
SOL-0.77%
  • 2
$ETH ‌
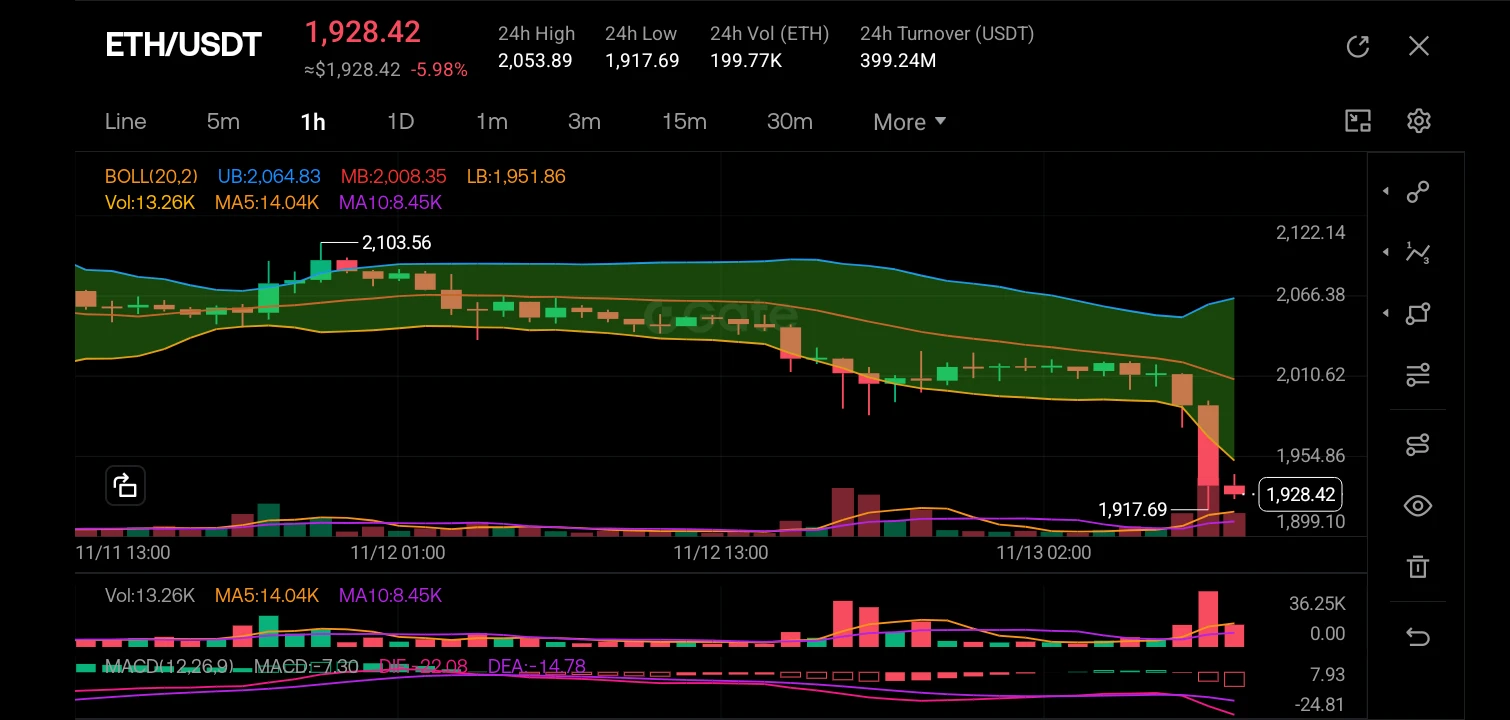
The market structure has shifted decisively bearish; we have broken down from a consolidation phase and sliced through the middle Bollinger Band (MB: 2,008.35) with significant volume. The structure is currently creating a "lower low" formation, with the price plummeting to a local low of 1,917.69, breaking the previous support levels. The 24-hour high of 2,053.89 is now distant resistance, and the trend is firmly downward as price action rides the lower Bollinger Band (LB: 1,951.86) and is currently trading below it at 1,928.42 (-5.98%).

K Line Analysis
Looking at the K-lines, there
post-image
ETH-1.26%
  • 1
  • 2
$GT ‌
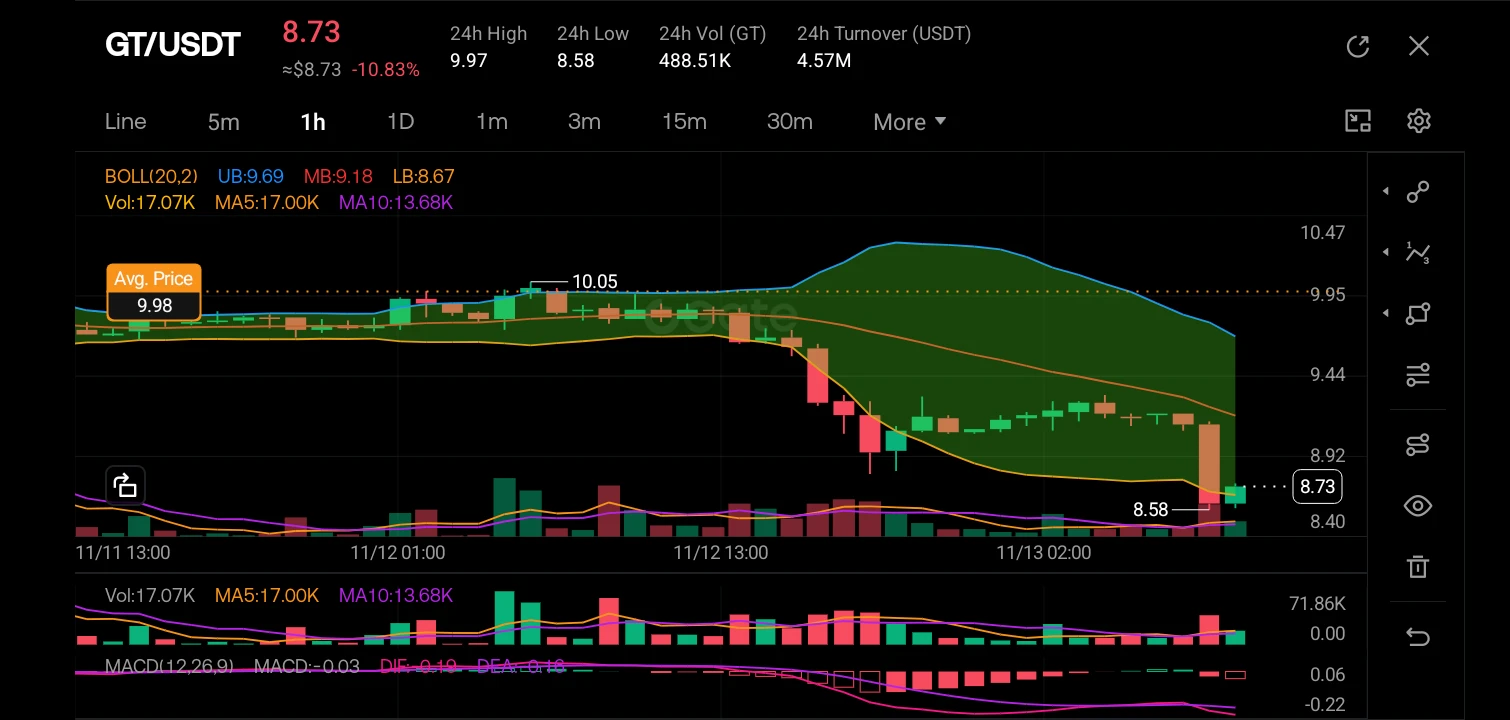
The market structure has clearly shifted from a bullish consolidation phase to a strong bearish downtrend; after failing to sustain above the $9.98 average price and rejecting the $10.05 local top, the price broke down aggressively, creating a sequence of lower highs and lower lows, currently finding temporary support near $8.58.

The recent K-lines are predominantly red, indicating strong selling pressure, with a notable long bearish candle that pierced through the lower Bollinger Band ($8.67), followed by small indecision dojis and a current slight recovery attempt; the price is curre
post-image
GT-2.41%
  • 2
  • 2
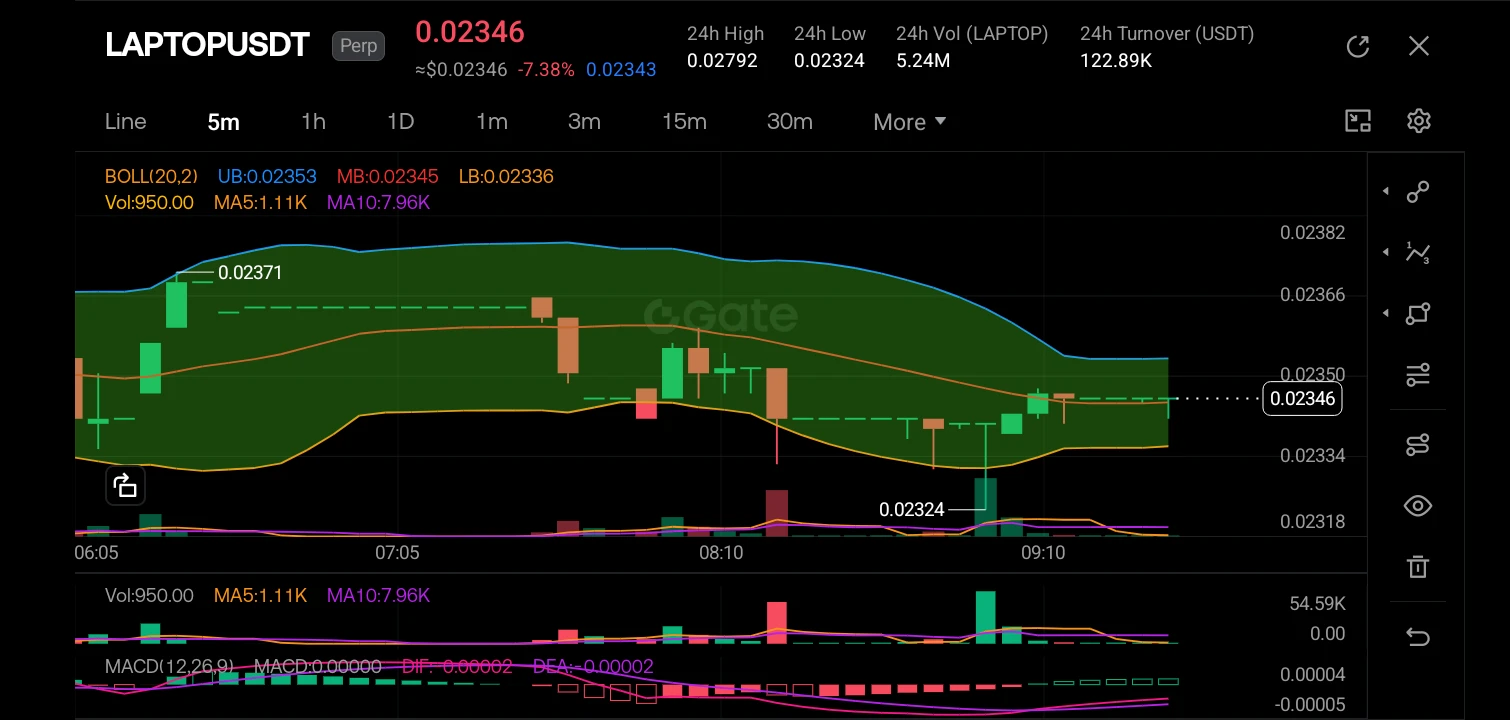
$LAPTOP ‌
The market structure is currently in a short-term bearish downtrend, evidenced by the price action riding the lower Bollinger Band and establishing lower highs and lower lows after failing to hold the 0.02371 level. The K-lines show a recent breakdown from consolidation, though the latest few candles indicate a minor pause or potential exhaustion of the immediate downward momentum near the 0.02324 support level.

The recent price action features a series of small-bodied candles (Doji-like) near the support level, briefly touching the pattern of a potential Bullish Harami or a locali
post-image
LAPTOP-21.95%
  • 2
  • 2
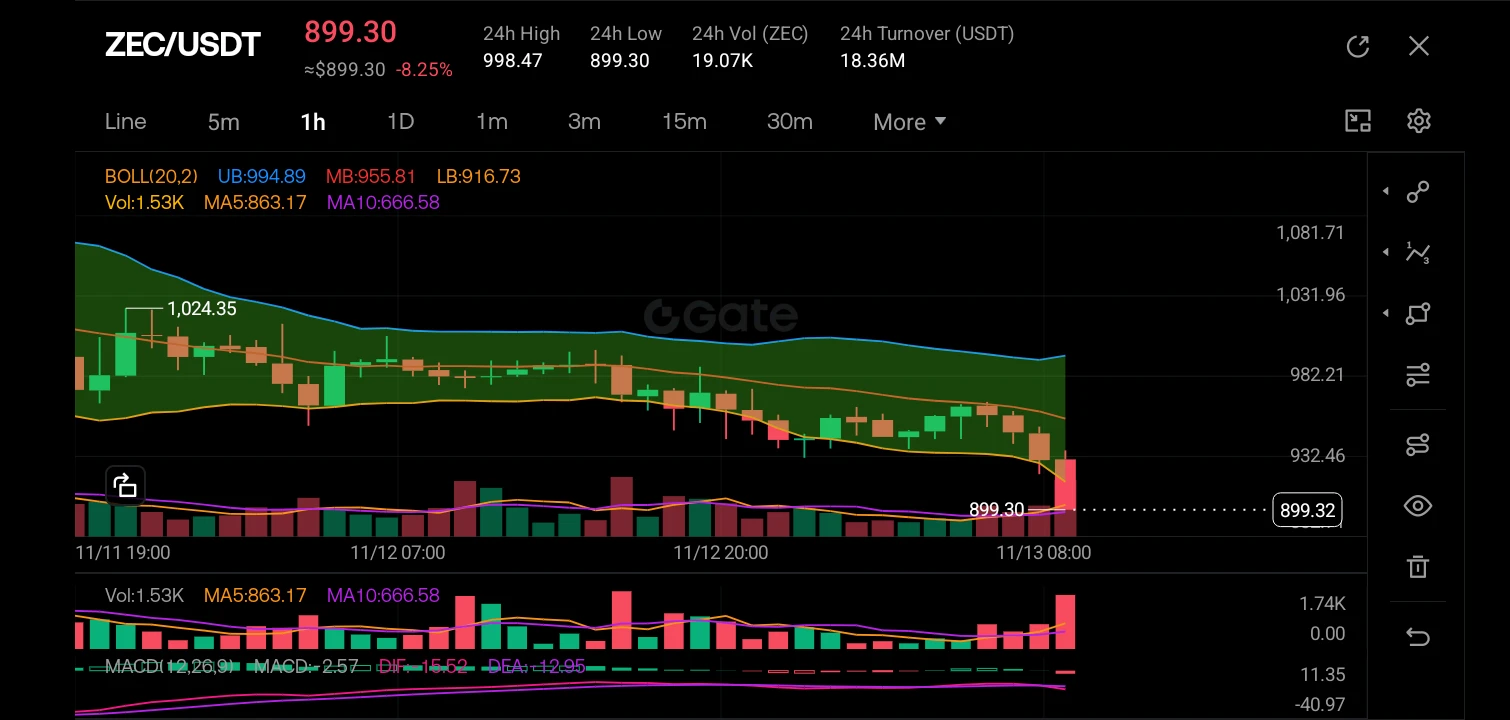
$ZEC ‌
The market structure has transitioned from a consolidation phase into a distinct bearish breakdown. Price was previously ranging between 955 and 1,000, but a massive, high-volume red candle has shattered this support, breaking below the middle Bollinger Band (MB: 955.81) and plummeting toward the lower band (LB: 916.73). The K-line analysis shows a strong downtrend with lower highs and lower lows, and the MACD is deeply bearish (MACD: -2.57), confirming that selling momentum is currently in control.

The most recent price action is defined by a massive, bearish Marubozu or a "dump cand
post-image
ZEC+1.16%
  • 1
  • 2
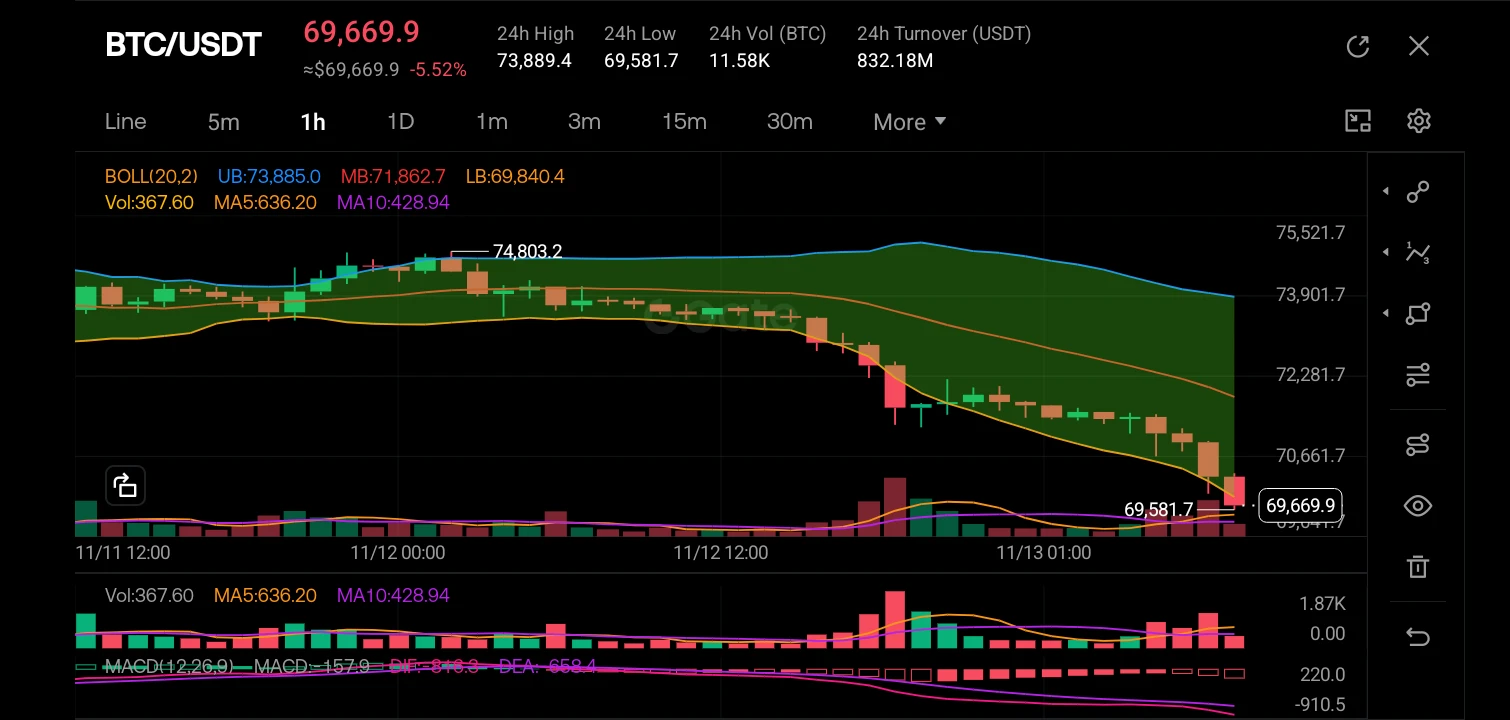
$BTC ‌
The market structure has clearly shifted from a bullish consolidation phase to a decisive bearish breakdown. Price action has violently rejected the upper Bollinger Band and sliced through the middle band (MB: 71,862.7), cascading down to test the lower band (LB: 69,840.4) with a sharp -5.52% drop. The K-line analysis reveals a sequence of strong red candles with very little buying interference, indicating that sellers are in absolute control and the previous support zone around 73,900 has been obliterated.

The most recent price action is printing a strong bearish Marubozu-style candl
post-image
BTC-0.67%
  • 2
Load More