







#BTCETFOutflowsContinue #每周来晒
The Institutional Exit: Deciphering the $1.28 Billion ETF Liquidation at the $75,948 Junction
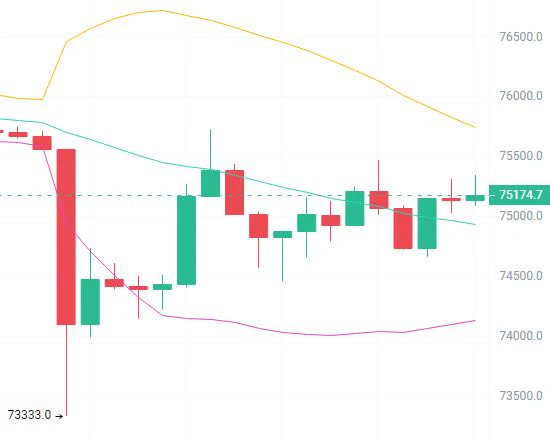
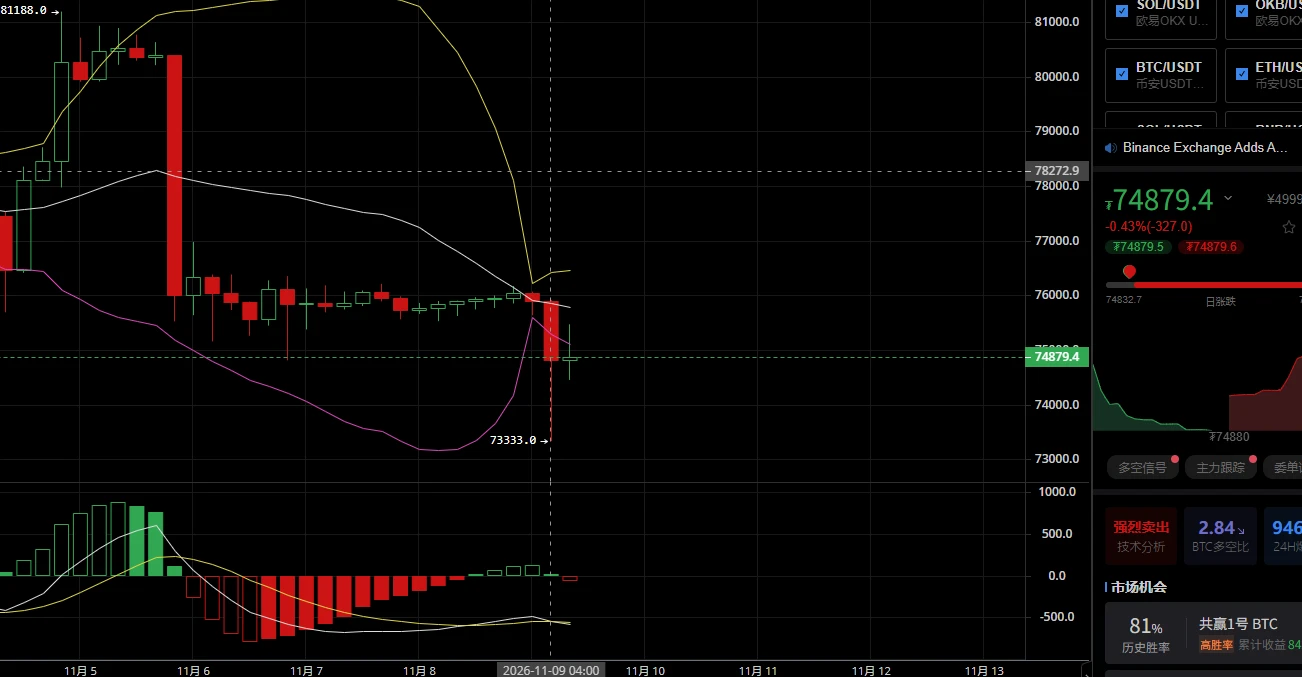
The structural foundation of the digital asset market is facing an unprecedented technical test, driven by a violent shift in traditional financial capital flows. Captured precisely at 9:37 AM PKT on Sunday, November 8, 2026, Bitcoin is trading at the $75,948 zone, demonstrating immense native spot resilience in the face of an institutional mass-exodus. Over the weekly cycle ending November 6, U.S. spot Bitcoin ETFs suffered a devastating $1.28 billion in net withdrawals, marking their worst single week of liquidations since late June.
This aggressive capital flight has officially triggered a historic 2026 Year-to-Date (YTD) reversal, pushing cumulative annual spot ETF net flows to a negative $914.1 million. As traditional brokerage accounts aggressively offload paper Bitcoin, a critical analytical question emerges: Is true institutional demand permanently abandoning the asset class, or are we witnessing a localized, ETF-driven portfolio restructuring before the next macro expansion?
The U.S. Spot ETF Flow Ledger: Tracking the Sovereign Outflows
The data points from the latest fully reported Wall Street trading sessions reveal an intense acceleration of systemic sell pressure, localized across the largest institutional vehicles:
• The Multi-Day Capitulation: The liquidation wave peaked violently during the final stretch of the week. Following a heavy $430.2 million withdrawal on November 5, institutional desks dumped an additional $411.9 million during the November 6 session.
• The BlackRock IBIT Shockwave: In a dramatic shift in fund behavior, BlackRock’s flagship iShares Bitcoin Trust (IBIT) single-handedly accounted for $403 million in net outflows on November 6 representing roughly 88% of the day's gross fund liquidations.
• The Fidelity FBTC Counter-Divergence: Partially offsetting this historic institutional exit, Fidelity’s FBTC recorded a defensive $42.8 million net inflow on November 6, proving that institutional sentiment is no longer a uniform monolith, but highly fragmented.
• The Asset Base Context: Due to this multi-billion-dollar contraction, total net assets held across all U.S. spot ETFs have declined to approximately $95.9 billion, which now represents roughly 6.3% of Bitcoin's aggregate market capitalization.
🔬 The Macro Paradox: Why Liquidate at $75.9K?
The primary operational disconnect puzzling the market is why traditional allocators are aggressively fleeing ETFs while the spot price comfortably maintains its posture near the $75,948 boundary. This behavior is driven by three distinct structural mechanics:
1. Pre-CPI Derisking and Capital Preservation
With the U.S. Bureau of Labor Statistics scheduled to release the highly anticipated October Consumer Price Index (CPI) report on November 10, macro multi-strategy funds are proactively moving to a defensive cash posture. If inflation prints hot, surging Treasury yields and a rising U.S. Dollar Index (DXY) will instantly pressure high-multiplier risk assets, forcing institutional managers to lock in profits near the highs to insulate their year-end performance metrics.
2. Spot Absorption vs. Paper Redemptions
Can direct spot buyers withstand sustained ETF distribution? The answer is visible across exchange netflows. While Wall Street brokerage platforms process automated ETF share redemptions, native crypto-exchange order books are witnessing massive, stealthy whale accumulation. On-chain spot data reveals that physical BTC is being aggressively pulled off exchanges into multi-signature cold storage, creating a robust supply sink that is directly absorbing the paper liquidations originating on legacy exchanges.
3. Derivatives Reset and Leverage Flushes
The intense ETF outflow has initiated a healthy, long-awaited compression within the crypto derivatives complex. Over-leveraged long positions have experienced systematic washouts, driving aggregate Open Interest (OI) down to sustainable levels. Simultaneously, funding rates have fully cooled from overheated zones back to a neutral baseline, setting up a fundamentally cleaner market structure that can safely support the next directional leg without long-liquidation cascade risks.
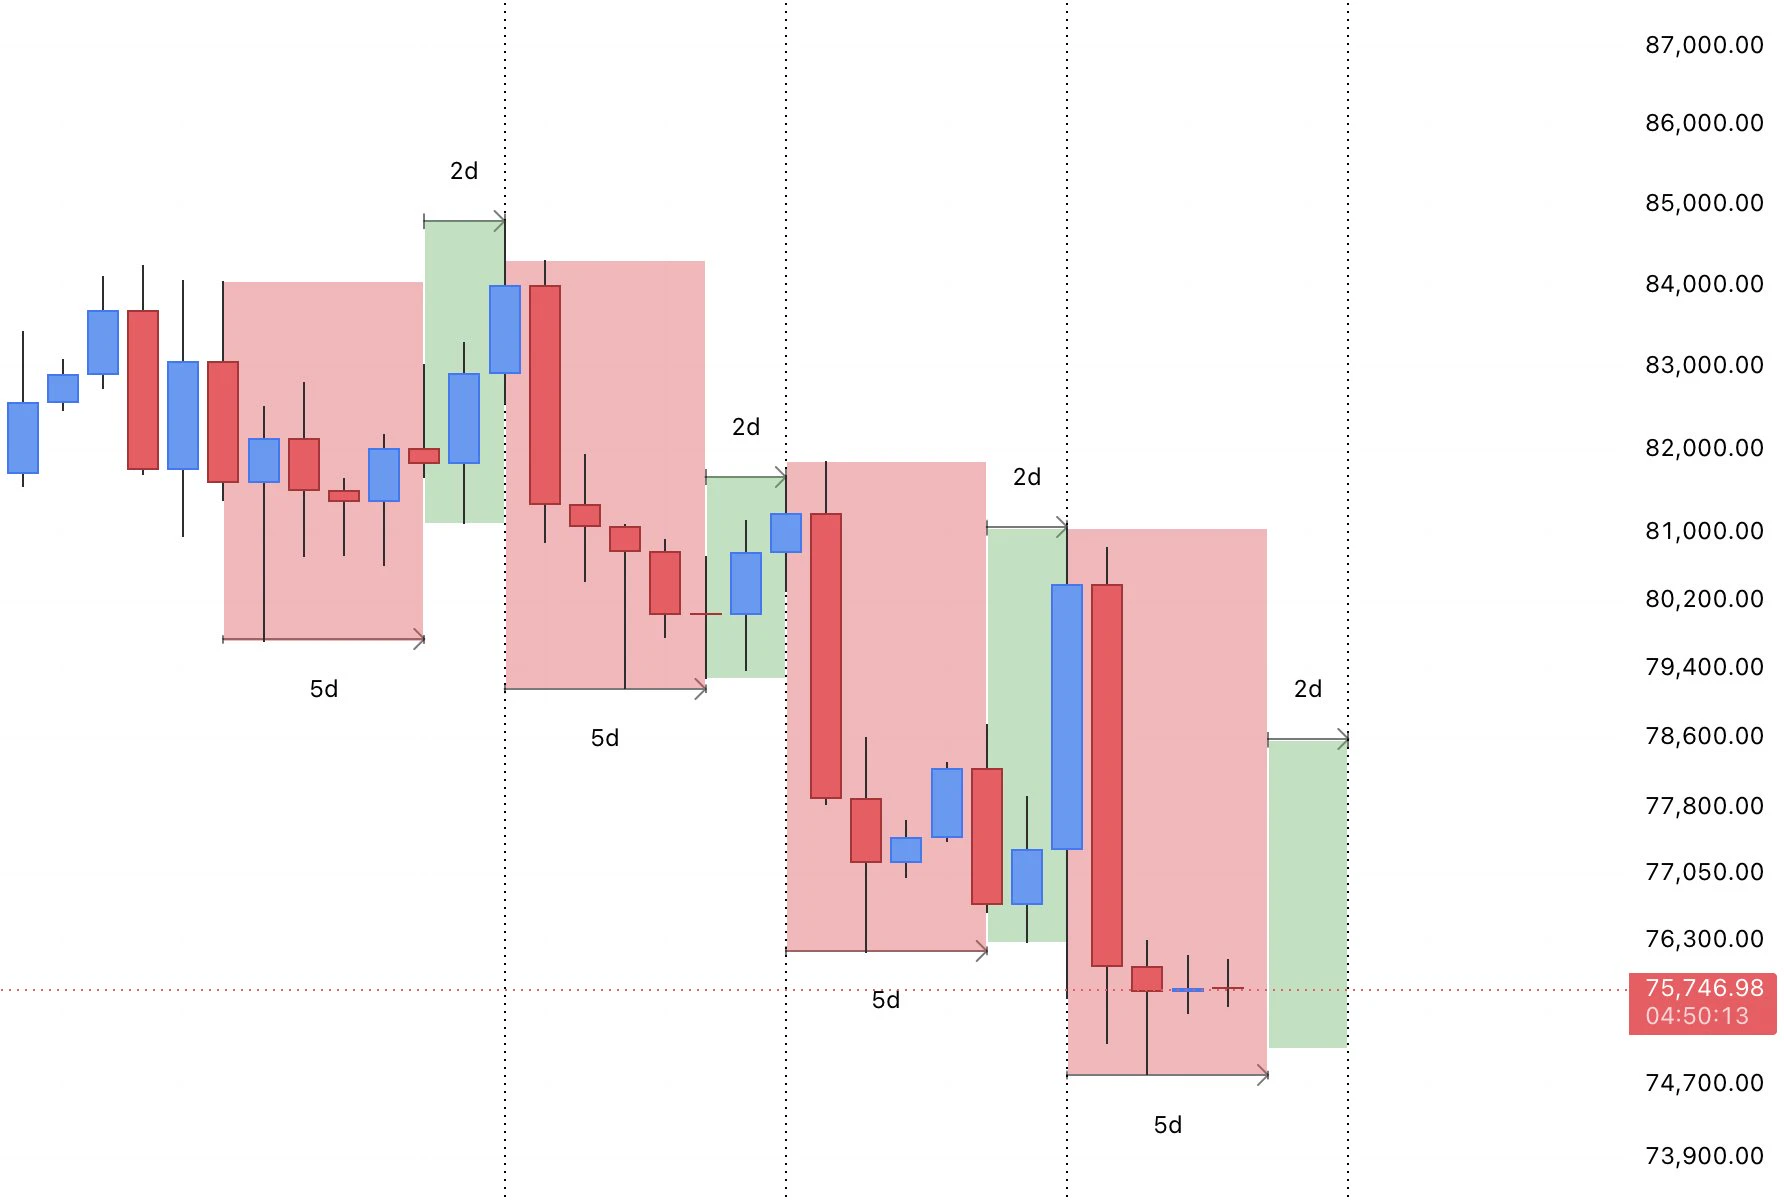
From a technical charting perspective, Bitcoin's macro structural bull market remains fully intact despite the $1.28 billion institutional headwind. The price action is currently bounded by four critical top-tier boundaries:
+-----------------------------------+-----------------------------------+
| Downside Support Targets | Upside Technical Recovery Levels |
+-----------------------------------+-----------------------------------+
| $75,000 (Psychological Node) | $77,100 (Local Bollinger Extension)|
| $72,500 (Institutional Demand) | $80,000 (Macro Price Target) |
+-----------------------------------+-----------------------------------+
• The Immediate Defensive Line ($75,000): This local range serves as our primary structural cushion. It represents a heavy volume profile node and key short-term exponential moving average (EMA) confluences. As long as daily candle closures remain securely above $75k, the immediate trend structure favors the bulls.
• The Ultimate Floor ($72,500): If macro pressures expand post-CPI, a deep flush down to $72,500 represents the ultimate margin of safety matching historical breakout resistance flipped into multi-month institutional demand blocks.
To confidently confirm that this correction has exhausted its selling pressure, my trading desk is tracking a specific dual-signal framework: We require a minimum of two consecutive sessions of positive net aggregate ETF inflows running parallel to a verified daily spot close above the $77,100 resistance ceiling. Until this confirmation sequence triggers, executing high-leverage long plays carries significant risk.
• The Strategy: Maintain a highly disciplined allocation model. Utilize the current consolidation near $75,948 to scale into un-leveraged spot positions. Treat any potential liquidity dips into the $75,000 to $72,500 zones as high-conviction buying opportunities, while allowing the paper-driven ETF rebalancing cycle to completely clear the field before entering directional futures contracts.
Bitcoin is demonstrating magnificent native strength, holding firm at $75,948 despite facing a staggering $1.28 billion weekly spot ETF outflow that has pushed 2026 institutional demand negative. While mainstream headlines focus on BlackRock's unprecedented $403 million IBIT exit on November 6, institutional smart money is tracking the aggressive on-chain spot absorption that is quietly neutralizing this legacy paper supply.
With the vital $75,000 support zone holding strong ahead of the November 10 CPI report, this structural consolidation is a prime accumulation window for disciplined spot investors rather than a trend invalidation. Ignore the retail panic, protect your capital parameters, and let the traditional financial rebalancing run its course.
#WCTCS9
#USCPIDataIncoming
The Institutional Exit: Deciphering the $1.28 Billion ETF Liquidation at the $75,948 Junction
The structural foundation of the digital asset market is facing an unprecedented technical test, driven by a violent shift in traditional financial capital flows. Captured precisely at 9:37 AM PKT on Sunday, November 8, 2026, Bitcoin is trading at the $75,948 zone, demonstrating immense native spot resilience in the face of an institutional mass-exodus. Over the weekly cycle ending November 6, U.S. spot Bitcoin ETFs suffered a devastating $1.28 billion in net withdrawals, marking their worst single week of liquidations since late June.
This aggressive capital flight has officially triggered a historic 2026 Year-to-Date (YTD) reversal, pushing cumulative annual spot ETF net flows to a negative $914.1 million. As traditional brokerage accounts aggressively offload paper Bitcoin, a critical analytical question emerges: Is true institutional demand permanently abandoning the asset class, or are we witnessing a localized, ETF-driven portfolio restructuring before the next macro expansion?
The U.S. Spot ETF Flow Ledger: Tracking the Sovereign Outflows
The data points from the latest fully reported Wall Street trading sessions reveal an intense acceleration of systemic sell pressure, localized across the largest institutional vehicles:
• The Multi-Day Capitulation: The liquidation wave peaked violently during the final stretch of the week. Following a heavy $430.2 million withdrawal on November 5, institutional desks dumped an additional $411.9 million during the November 6 session.
• The BlackRock IBIT Shockwave: In a dramatic shift in fund behavior, BlackRock’s flagship iShares Bitcoin Trust (IBIT) single-handedly accounted for $403 million in net outflows on November 6 representing roughly 88% of the day's gross fund liquidations.
• The Fidelity FBTC Counter-Divergence: Partially offsetting this historic institutional exit, Fidelity’s FBTC recorded a defensive $42.8 million net inflow on November 6, proving that institutional sentiment is no longer a uniform monolith, but highly fragmented.
• The Asset Base Context: Due to this multi-billion-dollar contraction, total net assets held across all U.S. spot ETFs have declined to approximately $95.9 billion, which now represents roughly 6.3% of Bitcoin's aggregate market capitalization.
🔬 The Macro Paradox: Why Liquidate at $75.9K?
The primary operational disconnect puzzling the market is why traditional allocators are aggressively fleeing ETFs while the spot price comfortably maintains its posture near the $75,948 boundary. This behavior is driven by three distinct structural mechanics:
1. Pre-CPI Derisking and Capital Preservation
With the U.S. Bureau of Labor Statistics scheduled to release the highly anticipated October Consumer Price Index (CPI) report on November 10, macro multi-strategy funds are proactively moving to a defensive cash posture. If inflation prints hot, surging Treasury yields and a rising U.S. Dollar Index (DXY) will instantly pressure high-multiplier risk assets, forcing institutional managers to lock in profits near the highs to insulate their year-end performance metrics.
2. Spot Absorption vs. Paper Redemptions
Can direct spot buyers withstand sustained ETF distribution? The answer is visible across exchange netflows. While Wall Street brokerage platforms process automated ETF share redemptions, native crypto-exchange order books are witnessing massive, stealthy whale accumulation. On-chain spot data reveals that physical BTC is being aggressively pulled off exchanges into multi-signature cold storage, creating a robust supply sink that is directly absorbing the paper liquidations originating on legacy exchanges.
3. Derivatives Reset and Leverage Flushes
The intense ETF outflow has initiated a healthy, long-awaited compression within the crypto derivatives complex. Over-leveraged long positions have experienced systematic washouts, driving aggregate Open Interest (OI) down to sustainable levels. Simultaneously, funding rates have fully cooled from overheated zones back to a neutral baseline, setting up a fundamentally cleaner market structure that can safely support the next directional leg without long-liquidation cascade risks.
From a technical charting perspective, Bitcoin's macro structural bull market remains fully intact despite the $1.28 billion institutional headwind. The price action is currently bounded by four critical top-tier boundaries:
+-----------------------------------+-----------------------------------+
| Downside Support Targets | Upside Technical Recovery Levels |
+-----------------------------------+-----------------------------------+
| $75,000 (Psychological Node) | $77,100 (Local Bollinger Extension)|
| $72,500 (Institutional Demand) | $80,000 (Macro Price Target) |
+-----------------------------------+-----------------------------------+
• The Immediate Defensive Line ($75,000): This local range serves as our primary structural cushion. It represents a heavy volume profile node and key short-term exponential moving average (EMA) confluences. As long as daily candle closures remain securely above $75k, the immediate trend structure favors the bulls.
• The Ultimate Floor ($72,500): If macro pressures expand post-CPI, a deep flush down to $72,500 represents the ultimate margin of safety matching historical breakout resistance flipped into multi-month institutional demand blocks.
To confidently confirm that this correction has exhausted its selling pressure, my trading desk is tracking a specific dual-signal framework: We require a minimum of two consecutive sessions of positive net aggregate ETF inflows running parallel to a verified daily spot close above the $77,100 resistance ceiling. Until this confirmation sequence triggers, executing high-leverage long plays carries significant risk.
• The Strategy: Maintain a highly disciplined allocation model. Utilize the current consolidation near $75,948 to scale into un-leveraged spot positions. Treat any potential liquidity dips into the $75,000 to $72,500 zones as high-conviction buying opportunities, while allowing the paper-driven ETF rebalancing cycle to completely clear the field before entering directional futures contracts.
Bitcoin is demonstrating magnificent native strength, holding firm at $75,948 despite facing a staggering $1.28 billion weekly spot ETF outflow that has pushed 2026 institutional demand negative. While mainstream headlines focus on BlackRock's unprecedented $403 million IBIT exit on November 6, institutional smart money is tracking the aggressive on-chain spot absorption that is quietly neutralizing this legacy paper supply.
With the vital $75,000 support zone holding strong ahead of the November 10 CPI report, this structural consolidation is a prime accumulation window for disciplined spot investors rather than a trend invalidation. Ignore the retail panic, protect your capital parameters, and let the traditional financial rebalancing run its course.
#WCTCS9
#USCPIDataIncoming