
Square
Following
Hot
News
Profile
Share your thoughts
placeholder
Article
Holy shit!!!!!
Woke up in the middle of the night
My phone was burning hot
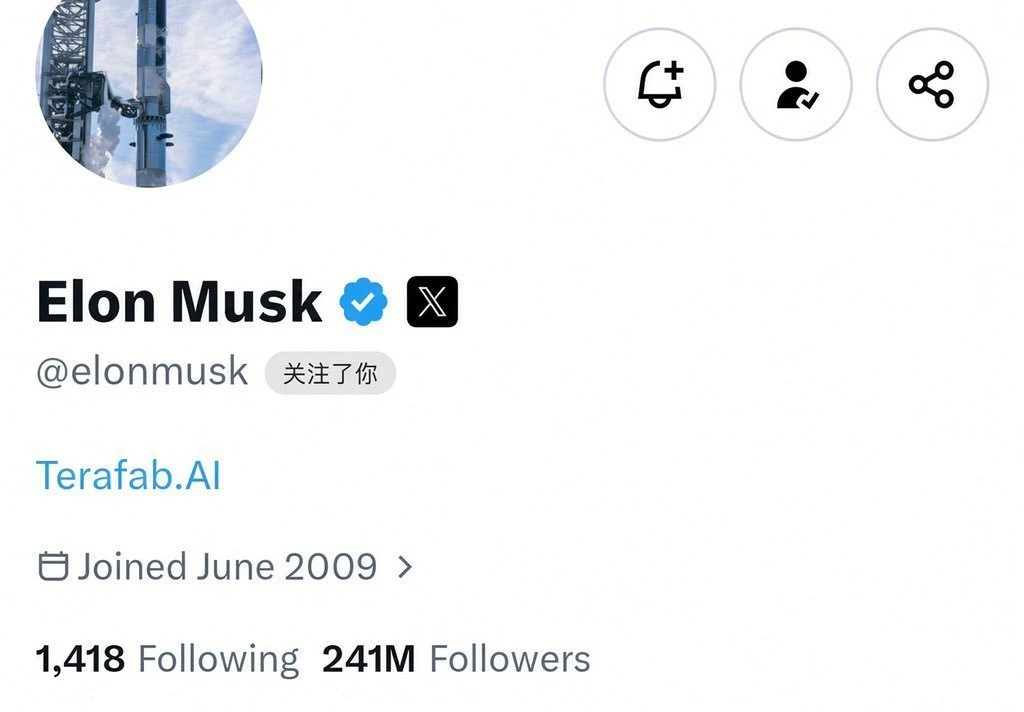
Turns out Elon Musk followed me
Is he trying to ride my clout?😉
post-image
$ESPORTS The rally has reached new resistance zones: 0.021 0.023 0.028
post-image
ESPORTS-5.30%
Trenches
ZIG
Z
bade
b
ZIG
0x8c...1145
Market Cap
$.
Change
.
24h Vol
$.
Holders
.
KIM
K
bade
b
KIM
8pjf...pump
Market Cap
$.
Change
.
24h Vol
$.
Holders
.
Anakin
A
bade
b
Anakin
Exxz...pump
Market Cap
$.
Change
.
24h Vol
$.
Holders
.
IDOL
I
bade
b
IDOL
0x3b...ab07
Market Cap
$.
Change
.
24h Vol
$.
Holders
.
BTC
B
bade
b
BTC
C5xp...pump
Market Cap
$.
Change
.
24h Vol
$.
Holders
.
Forgot I painted this
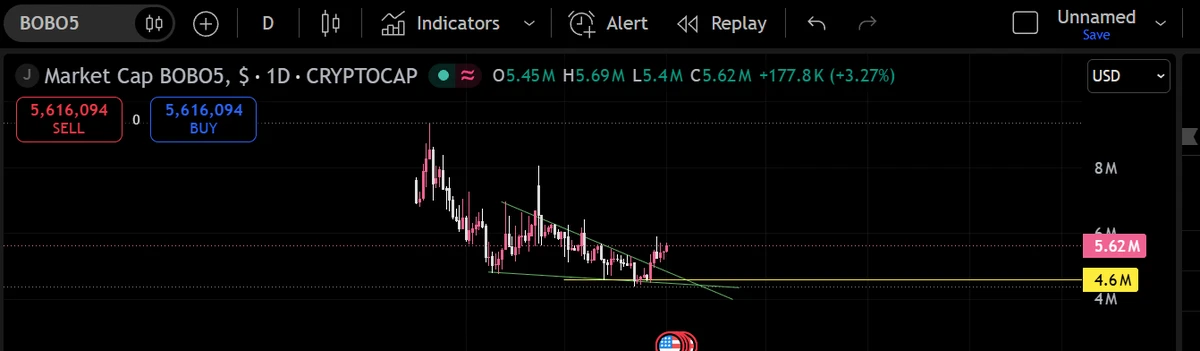
$BOBO update
post-image
$Q Down 13.94% in 24 hours, currently at 0.0285, with a low of 0.0277—I bet it won’t close back above 0.0305 tomorrow. Posting this as proof; save the screenshot.
The 54.6M in volume on this move is panic selling getting shaken out, not the project collapsing. My strategy is simple: place two buy orders around the current price of 0.0285, with 30% of my position at 0.0282 and another 30% at 0.0278. If it breaks below 0.0275, cut the whole position and stop out. Take profits in batches at 0.0308–0.0312, and leave the remaining 40% in cash. My coin selection criteria are simple: only coins down
  • 8
#BTC大跌
Here we go ! Bitcoin again over $78k dollar this is really good come back but it has to continue, there will be fake rises then big falls ! Always do your own research !
post-image
BTC-0.67%
#ShareWeekly STRC: Stability Near $100, but Is the Market Confirming the Next Move?
A Different Kind of Market Setup
STRC is not a conventional growth stock, and that distinction matters when reading its chart. Strategy’s Stretch preferred stock has a $100 stated amount and a variable dividend structure designed to encourage trading around that level. The real technical test is whether demand can keep the market price close to $100 without weakening liquidity.
My reference quote is $99.43, while the latest verified regular-session close for October 30 was $99.13. The difference matters: I am u
post-image
STRC-0.90%
BTC-0.67%
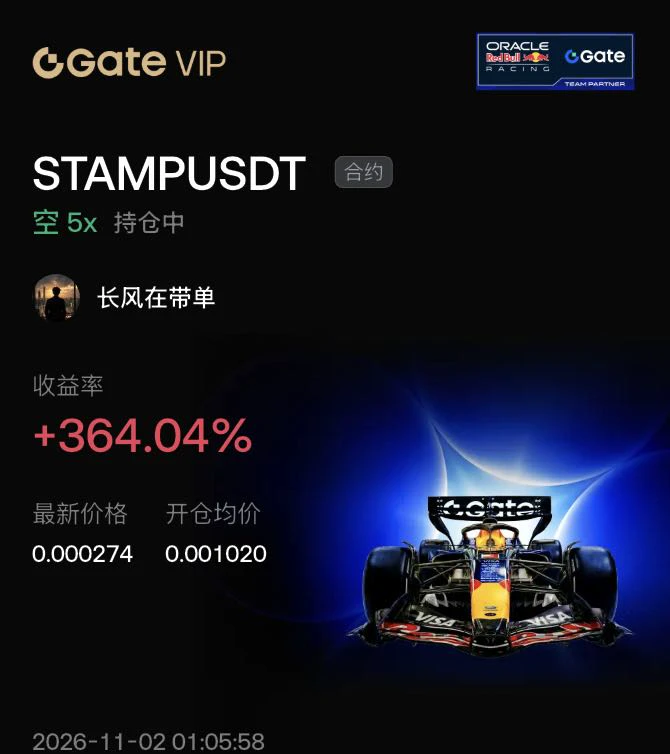
Small-cap coin surges are most likely to trap traders. This rally in $STAMP is a typical short-term speculative move driven by capital flows.
Centered on the concept of mapping Zcash privacy assets, it rode the hype to a rapid rally early on, but the project’s progress has fallen short of expectations, with no sustained ecosystem output. The hype came and went quickly. These small-cap coins rely heavily on speculative capital, and once the trading frenzy ends, profit-takers will rush for the exits. I opened a short position around 0.00102, anticipating a pullback as the hype faded.
Looking at
post-image
STAMP+52.30%
AKE+6.39%
  • 1
3886 breaks below, confirming a quarterly-chart Wave 4 correction and the start of a medium-term downtrend.
Correction duration: 42–52 months (at the earliest, around August 2029, we can look back)
Note:
Medium-term refers to the monthly-chart trend. (The monthly chart has entered a bear-market correction.)
The quarterly chart represents a mid-cycle pause in the long-term trend. (A pullback and shakeout.)
The yearly chart represents the supercycle trend. (The supercycle bull market is not over. Even if prices fall to around 2300 in the future, it would still not affect the quarterly Wave 5 tar
XAUUSD-3.63%
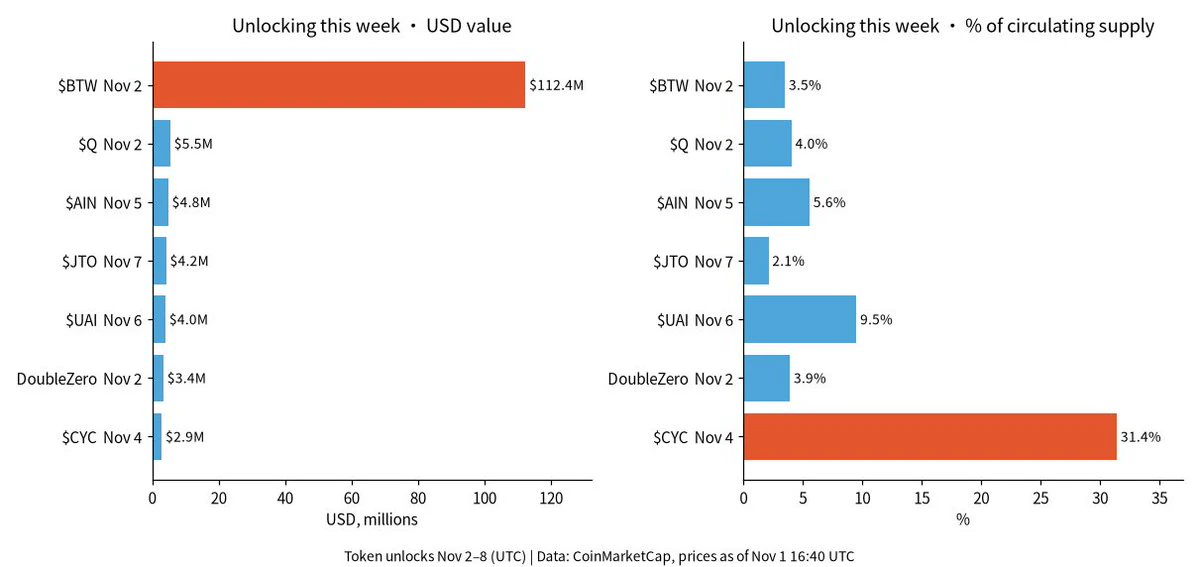
~$135M in big token unlocks this week. $BTW alone is ~82% of it.
Token unlocks · Nov 2–8
Times in UTC. Dollar figures = USD value at Nov 1 17:18 UTC prices.
Monday cluster:
$BTW · Nov 2, 08:00
101.6M tokens (~$110.3M) · 3.5% of circulating supply
Daily volume is only ~$4.4M. Thin books. Stay out of the way.
$Q · Nov 2, 00:00
190.3M tokens (~$5.5M) · 4.0% of circulating supply
~$32M daily volume. Manageable.
DoubleZero (2Z) · Nov 2, 13:00
135.7M tokens (~$3.4M) · 3.9% of circulating supply
Small, but ~70% of a day's volume. Don't chase.
Midweek → weekend:
$CYC · Nov 4, 11:00
48.3M tokens (~$2.9
post-image
BTW-7.42%
2Z-3.17%
AIN+3.85%
UAI-7.58%
$AIN There’s some truth to it, kind of an AKE vibe. You can say there are no opportunities in crypto, but every so often a 10x opportunity comes along—it just depends on whether you dare to hold. Saying there are no opportunities is a mindset problem: you can’t hold on, and high-frequency long/short trading wipes out your principal.🥶
AIN+3.85%
AKE+6.07%
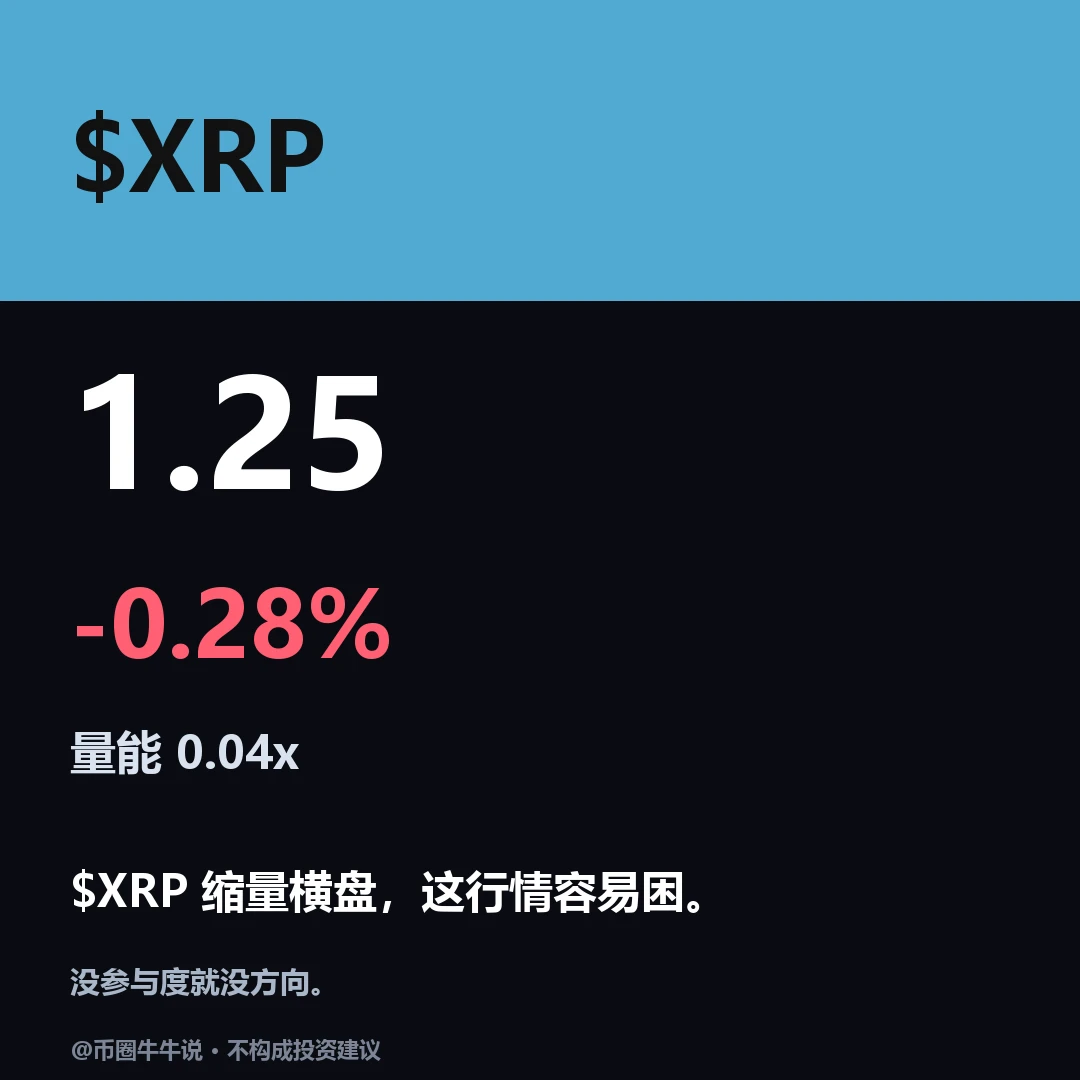
Weak, but the credibility of this decline is not particularly high. $XRP is currently at 1.2504, near the intraday low of 1.246. The hourly and four-hour trends are both weak, short-term RSI is neutral to weak, and the price remains below the hourly moving average; however, trading volume is less than a quarter of average, indicating that the decline happened, but there has been no sign of more active buying support. If selling pressure were truly strong enough to persist, why would volume instead shrink to less than a quarter of average? A break below the intraday low would confirm weakness;
post-image
XRP-1.15%
Looks like they went to the hospital just an hour after receiving the comment. They really take advice to heart.
$NEAR $NEAR long hit TP3 at 4.4472 ✅Process: - Entry range 4.3331–4.3444, filled immediately after posting- TP1 at 4.3794 hit about 15 minutes after entry- TP2 at 4.4065 hit about 15 minutes after entry- TP3 at 4.4472 hit about 30 minutes after entry- Maximum adverse movement was 0.13%; stop-loss at 4.271. The risk management was simple: hold 4.33, target 4.45, exit below 4.27. Setting the exit level before entering made this trade execute cleanly. Not financial advice. Trade at your own risk.
post-image
NEAR+1.17%
[New Streamer] Market Prediction
live-cover
LIVE1,612
Live trading - Analysis crypto coin
live-cover
LIVE2,191
  • 1
#AIN I got stopped out, and then it dropped. So painful
post-image
AIN+3.85%
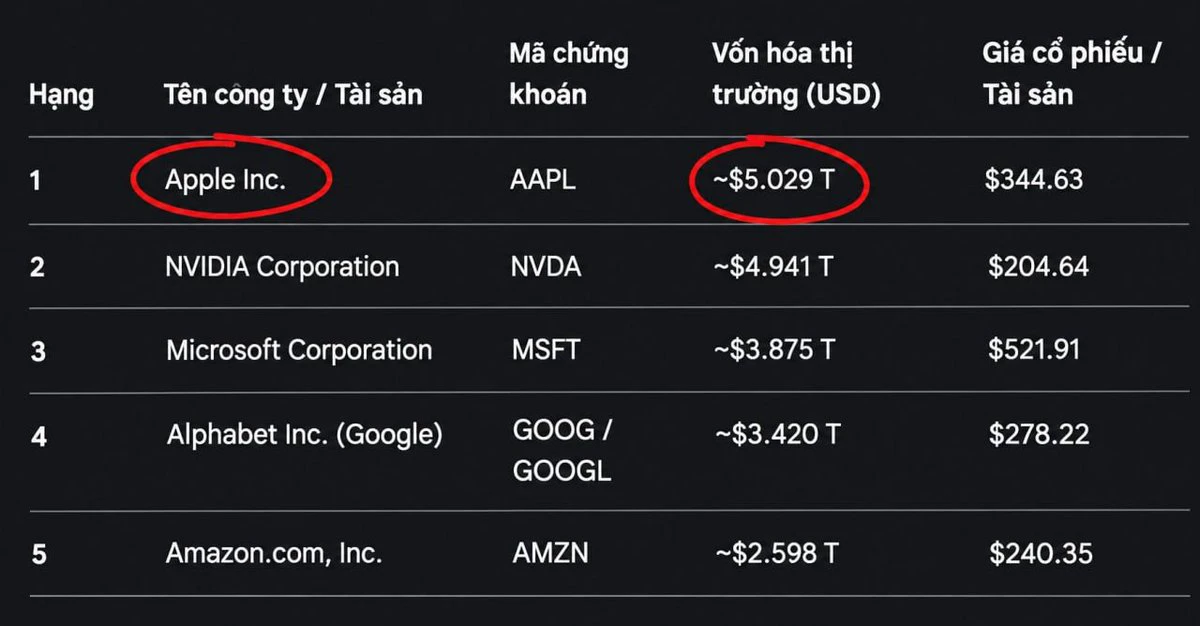
Apple overtakes Nvidia to return to the top spot as the world’s most valuable company
Sometimes not chasing AI is an advantage
post-image
AAPL-1.18%
NVDA-4.16%
#ETHPullsBack
$ETH ‌#ShareWeekly — Ethereum (ETH): Seven Days of Volatility, a Sharp Sell-Off and the Fight to Recover $2,300
**From Monday’s Opening to Sunday’s Market Position**
Ethereum’s weekly performance tells a story of recovery attempts, aggressive selling and an unfinished battle between buyers and sellers. ETH opened Monday, October 26, around $2,326.58. By Sunday, November 1, the supplied latest price stood at $2,271.43, representing a decline of approximately 2.37% from the weekly opening.
The more important development was the journey between those two prices. ETH reached $2,389
post-image
ETH-1.26%
Referral code:VLEQXQHZVA
Load More

Join 40 M users in our growing community

⚡️ Join 40 M users in the crypto craze discussion

💬 Engage with your favorite top creators

👍 See what interests you

Trending Topics

BTC大跌

500.89k Views39.89k Discussing

$BTC briefly fell below $77,000 and remains under pressure around the $77K zone, with its 24-hour decline still above 4%. With risk appetite weakening and Fed uncertainty rising, where is the next key support after losing $80K?

IntelBeatsEarningsButStockPlunges

46.75k Views1.07k Discussing

StrategySTRCNears100ParValue

54.99k Views4.22k Discussing

View More