Technical Outlook: SOL Breaking Range Support — Bears Regaining Control
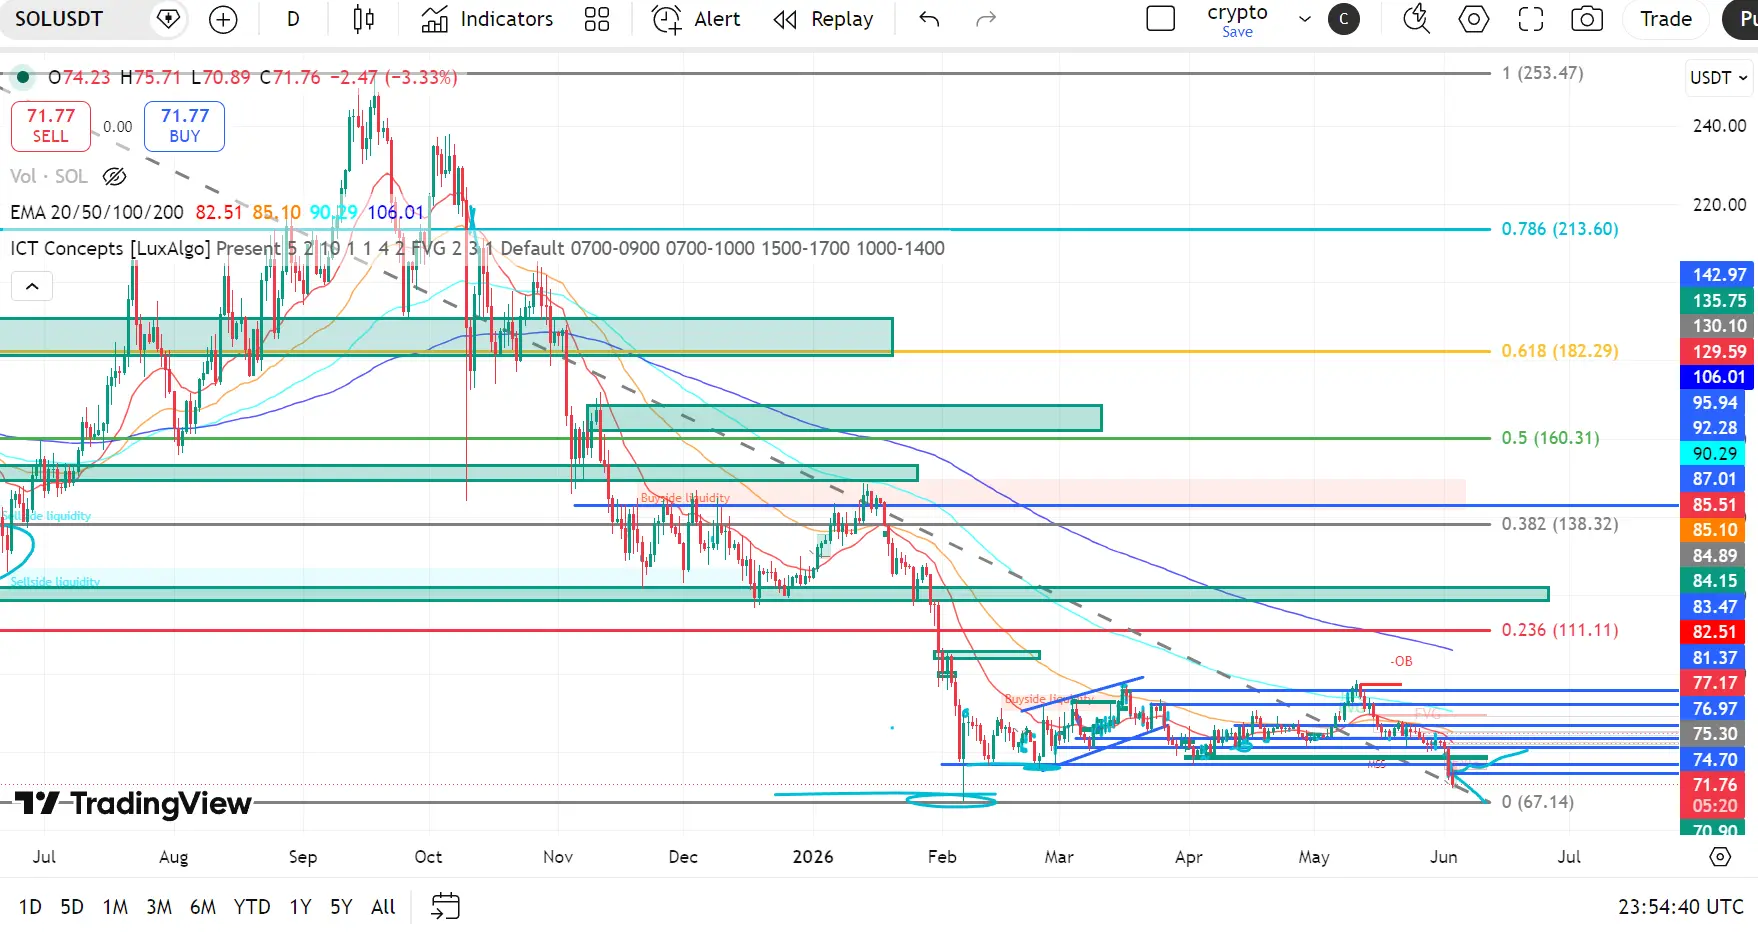
Solana has broken below its multi-week consolidation range after failing to hold the critical $74–$75 support area. The breakdown follows a series of lower highs beneath descending resistance, signaling renewed bearish momentum as sellers push price toward the February lows.
While price is approaching a major demand zone, the overall structure remains bearish until SOL can reclaim the lost range support.
📈 EMA Structure (Bearish Across All Timeframes)
20 EMA: $82.52
50 EMA: $85.10
100 EMA: $90.29
200 EMA: $106.01
Price trading below all major EMAs ❌
20 EMA acting as immediate dynamic resistance
50 & 100 EMA continue capping recovery attempts
200 EMA remains the defining macro resistance
👉 SOL remains firmly bearish while trading beneath the entire EMA stack.
📐 Fibonacci & Structure
Price remains below the 0.236 Fibonacci level at $111.11
Recent range support near $74–$75 has broken down
Lower highs and lower lows continue forming
Descending trendline remains intact
👉 Any relief rally could target:
$74.70 → Broken range support
$76.97 → Local resistance
$82.50 → 20 EMA resistance
$90.30 → 100 EMA resistance
👉 Failure to stabilize could expose:
$70.90 → Current support zone
$67.14 → Major macro support (0 Fib)
Potential liquidity sweep beneath February lows
🧠 ICT / Smart Money View
Recent breakdown swept sell-side liquidity beneath range support
Market structure shift remains bearish
Previous consolidation now appears to have acted as redistribution
No significant bullish displacement has followed the liquidity grab
Sellers continue defending every recovery attempt
👉 Current price action favors downside continuation unless the broken range is reclaimed.
📉 RSI Momentum
RSI (14): 23.1
RSI has entered deeply oversold territory
Momentum remains strongly bearish
No confirmed bullish divergence visible
👉 Oversold conditions may trigger a short-term bounce, but trend reversal signals remain absent.
📊 Key Levels
🔴 Resistance
$74.70 → Immediate resistance
$76.97 → Local resistance
$82.52 → 20 EMA resistance
$85.10 → 50 EMA resistance
🟢 Support
$70.90 → Current support
$67.14 → Major macro support
Below $67 → Liquidity sweep risk increases
📌 Final Outlook
Solana has lost its key consolidation support and remains under pressure beneath all major EMA and Fibonacci resistance levels.
✅ Reclaim & hold above $74.70–$76.97 → opens path toward $82.5 → $85
❌ Continued rejection below broken support → increases probability of a move toward $70.9 → $67.1
👉 Overall structure remains bearish, with sellers maintaining control after the range breakdown. The $67–$71 region is now the most important support zone for bulls to defend, while $74–$77 becomes the key area that must be reclaimed to signal any meaningful recovery.
$SOL
Solana has broken below its multi-week consolidation range after failing to hold the critical $74–$75 support area. The breakdown follows a series of lower highs beneath descending resistance, signaling renewed bearish momentum as sellers push price toward the February lows.
While price is approaching a major demand zone, the overall structure remains bearish until SOL can reclaim the lost range support.
📈 EMA Structure (Bearish Across All Timeframes)
20 EMA: $82.52
50 EMA: $85.10
100 EMA: $90.29
200 EMA: $106.01
Price trading below all major EMAs ❌
20 EMA acting as immediate dynamic resistance
50 & 100 EMA continue capping recovery attempts
200 EMA remains the defining macro resistance
👉 SOL remains firmly bearish while trading beneath the entire EMA stack.
📐 Fibonacci & Structure
Price remains below the 0.236 Fibonacci level at $111.11
Recent range support near $74–$75 has broken down
Lower highs and lower lows continue forming
Descending trendline remains intact
👉 Any relief rally could target:
$74.70 → Broken range support
$76.97 → Local resistance
$82.50 → 20 EMA resistance
$90.30 → 100 EMA resistance
👉 Failure to stabilize could expose:
$70.90 → Current support zone
$67.14 → Major macro support (0 Fib)
Potential liquidity sweep beneath February lows
🧠 ICT / Smart Money View
Recent breakdown swept sell-side liquidity beneath range support
Market structure shift remains bearish
Previous consolidation now appears to have acted as redistribution
No significant bullish displacement has followed the liquidity grab
Sellers continue defending every recovery attempt
👉 Current price action favors downside continuation unless the broken range is reclaimed.
📉 RSI Momentum
RSI (14): 23.1
RSI has entered deeply oversold territory
Momentum remains strongly bearish
No confirmed bullish divergence visible
👉 Oversold conditions may trigger a short-term bounce, but trend reversal signals remain absent.
📊 Key Levels
🔴 Resistance
$74.70 → Immediate resistance
$76.97 → Local resistance
$82.52 → 20 EMA resistance
$85.10 → 50 EMA resistance
🟢 Support
$70.90 → Current support
$67.14 → Major macro support
Below $67 → Liquidity sweep risk increases
📌 Final Outlook
Solana has lost its key consolidation support and remains under pressure beneath all major EMA and Fibonacci resistance levels.
✅ Reclaim & hold above $74.70–$76.97 → opens path toward $82.5 → $85
❌ Continued rejection below broken support → increases probability of a move toward $70.9 → $67.1
👉 Overall structure remains bearish, with sellers maintaining control after the range breakdown. The $67–$71 region is now the most important support zone for bulls to defend, while $74–$77 becomes the key area that must be reclaimed to signal any meaningful recovery.
$SOL