Square
Following
Hot
News
Profile

BitBear

vip
Futures Trading Strategist
Market Analyst
Crypto Market Researcher
With 10 years of deep industry focus, you’ve definitely heard of: Bit Bear. He has been invited as a guest by multiple self-media outlets. He is a licensed professional financial wealth manager (Certificate No.: ABJ0087646), with 10 years of front-line, hands-on experience in financial trading. He has developed a core technical system covering areas such as trend analysis, volume-price structure, key support and resistance, swing cycle resonance, and risk position management. He is skilled at breaking down multi-cycle charts, identifying patterns, and filtering quantitative signals. He is committed to building standardized trading strategies with a high win rate, low drawdowns, and that can be replicated.
2
Following
10.7k
Followers
522
Liked
Pin
Those who went short this wave and kept up with the pace are feasting—the big crash came at just the right time.
post-image
1-hour Bollinger Band analysis
$BTC Previously dipped to 82501 and touched the lower Bollinger Band, then staged an oversold rebound, now returning to around 83317 near the middle band.
Upside resistance: 84000‑84600; downside support: 82600‑82500.
The Bollinger Bands are now narrowing, with clear signs of consolidation. No clear one-way move has emerged for now; watch whether the price can hold above the middle band.
After dropping to 2633 and touching the lower band, the price rebounded and is now around 2700, near and above the middle Bollinger Band.
Upside resistance: 2705-2720; downside
BTC+0.22%
📊 1-hour Bollinger Bands market analysis:
$BTC : After previously touching the upper Bollinger Band and coming under pressure, it has pulled back and now broken below the middle band, moving toward the lower band; 84400‑84600 has turned from support into resistance, with short-term support at 83500‑83200. If it breaks down further, it will test around 82800.
$ETH : It was likewise rejected at the upper band and turned lower, then moved down rapidly after breaking below the middle band. The current price has reached near the lower band; 2690‑2700 has become resistance, with the first support b
BTC+0.22%
ETH+0.17%
Let’s review it once more—it’s not that we only noticed the drop now;
Yesterday morning, we already shared this strategy for shorting at high levels.
The short positions at $ETH 2700 and $BTC 84500
reached their target levels this morning, and all profits have been realized!
The market never lacks opportunities; what it lacks are people who can see the structure in advance and are willing to execute according to plan!
ETH+0.17%
BTC+0.22%
Shorted ETH around 2,700 in the morning and comfortably took 30–40 points in profit.
Continued to set up high-level shorts on BTC at 84,700 and ETH at 2,720 in the evening.
There is no need for divine market predictions; only trade structures you understand, execute when the price reaches the level, and leave the rest to the market.
What’s most feared isn’t getting the direction wrong, but losing to frequent entries and poor mindset despite having a clear plan.
$BTC ‌After surging to 87374 and touching the upper band, it began to pull back and is now retracing toward the middle band. The Bollinger Bands are still trending upward, but the upper band has turned slightly downward, and bullish momentum has eased somewhat. The market is now entering a consolidation phase after the sharp rise.
Key support: 83400‑83600; resistance: 86300‑87400
$ETH ‌It surged as high as 2806, encountered resistance at the upper band, and pulled back, likewise oscillating near and below the middle band. The bands are still widening upward, but there are signs of weakening
BTC+0.22%
ETH+0.17%
Starting with 1500U at the beginning of September, steadily reached 2612U✨
There are no shortcuts to turning a small account around. Strictly follow the trading plan, maintain positions, and control drawdowns.
The early stages were difficult at every step; endure the cycle, and time will bring geometric compound growth.#美联储三年来首次加息25个基点
Bitcoin and Ethereum long-short cycle trading
live-replay-cover
5,765 views09-16 08:16
06:01:35
I publicly stated my view at 12:20 noon yesterday: the repeated pushes higher were merely sentiment-driven fakeout rallies.
A real bull market would not repeatedly give retail traders opportunities to get on board and become exit liquidity.
The market does not lie; it has consistently maintained bearish signals, and a major downtrend is certain to materialize sooner or later.
After my view was published, the market unfolded as expected:
BTC’s maximum decline exceeded 4%, while ETH’s maximum decline exceeded 6%.
Trading is all about understanding the market structure in advance and not letting
BitBear
It keeps faking people out; every pump is driven by sentiment, while the market action remains completely real.
If a bull market had truly arrived, it absolutely would not look like this. It simply would not give retail investors any chance to buy the dip—it would just keep moving straight up.
So I firmly believe a massive crash is imminent!$ETH ‌
ETH+0.17%
  • 1
It keeps faking people out; every pump is driven by sentiment, while the market action remains completely real.
If a bull market had truly arrived, it absolutely would not look like this. It simply would not give retail investors any chance to buy the dip—it would just keep moving straight up.
So I firmly believe a massive crash is imminent!$ETH ‌

ETH+0.17%
  • 1
$BTC (Bitcoin) 4-hour chart
Current price 76562, Bollinger Band parameters: midline 77096.3, upper band 77637.4, lower band 76555.1
1. Market structure: The 4-hour chart is generally moving sideways at low levels after a decline. The price is currently right near the lower Bollinger Band, which forms short-term support at 76555 and almost overlaps with the current price.
2. Key levels
✅Support: 76550 (Bollinger lower band); strong support at the previous low of 75866. If the price breaks below the lower band, the market will continue to move lower.
✅Resistance: First resistance at 77096 (Boll
BTC+0.22%
ETH+0.17%
It's Friday again. I accurately bottom-fished ETH last night and made a profit.
live-replay-cover
6,078 views09-11 08:26
06:41:16
Yesterday’s strategy of going long ETH at 2420 was excellent. The market moved as expected, reaching a high of 2475, and those who followed the setup secured 50+ points in profit.
post-image
  • 2
On this week's winning streak, high-altitude losses for three days
live-replay-cover
11,168 views09-10 06:11
08:52:22
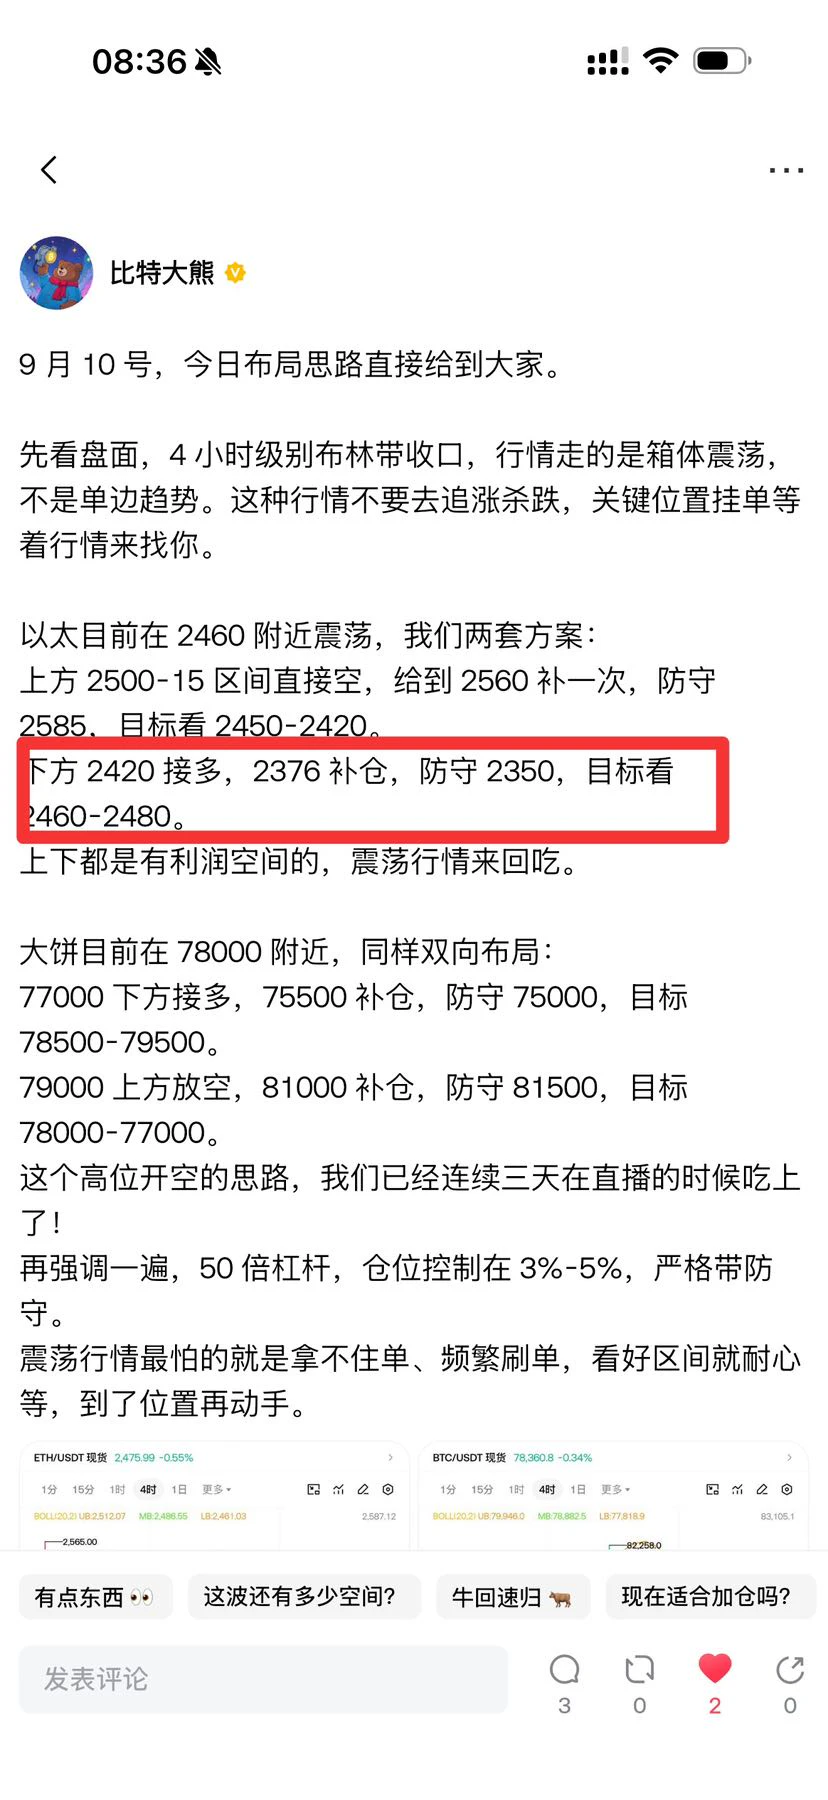
On September 10, today’s trading plan is laid out directly for everyone.
First, looking at the market, the Bollinger Bands are narrowing on the 4-hour chart, and the market is moving sideways within a range rather than in a one-way trend. In this kind of market, don’t chase rises or sell into declines; place orders at key levels and wait for the market to come to you.
ETH is currently fluctuating around 2460. We have two strategies:
Short directly in the 2500–2515 range, add once at 2560, set the stop at 2585, and target 2450–2420.
Go long at 2420, add at 2376, set the stop at 2350, and target
ETH+0.17%
BTC+0.22%
  • 3
Same levels, same targets—shorting at the highs for three consecutive days, with solid profits secured each round.
Many people always feel that the market is difficult to trade, but the problem is not that the market is complicated; it is that they keep fantasizing about a one-way move running all the way to the end.
Most of the time, the market simply moves sideways within a range: short at resistance, go long at support, and ride the swings back and forth. Isn't that great? Steadily putting U into your pocket—doesn't making money this way feel good?
In a ranging market, there is no need to b
post-image
Keep eating meat, get on the bus quickly
live-replay-cover
1,802 views09-09 06:14
04:24:57
On Monday and Tuesday, the livestream repeatedly emphasized shorting ETH at the 210–15 highs, with a target of 2450–20.
After the U.S. stock market opened, the market surged as expected, precisely reaching the anticipated target zone, and the short position successfully locked in profits.
This move was not about gambling on direction through luck, but about having an absolute grasp of the market trend and the rhythm of the main force’s accumulation and shakeout. After completing its accumulation, the main force directly dumped the market, and the price action fully matched the structure we h
ETH+0.17%
A moment worth recording: surpassing 10,000
post-image