
Square
Following
Hot
News
Profile
Share your thoughts
placeholder
Article
The Fear and Greed Index remains in the neutral zone at 53, but $DOGE ranks near the top in 24-hour trading volume, while the funding rate stays positive at +0.0067%—the market is weak, yet leveraged longs have not retreated. This is the divergence worth examining most closely today.
First, look at the broader market correlation. A Fear and Greed reading of 53 means sentiment is neither fearful nor euphoric: capital is not fleeing systematically, but traders are also unwilling to chase higher prices. In this environment, BTC’s range-bound movement directly suppresses altcoins’ independence. D
post-image
DOGE-1.50%
MEGA+12.73%
TRX-0.98%
Morning fam , my group is top 0.1% for the month
Pump challenge has been great so far with everyone printing
Market has been good to us so I’ve been making sure to give back
Who’s active ?
post-image
$30k a day keeps the 9-5 away $SPY
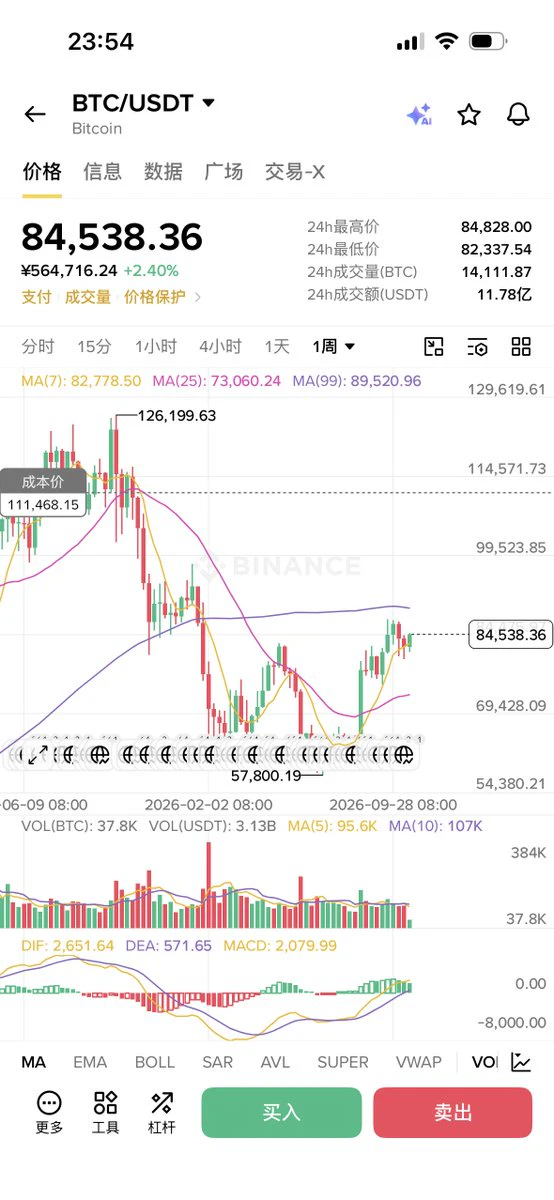
Bitcoin remains firmly bearish at midday, with 81,700 clearly acting as resistance and a direct short setup, targeting below 80,000. U.S. stocks fell as expected at the open, with the low reaching around 79,800; the 1,700-point move played out steadily…$BTC ‌#美国9月PPI大超预期
BTC+0.64%
#SpotGoldRecoversPostCPILosses
Can Gold Fully Recover After the US CPI Shock?
The global gold market is sending an important signal to investors. After suffering a sharp decline following the release of stronger-than-expected US Consumer Price Index (CPI) data, spot gold has staged a notable recovery. This rebound raises a crucial question: Can gold completely recover its CPI-driven losses, or is another correction waiting ahead?
As of October 15, 2026, gold's price action reflects a battle between persistent inflation, Federal Reserve interest-rate expectations, movements in the US dollar, a
post-image
XAU+1.41%
XAG+2.11%
crypto gainers and lossers overview
live-cover
LIVE1,775
🚀 dusk-network:native — THIS IS JUST THE BEGINNING 👀
DUSK keeps pushing higher, holding its bullish structure above the rising EMA.
📍 Support: $0.110–$0.112
🎯 Resistance: $0.120
🚀 Break above $0.12 could open the way toward $0.13–$0.14.
As long as the structure holds, continuation remains on the table. Still watching for the next leg up. 🔥
post-image
DUSK+11.12%
#USSeptemberCPITopsEstimates
Hot CPI, Uncertain Markets: Why I’m Not Rushing to Buy the Dip
The September CPI report has given traders another reason to think carefully before making their next move. What caught my attention is not just that inflation came in above expectations, but what it could mean for interest rates, market liquidity and investor confidence over the coming weeks. When everyone is hoping for easier monetary policy, even a small surprise in the wrong direction can change the entire mood of the market.
U.S. headline CPI rose to 3.7% year over year from 3.4% in August, while
post-image
BTC+0.64%
ETH+0.20%
NDAQ+1.21%
SPX500+0.27%
US30+1.10%
Yesterday, we analyzed this with everyone: sharp declines are often accompanied by rebounds to fill the gap. The logic is simple—sharp declines can easily trigger panic selling; once the market’s selling pressure is released in full, short-term buying enters and drives the price to recover and fill the gap. This is a very common pattern in short-term trading.
We seized the opportunity to open long positions directly and successfully took profits. The original target was set at 825, but the market went straight to 826! We got the timing right and executed properly, so the result was naturally s
ETH Market Update: Bulls and Bears Prepare for the Next Big Move
Ethereum has been experiencing daily price swings of around 100 points, highlighting the growing volatility and uncertainty in the market. After yesterday’s high-volume sell-off, ETH staged a strong rebound today, also accompanied by elevated trading volume.
The intense battle between buyers and sellers suggests that neither side has gained decisive control. Meanwhile, aggressive price movements may be flushing out highly leveraged positions as the market prepares for its next potential directional move.
According to the latest c
post-image
ETH+0.20%
Today is a key day for macroeconomics! We are awaiting the release of the September US PPI. If producer inflation shows a decline, this will give the Fed more room to further ease monetary policy and cut interest rates. We are waiting for positive news for the crypto market! 📉📈#ShareWeekly #USCPISoon
On the evening of October 15 Beijing time, Intel’s share price opened sharply lower, at one point falling more than 8% intraday. As of 23:26, the decline had narrowed to 4%, with its market capitalization falling below $500 billion; it was most recently reported at $493.97B.
post-image
INTC-4.12%
$HYPE HYPERLIQUID / USDT
Market Structure & Technical Outlook
Price has been in a bearish trend, consistently printing Lower Lows (LLs) and Lower Highs (LHs). However, a potential bullish reversal is developing, supported by bullish RSI divergence on the 1H timeframe.
Price has already broken above the previous Lower High (LH), indicating a potential shift in market structure from bearish to bullish. Therefore, an immediate entry may be considered, subject to the trader’s entry criteria and risk management rules.
Trade Plan
Entry: Instant Buy at Current Market Price (CMP), following the LH bre
post-image
HYPE+2.20%
Trade Closed! ✅️
Maybe early but I want the gains and the win for today's trading competition.
Join Me On AlphaX And Start Winning! Copy Trading Soon.
CPI Comes in Hotter Than Expected
live-cover
LIVE2,192
#On-chain metrics analysis
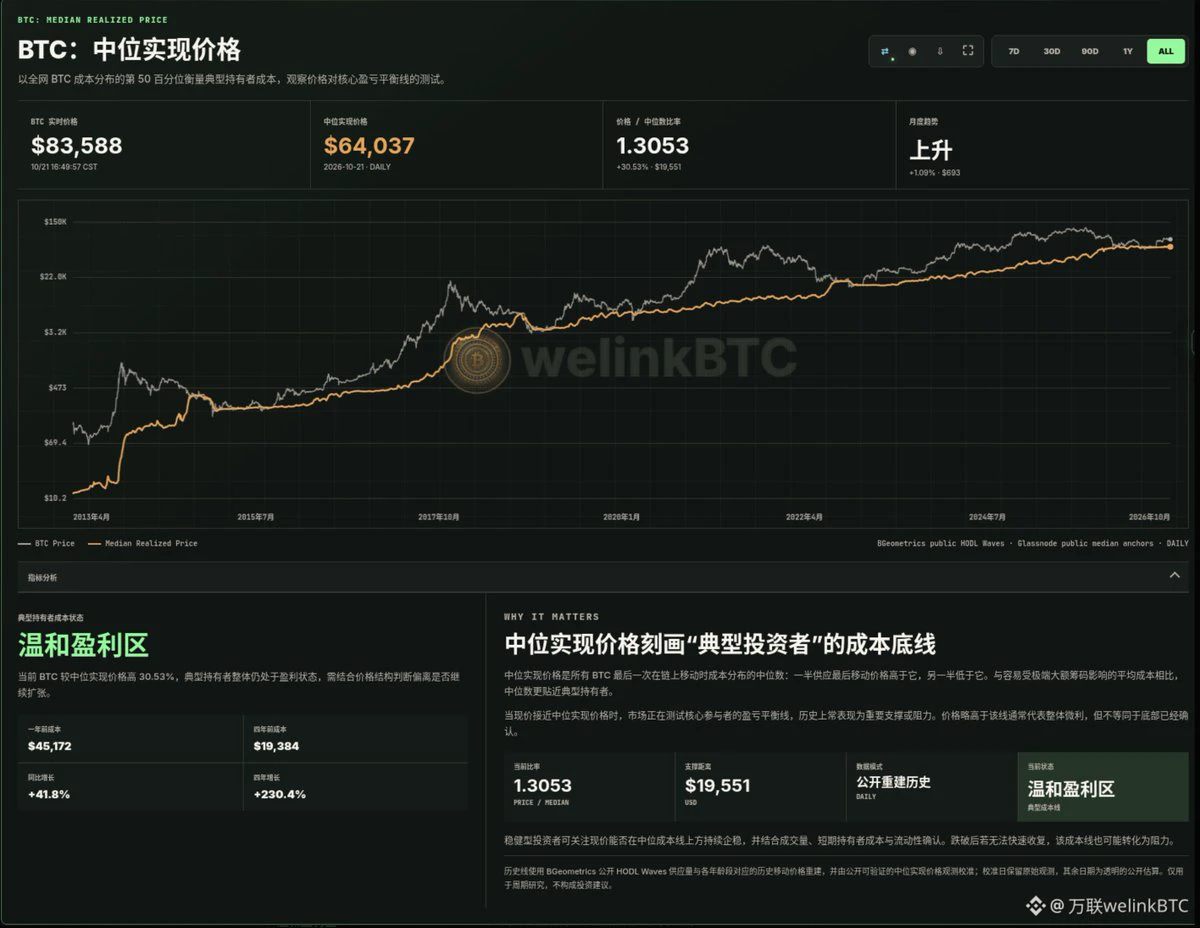
BTC: Golden cross between the "short-term holder cost line" and the "200-day moving average"
When the STH cost line crosses above the 200-day moving average, it indicates that the short-term market cost has been repaired and is once again outperforming the medium- and long-term trends. This is a macroeconomic structural signal, not a short-term buy or sell order.
The macro golden cross has been confirmed.
The cost of STH is approximately $74,581, while that of 200DMA is approximately $72,200, representing a relative difference of approximately +3.30%.
The most recent
post-image
BTC+0.64%
Thank you Singapore, it's been real
Until next year
post-image
Invite friends and receive DOGE. Register to receive a $10 voucher
  • 1
it's mid October and still 30° in Lisbon
post-image
Are we still debating whether to buy $BTC ’s ETFs? The direction is already clear.
The October 15 data is right there. Bitcoin ETFs saw a net outflow of 3,209 $BTC in a single day, worth $257.7 million. The seven-day total reached 5,250 BTC, or more than $420 million. Ethereum was even worse, with a single-day outflow of 38,915 $ETH and more than 133,000 ETH over seven days, worth over $300 million.
This isn’t a small move—it’s sustained capital flight. Futures open interest is still climbing, while spot ETFs are experiencing net outflows. Put the two together, and the signs of a market shift
post-image
BTC+0.73%
ETH+0.53%
Load More

Join 40 M users in our growing community

⚡️ Join 40 M users in the crypto craze discussion

💬 Engage with your favorite top creators

👍 See what interests you

Trending Topics

USSeptemberPPIBeatsExpectations

91.35k Views1.85k Discussing

US September PPI came in at 6.3% YoY, well above the 5.3% market expectation, pointing to renewed producer-side inflation pressure. Weekly jobless claims were 199K, broadly in line with forecasts. Could hotter inflation further reduce room for rate cuts, and what does it mean for $BTC, US stocks, and gold?

DrLinHanSpeaksAtOxfordUnion

135.63k Views1.86k Discussing

JapanAndKoreaStocksPlunge

47.27k Views1.75k Discussing

View More