

Square
Following
Hot
News
Profile
Share your thoughts
placeholder
Article
$SOL The Water Thunder Tun hexagram, Kan above and Zhen below. Thunder rumbles beneath the water, trying to surface but unable to break through; with Tun, the biggest taboo is pulling hard as soon as it sprouts—waiting until it grows taller before cutting is steadier.
The daily moving averages are still overhead: EMA20 around 110.8 and EMA50 around 107.1. Yesterday's low was 100.5 and high was 106.5; the current price is around 105.4. Each rebound is lower than the last, so the structure remains bearish.
Plan: Scale into shorts from 106.8 to 110.5, with a stop-loss at 113.5—don't hold if it br
post-image
SOL+1.16%
It’s been frozen solid since this morning. I forgot to take it out of the freezer.
post-image
Elon Musk’s narrative still has to involve SOL—the rally is really strong
post-image
SOL+1.26%
Tomorrow all my friends will bring something from their countries. I made some wonderful friendships in Germany. I also made enough bulgur salad for 12 people at this hour :) It’s perfect for a first try😉
post-image
#USSeptemberPPIBeatsExpectations BITCOIN TARGETS $93,000
$BTC appears to be trading inside an ascending parallel channel.
After bouncing from the channel’s lower boundary, Bitcoin could now be setting up for a rally toward the mid-range at $88,000.
If momentum continues, the next target sits at the top of the channel around $93,000.
BTC+0.62%
  • 1
At 10 a.m. yesterday, Ether crashed to 2318 before recovering—I know what you’re hesitating about: it’s not that you’re bearish on it, you’re just worried this drop isn’t over yet.
The Time Lord sees this move as the end of a three-wave decline—in other words, the C wave.
The daily chart’s yearly moving average is around 2355. Yesterday’s wick pierced below it before recovering—the volume was 1.3 times that of the previous few days, so this wasn’t a drop with nobody stepping in.
The 2411 level we mentioned last time broke, and this is where it went next. He placed orders lower, with his stop-l
post-image
ETH+0.83%
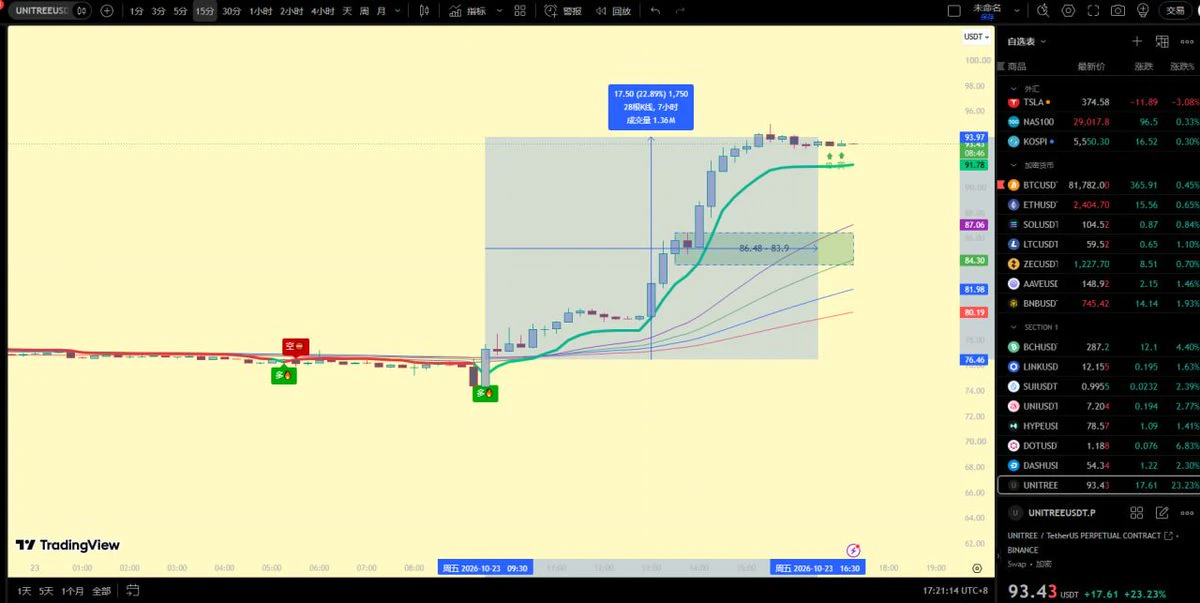
My friend asked me to find out: Is there still any hope for someone who bought Unitree Technology at 1,100 at the open?
It has been steadily sliding with no rebound whatsoever. After being cut in half, it can still be cut in half again.
At this rate, we’ll probably see Unitree Technology back at its IPO price before the end of the year.
Does every generation get its own PetroChina?
post-image
“The last straw” is no longer just an idiom.
It is now a warning post, dozens of bandwagon negative reviews, and the night when a 33-year-old mother could no longer hold on.
For ordinary people, living really is too hard.
post-image
$PI Hang in there—give it three to five years, and there may be some improvement.
post-image
PI+1.56%
$SNDK Hey, I stared at this chart for a while, and now I want to share a few heartfelt words with you guys.
Looking at the market, you can't just see that it's up 2.21% and start celebrating. Let's dig into the chart and see what clues we can find.
First, the market's overall “climate” is off.
Look at the scrolling news in the chart: “Trader Loracle's Nasdaq short position has turned profitable.” What's the implication? The broader environment is falling! The shorts on U.S. tech stocks are popping champagne and counting their money. As a stock token, no matter how strong SNDKG is, can it withs
post-image
SNDK-0.56%
  • 2
  • 1
10.16 ETH Market Trend Analysis
The market launched a strong rally from the low of 2323.00, climbing all the way to a high of 2466.62 before losing momentum. The price then turned lower and entered a high-level pullback consolidation phase. The Bollinger Bands gradually flattened and narrowed after opening upward, while the market fluctuated back and forth within the channel. The long-short indicator shifted from strong bullishness to balanced competition, forming a high-level pullback consolidation pattern after a major rally. 2466.62 is the key resistance high for this rally, with support be
post-image
ETH+0.89%
Bad-Boy Watch: SPCX Update 10.16
Big Rocket closed at 148.62 in U.S. trading, down 2.33%, with an intraday high of 149.04 and a low of 140.66.
About a week of consecutive declines in Big Rocket has wiped out all of the gains from the previous month.
Looking at the intraday chart, the sharp sell-off after the U.S. market opened last night did indeed bring it down to around 140, after which it quickly rebounded to around 148 and consolidated. So, the 148 level is critical now. Holding this level would allow it to continue moving upward, followed by another push toward 160 and higher.
If it break
SPCX-0.40%
Breaking 🚨Morgan Stanley predicts that quantum computing could grow into a $100 billion industry 🚀This prediction reflects accelerating research breakthroughs and continued growth in corporate investment. Quantum hardware suppliers are competing to increase the number of qubits, while financial companies are optimistic about its unprecedented data-processing capabilities. If this prediction becomes reality, the field could reshape everything from cryptography to artificial intelligence 🔥Stay tuned for further developments 📈$BA, $ZRO , $AGT
post-image
BA+2.19%
ZRO+14.64%
AGT+101.31%
Altcoins Under Pressure! Is Bitcoin Dominance Set to Rise?
live-cover
LIVE2,097
Not only does it fly, this car goes from 0 to 96 km/h in 0.81 seconds 🤯
$STBL Doubled in one day, surging from a 24h low of 0.0201 to a high of 0.0542, and now at 0.0432. With this kind of move, I only do one thing: wait for it to fall thoroughly, not chase the rally.
First, the plan. $STBL Currently at 0.0432, with a 24h range exceeding 160% and a trading volume of 18.8M, this is a typical hot-money trading market, not an area for value accumulation. I will place limit orders and wait for a pullback rather than chase it.
Entry plan: two levels. The first is around 0.0350, corresponding to a pullback of approximately 35% from the 24h high and serving as the first
STBL+30.62%
Bad Boy Watch: BTC Update 10.16
Bitcoin briefly broke below the 80000 level yesterday before quickly recovering. It is currently consolidating around 82000. It is facing resistance from the 5-day and 10-day moving averages, and a breakout requires reclaiming 82500.
The bad boy has a short position here.
The stop-loss will be placed around 83500.
The bad boy’s ultimate take-profit target is 71000.
Of course, 80800, 78800, 77500, and 76300 are also take-profit levels.
BTC+0.61%
🌅🚀 GATE.IO ⚡ HOT TRADER LIVE | BTCS NEXT BREAKOUT? ₿📈 | MORNING MARKET WATCH 🔥🐂🐻
live-cover
LIVE1,304
According to Jin10 Futures on October 16, overnight crude oil prices remained volatile in a high range, while fuel oil costs improved amid steady demand from refineries for secondary raw materials. Processors showed reluctance to sell at lower prices, indicating firm market support for fuel oil
post-image
🧧 Gate Live’s daily red packet rain is here—did you grab yours today?
🎙 Chat about hot market trends in real time, watch the market with professional hosts online, and join voice interactions anytime to discuss hot topics and find opportunities together~
Look for livestreams with the red packet icon on the cover—enter to participate in the red packet giveaway!
⚡ Get your fingers ready: https://www.gate.com/live
post-image
  • 4
  • 3
Load More

Join 40 M users in our growing community

⚡️ Join 40 M users in the crypto craze discussion

💬 Engage with your favorite top creators

👍 See what interests you

Trending Topics

USSeptemberPPIBeatsExpectations

91.35k Views1.9k Discussing

US September PPI came in at 6.3% YoY, well above the 5.3% market expectation, pointing to renewed producer-side inflation pressure. Weekly jobless claims were 199K, broadly in line with forecasts. Could hotter inflation further reduce room for rate cuts, and what does it mean for $BTC, US stocks, and gold?

DrLinHanSpeaksAtOxfordUnion

135.63k Views1.86k Discussing

KOSPIJumps3.3%

47.29k Views1.87k Discussing

View More