#GateEventContractTradeSharingChallenge
#$XAU
XAUUSD GOLD MARKET ANALYSIS 3 SEPTEMBER 2026
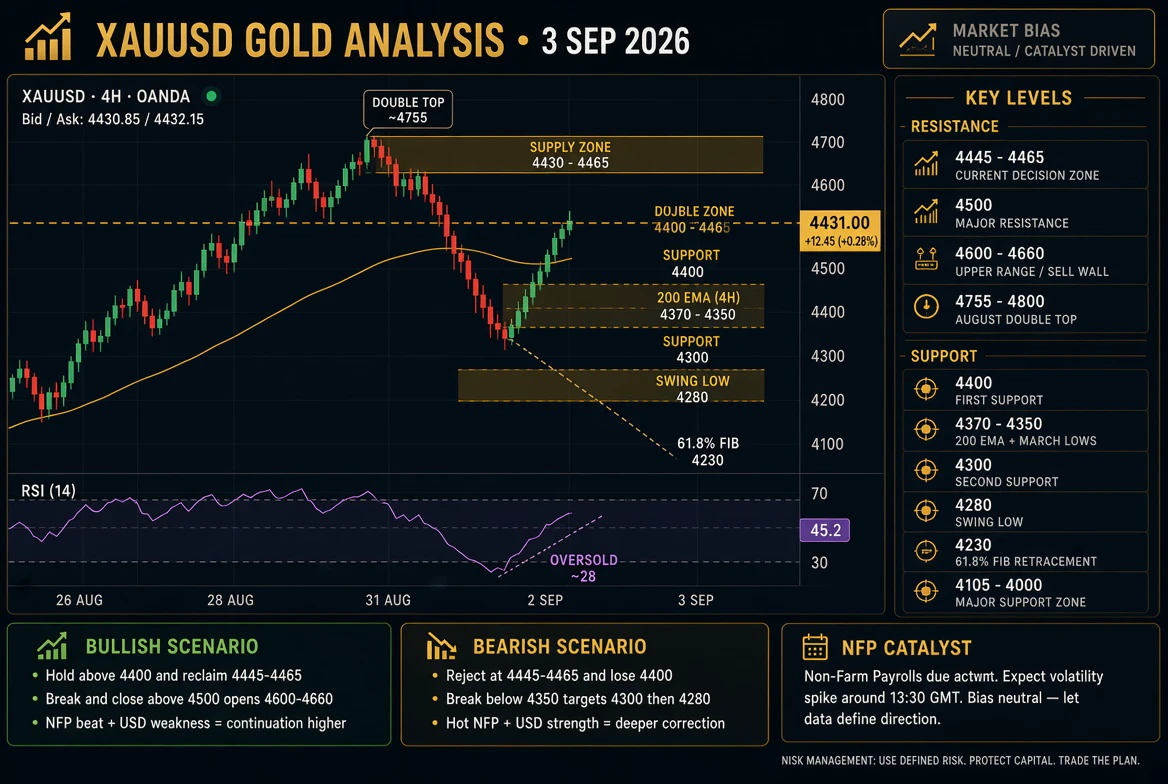
XAUUSD gold is trading near 4,431 at the time of writing, sitting right in the middle of a sharp correction after one of the most violent swings of the year. Gold turned down from the August double top near 4,755, sliced through the 4,500 and 4,400 supports in quick succession, and slid to a low around 4,280 before buyers stepped back in. The metal has now reclaimed the 4,400 round level and is pressing against the 4,430 to 4,465 supply zone, which makes the current price the true decision point for the rest of the week.
The selloff was triggered by a hawkish shift from the Federal Reserve following Jackson Hole, with markets now pricing a serious chance of a rate hike in September rather than a cut. Higher rate expectations pushed US Treasury yields to a nineteen month high and strengthened the dollar, and since gold pays no income, both forces hit it hard at the same time. Several major banks also trimmed their year end gold targets after removing 2026 rate cuts from their models, which gave the correction extra momentum.
The structural bid underneath is still intact. Central banks bought a record 288.9 tonnes in the second quarter of 2026, ETF inflows have continued, and the unresolved Strait of Hormuz crisis keeps a geopolitical risk premium in the metal. This is exactly why dips below 4,400 have been bought quickly instead of turning into a full crash. Goldman Sachs still targets 4,900 by the end of 2026 and Wells Fargo sees 4,900 to 5,100, so the medium term narrative is not broken, it is simply repricing around the Fed.
Technically, the bigger picture remains a bull market that is correcting. The 200 day exponential moving average sits near 4,370 and aligns with the March swing lows, making that zone the bull bear dividing line. During the slide, the four hour RSI fell to about 28, a clearly oversold reading, and the rebound has now lifted it back into the neutral 45 to 50 region, with the daily RSI in a similar area. In simple words, gold is no longer oversold but momentum still has room to build. A push above 55 on a confirmed close above 4,465 would signal renewed buying, while another rejection near the 50 level would warn that the correction has one more leg down.
Support levels in order: 4,400 is the first line and a daily close below it brings 4,370 to 4,350 into play, where the 200 day EMA and earlier lows cluster together. Below that, 4,300 is the psychological floor and 4,280 is the swing low of this correction. A daily close under 4,280 opens 4,230, which is the 61.8 percent retracement of the recent rally, and then the deeper 4,105 to 4,000 zone where the structural buyers are expected to return.
Resistance levels in order: 4,445 to 4,465 comes first and it has rejected every bounce so far. A clean close above that zone targets 4,500, then 4,600 to 4,660 where the 50 day average and previous breakdown levels meet. The real barrier is 4,755 to 4,800, the August double top; a sustained break above it would confirm that the correction is finished and open a move toward 4,900 to 5,000.
So how high can gold go? Over the next two to four weeks, a successful defence of the 4,400 to 4,370 support combined with a soft US jobs report could carry price back to 4,600 and then toward the 4,755 to 4,800 resistance, and the year end institutional targets of 4,900 to5,100 remain alive if the Fed backs away from hiking. If yields keep climbing and the dollar strengthens further instead, gold can still slip to4,230 and even4,100 before dip buyers return. The single most important catalyst is Friday's US Non-Farm Payrolls report: a weak number would rapidly unwind the rate hike narrative and likely spike gold higher, while a strong number could extend the slide.
Trading plan. Plan A, the bullish setup which is preferred while price holds above 4,400: look for a confirmed close above 4,465 or a defended retest of the 4,415 to4,430 zone for longs. Place SL1 at4,395, SL2 at4,365 and SL3 at4,335. Take TP1 at4,500, TP2 at4,600 and TP3 at4,660. Plan B, the bearish setup: if price is rejected at the4,445 to4,465 resistance or breaks and closes below4,350, shorts can target4.300 and then4,280. Use stops at4,375, 4,400 and4,445 as SL1, SL2 and SL3, with TP1 at4,300, TP2 at4,280 and TP3 at4,230. Keep position sizes small, respect the stops, and remember that volatility around the jobs report can spike both ways within minutes. Market sentiment right now is cautious and two sided: leveraged traders are leaning bearish on the Fed narrative, while central banks, ETF investors and long term holders are quietly accumulating on weakness. This analysis is for educational purposes only and is not financial advice; leveraged products carry a high risk of loss, so trade only with capital you can afford to lose.
$XAU
#$XAU
XAUUSD GOLD MARKET ANALYSIS 3 SEPTEMBER 2026
XAUUSD gold is trading near 4,431 at the time of writing, sitting right in the middle of a sharp correction after one of the most violent swings of the year. Gold turned down from the August double top near 4,755, sliced through the 4,500 and 4,400 supports in quick succession, and slid to a low around 4,280 before buyers stepped back in. The metal has now reclaimed the 4,400 round level and is pressing against the 4,430 to 4,465 supply zone, which makes the current price the true decision point for the rest of the week.
The selloff was triggered by a hawkish shift from the Federal Reserve following Jackson Hole, with markets now pricing a serious chance of a rate hike in September rather than a cut. Higher rate expectations pushed US Treasury yields to a nineteen month high and strengthened the dollar, and since gold pays no income, both forces hit it hard at the same time. Several major banks also trimmed their year end gold targets after removing 2026 rate cuts from their models, which gave the correction extra momentum.
The structural bid underneath is still intact. Central banks bought a record 288.9 tonnes in the second quarter of 2026, ETF inflows have continued, and the unresolved Strait of Hormuz crisis keeps a geopolitical risk premium in the metal. This is exactly why dips below 4,400 have been bought quickly instead of turning into a full crash. Goldman Sachs still targets 4,900 by the end of 2026 and Wells Fargo sees 4,900 to 5,100, so the medium term narrative is not broken, it is simply repricing around the Fed.
Technically, the bigger picture remains a bull market that is correcting. The 200 day exponential moving average sits near 4,370 and aligns with the March swing lows, making that zone the bull bear dividing line. During the slide, the four hour RSI fell to about 28, a clearly oversold reading, and the rebound has now lifted it back into the neutral 45 to 50 region, with the daily RSI in a similar area. In simple words, gold is no longer oversold but momentum still has room to build. A push above 55 on a confirmed close above 4,465 would signal renewed buying, while another rejection near the 50 level would warn that the correction has one more leg down.
Support levels in order: 4,400 is the first line and a daily close below it brings 4,370 to 4,350 into play, where the 200 day EMA and earlier lows cluster together. Below that, 4,300 is the psychological floor and 4,280 is the swing low of this correction. A daily close under 4,280 opens 4,230, which is the 61.8 percent retracement of the recent rally, and then the deeper 4,105 to 4,000 zone where the structural buyers are expected to return.
Resistance levels in order: 4,445 to 4,465 comes first and it has rejected every bounce so far. A clean close above that zone targets 4,500, then 4,600 to 4,660 where the 50 day average and previous breakdown levels meet. The real barrier is 4,755 to 4,800, the August double top; a sustained break above it would confirm that the correction is finished and open a move toward 4,900 to 5,000.
So how high can gold go? Over the next two to four weeks, a successful defence of the 4,400 to 4,370 support combined with a soft US jobs report could carry price back to 4,600 and then toward the 4,755 to 4,800 resistance, and the year end institutional targets of 4,900 to5,100 remain alive if the Fed backs away from hiking. If yields keep climbing and the dollar strengthens further instead, gold can still slip to4,230 and even4,100 before dip buyers return. The single most important catalyst is Friday's US Non-Farm Payrolls report: a weak number would rapidly unwind the rate hike narrative and likely spike gold higher, while a strong number could extend the slide.
Trading plan. Plan A, the bullish setup which is preferred while price holds above 4,400: look for a confirmed close above 4,465 or a defended retest of the 4,415 to4,430 zone for longs. Place SL1 at4,395, SL2 at4,365 and SL3 at4,335. Take TP1 at4,500, TP2 at4,600 and TP3 at4,660. Plan B, the bearish setup: if price is rejected at the4,445 to4,465 resistance or breaks and closes below4,350, shorts can target4.300 and then4,280. Use stops at4,375, 4,400 and4,445 as SL1, SL2 and SL3, with TP1 at4,300, TP2 at4,280 and TP3 at4,230. Keep position sizes small, respect the stops, and remember that volatility around the jobs report can spike both ways within minutes. Market sentiment right now is cautious and two sided: leveraged traders are leaning bearish on the Fed narrative, while central banks, ETF investors and long term holders are quietly accumulating on weakness. This analysis is for educational purposes only and is not financial advice; leveraged products carry a high risk of loss, so trade only with capital you can afford to lose.
$XAU