





#英特尔财报超预期股价却暴跌 #Gate广场万圣节 Intel at $70.79: A Strong Quarter, but a Much Weaker Road Ahead
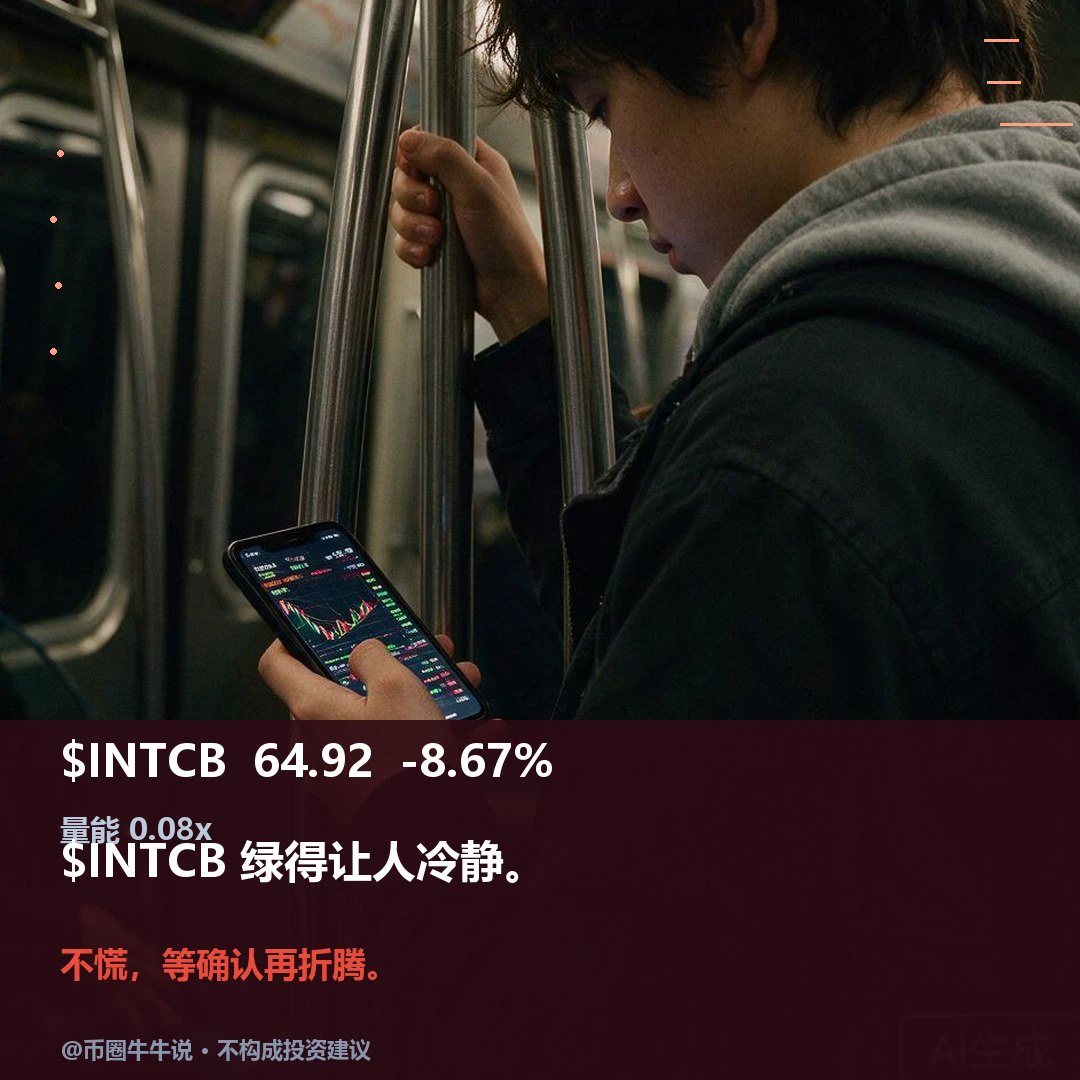
Intel’s latest earnings report delivered a confusing message: the company improved its profitability, yet the market responded with an aggressive sell-off. At around **$70.79**, INTC is facing a serious confidence test. My view is that investors are looking beyond the reported quarter and questioning whether Intel can turn its improving business performance into sustainable growth.
💡 The Earnings Beat Was Not the Whole Story
Intel reported Q3 2026 revenue of approximately **$16.5 billion**, up 21% year over year. Non-GAAP EPS came in at **$0.52**, above the analyst estimate of $0.41. However, revenue was slightly below the reported consensus of $16.56 billion.
The bigger disappointment came from the next-quarter outlook. Intel expects Q4 revenue of **$15–16 billion**, compared with market expectations of around $17.29 billion. Its non-GAAP EPS forecast of $0.25 also falls short of the $0.45 estimate.
That difference explains why a company can report better earnings and still see its shares fall sharply. Markets price future expectations, not just past results.
🤖 AI Demand Is Growing, but Execution Remains the Test
Intel’s data-center and AI business delivered strong growth, with revenue reportedly rising 78% to $7.3 billion. That is an encouraging sign as demand for server processors expands.
But strong demand does not automatically guarantee stronger profits. Intel still needs to address manufacturing capacity, supply constraints, product execution and the cost of competing in the AI semiconductor market. The market wants evidence that this growth can translate into better margins and reliable cash generation.
📊 Technical Picture: Sellers Still Have Control
Using your supplied reference price of **$70.79**, the technical setup remains cautious. A separate October 30 daily technical snapshot placed INTC near $71.52, with RSI at **27.1**, indicating oversold conditions. Its four-hour RSI was around 19.1, while the weekly RSI was 48.3.
The daily technical summary showed a strong bearish bias, with price below the tracked moving averages. This suggests that the recent decline is more than a small intraday correction.
MACD and moving-average signals can differ across platforms and chart settings, so I would not rely on one indicator alone. Price reaction around important levels, trading volume and daily closing confirmation matter more.
🔻 Downside Levels I Am Watching
The first important support zone is around **$69.90–$70.00**. A sustained daily close below this area could expose the next technical support near **$63.64**.
If selling pressure accelerates and broader market sentiment deteriorates, the lower support area near **$54.60** becomes a deeper-risk reference, not an immediate price target.
A breakdown is not confirmed simply because price touches support. I would watch whether sellers maintain control on increased volume and whether buyers fail to reclaim the broken level.
🟢 What Could Bring Buyers Back?
The first recovery test is the **$72.54** resistance area. A convincing close above it, supported by stronger volume, would be an early sign that selling pressure is easing.
Above that, the next important resistance levels are approximately **$76.46** and **$80.30**. Reclaiming these zones would improve the technical outlook, but a sustainable bullish reversal would also require better guidance, improving supply conditions and confidence in future margins.
An oversold RSI can produce a relief bounce. It does not, by itself, confirm that the bottom is in.
🌍 Geopolitics and the Wider Market Risk
Geopolitical tensions remain an uncertainty for global markets. Until the US midterm election period passes, political headlines and risk sentiment may continue creating volatility across equities and technology stocks.
However, I would not treat the election as a guaranteed direction signal for Intel. INTC has its own company-specific risks: Q4 guidance, PC demand, manufacturing capacity and competition in AI infrastructure. These factors are more directly connected to its valuation.
🎯 My Trading View: Patience Before a New Position
At $70.79, I would avoid assuming that the sharp fall has automatically created a bargain. The bearish case remains stronger while INTC struggles below $72.54 and cannot hold its nearest support.
For a bullish setup, I want to see support defend successfully, selling volume cool down, and price reclaim resistance with confirmation. For a bearish continuation, I would watch for a decisive close below $69.90 rather than reacting to a temporary move beneath it.
My priority is capital protection: smaller position sizing, predefined invalidation and no emotional averaging down. A falling stock can become cheaper without becoming attractive immediately.
Has Intel Been Oversold, or Is the Market Repricing Its Future?
Q3 showed progress, but Q4 guidance exposed the gap between current performance and future expectations. Intel still has an opportunity to prove its AI and data-center growth story, yet investors appear to be demanding stronger execution.
I am watching the $69.90 support and $72.54 recovery level before making a stronger directional decision.
#ShareWeekly