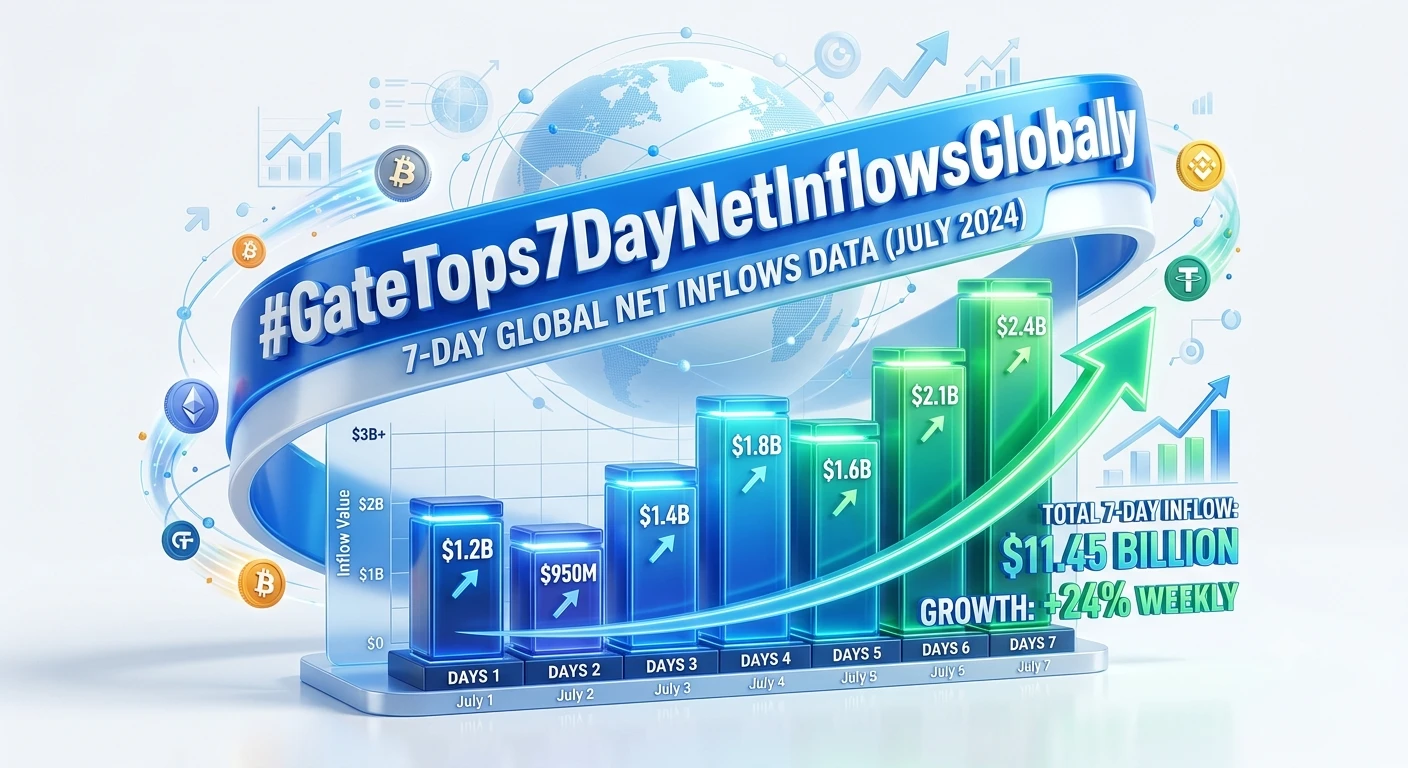
#GateTops7DayNetInflowsGlobally
Gate Tops Global 7-Day Net Inflows: What This Signal Says About Investor Confidence
Gate ranking first globally in 7-day net inflows is more than a short-term platform statistic. It is a market signal that deserves a closer look because net inflows can provide valuable insight into how users are positioning capital, where trading activity is moving and how investor confidence is changing across the digital asset market.
When capital enters a trading platform, it can represent several different intentions. Some users may be preparing to trade, others may be moving assets for portfolio management, while some may simply be increasing their available liquidity during periods of changing market conditions.
This makes net inflows different from simple trading volume.
Trading volume tells us how much activity is taking place.
Net inflows tell us more about the movement of capital into a platform.
When a platform records strong net inflows over a seven-day period, it suggests that the amount of capital entering the platform is exceeding the amount leaving it during that period. That can indicate growing user engagement, increasing trading preparation and stronger demand for access to available financial products.
Gate ranking at the top of the global seven-day net inflow metric therefore creates an interesting market narrative.
The first question is where the capital is coming from.
Crypto markets operate continuously across global regions, meaning capital flows can change rapidly as investors respond to Bitcoin price movements, altcoin opportunities, macroeconomic developments, interest-rate expectations and broader risk sentiment.
A strong inflow ranking can indicate that users are actively preparing for new market opportunities rather than simply reducing exposure.
However, inflows should never be interpreted as a guaranteed bullish signal for the entire crypto market.
Capital can enter an exchange before both buying and selling activity.
Some traders may deposit funds because they expect volatility.
Others may move assets to take advantage of derivatives, spot opportunities, new listings or portfolio rebalancing.
Therefore, the most useful way to interpret net inflows is together with other market indicators.
Bitcoin price structure remains one of the most important factors.
If BTC is holding key support levels while exchange inflows increase, it may suggest that market participants are positioning capital for potential upside opportunities.
If BTC is approaching major resistance, higher inflows could also indicate that traders are preparing for increased volatility.
The same logic applies to Ethereum and major altcoins.
Crypto markets are increasingly interconnected. Capital entering a large global platform can eventually move across different asset categories depending on market conditions.
This is where Gate's broad ecosystem becomes particularly relevant.
A platform supporting thousands of digital assets provides users with access to multiple market segments rather than limiting activity to only a handful of major cryptocurrencies.
That creates more flexibility for investors and traders who constantly adjust their strategies according to changing market conditions.
One of the biggest developments in modern crypto markets is the increasing importance of liquidity.
Liquidity allows traders to enter and exit positions more efficiently and can help markets absorb large orders without excessive price disruption.
Growing capital flows can contribute to deeper liquidity, although the relationship is not automatic and depends on how those assets are distributed across markets and trading pairs.
This is why a sustained inflow trend may be more meaningful than a single-day spike.
Seven-day performance provides a broader window.
It reduces the importance of one isolated transaction or one unusually active trading session and gives a better indication of recent capital movement.
If strong inflows continue over multiple periods, the signal becomes more interesting.
It may indicate that users are consistently increasing their presence on the platform rather than responding to one temporary event.
There is also a broader industry trend behind this development.
Crypto investors today have access to significantly more financial products than they did several years ago.
Spot trading, futures, options, staking, earn products, Web3 applications and other services are increasingly becoming part of the same digital financial environment.
This means that exchange platforms are no longer competing only on trading fees or the number of listed tokens.
They are competing on liquidity, security, product depth, technology, accessibility and the overall user experience.
Gate's global positioning is therefore important when interpreting its seven-day inflow ranking.
A platform serving users across different regions can experience capital movements influenced by multiple market cycles at the same time.
Asian trading hours, European market activity and US macroeconomic developments can all affect crypto liquidity and sentiment.
This creates a continuously evolving flow of capital throughout the global market.
Another factor worth watching is stablecoin liquidity.
Stablecoins often act as the bridge between traditional currency and crypto markets. When traders move stablecoins onto an exchange, they can potentially deploy that capital into Bitcoin, Ethereum, altcoins or other available products.
Therefore, changes in stablecoin balances and exchange inflows can provide additional context for understanding market positioning.
At the same time, investors should avoid assuming that every inflow immediately becomes buying pressure.
Capital can remain unused, move between products or eventually leave the platform.
The real significance comes from combining inflow data with price action, open interest, funding rates, trading volume and broader market sentiment.
This is especially important during volatile market conditions.
When uncertainty increases, investors often become more active in managing risk.
Some increase cash or stablecoin positions.
Some hedge through derivatives.
Others search for opportunities created by large price movements.
A platform experiencing strong net inflows can therefore become an important center of this activity.
The seven-day timeframe also makes the metric particularly relevant for short-term market analysis.
Long-term adoption tells us about structural growth.
Short-term net inflows tell us more about current positioning.
Both are important, but they answer different questions.
Long-term user growth shows whether a platform is expanding its reach.
Net inflows show where capital has recently been moving.
Trading volume shows how actively that capital is being used.
Liquidity shows how efficiently markets can absorb that activity.
Together, these indicators provide a much clearer picture than any single metric.
This is why #GateTops7DayNetInflowsGlobally deserves attention beyond the headline ranking.
It highlights the importance of capital flows in understanding the modern crypto market.
The digital asset industry has matured significantly. Investors now monitor not only token prices but also exchange reserves, ETF flows, stablecoin supply, derivatives positioning, institutional activity and macroeconomic liquidity.
Capital movement has become one of the most important pieces of the market puzzle.
If Gate can maintain strong net inflows while continuing to expand liquidity, products and global accessibility, the significance of this ranking could become even greater.
But sustainability will be the key.
One strong seven-day period is interesting.
Repeated strong inflows across multiple periods would be a much stronger signal.
That would suggest that capital is not simply moving temporarily but that users are increasingly choosing the platform as part of their ongoing trading and investment activity.
The broader market environment will also remain important.
Interest-rate expectations, inflation data, central-bank policy, equity-market performance, geopolitical risks and global liquidity conditions can all influence how much capital investors are willing to allocate toward digital assets.
Crypto does not operate in isolation anymore.
Bitcoin increasingly trades within the same global liquidity environment that affects technology stocks, commodities, currencies and other risk assets.
This makes exchange-level capital flows even more useful.
They provide a real-time window into how market participants are preparing for the next phase of volatility.
The most interesting question is therefore not simply why Gate ranked first in seven-day net inflows.
The bigger question is what happens next.
Will these inflows translate into higher trading activity?
Will liquidity continue improving?
Will capital rotate toward Bitcoin and Ethereum, or toward higher-beta altcoins?
Will traders increase derivatives exposure?
Will stablecoin balances remain elevated?
And most importantly, will strong capital inflows continue beyond a single seven-day period?
Those developments will determine whether this ranking becomes a temporary market event or part of a longer-term trend.
For traders and investors, the lesson is simple.
Do not look at price alone.
Watch where capital is moving.
Watch liquidity.
Watch volume.
Watch derivatives positioning.
Watch macroeconomic conditions.
And watch whether capital flows remain consistent over time.
Gate topping the global seven-day net inflow ranking provides another data point for that analysis.
It does not guarantee that prices will rise, and it should not be treated as a standalone buy or sell signal.
But it does highlight an important development: significant capital is moving through Gate's ecosystem, and that movement deserves attention.
As crypto continues evolving into a broader digital financial market, capital flow data will become increasingly important for understanding investor behavior.
The next stage of the market will not be defined only by who has the highest trading volume.
It will also be defined by where capital is moving, why it is moving and whether those flows can remain sustainable.
That is what makes more than a ranking.
It is a snapshot of current market positioning and another indication of how quickly the global digital asset ecosystem continues to develop.
#GateSquare
#ContentMining
@Gate_Square
Gate Tops Global 7-Day Net Inflows: What This Signal Says About Investor Confidence
Gate ranking first globally in 7-day net inflows is more than a short-term platform statistic. It is a market signal that deserves a closer look because net inflows can provide valuable insight into how users are positioning capital, where trading activity is moving and how investor confidence is changing across the digital asset market.
When capital enters a trading platform, it can represent several different intentions. Some users may be preparing to trade, others may be moving assets for portfolio management, while some may simply be increasing their available liquidity during periods of changing market conditions.
This makes net inflows different from simple trading volume.
Trading volume tells us how much activity is taking place.
Net inflows tell us more about the movement of capital into a platform.
When a platform records strong net inflows over a seven-day period, it suggests that the amount of capital entering the platform is exceeding the amount leaving it during that period. That can indicate growing user engagement, increasing trading preparation and stronger demand for access to available financial products.
Gate ranking at the top of the global seven-day net inflow metric therefore creates an interesting market narrative.
The first question is where the capital is coming from.
Crypto markets operate continuously across global regions, meaning capital flows can change rapidly as investors respond to Bitcoin price movements, altcoin opportunities, macroeconomic developments, interest-rate expectations and broader risk sentiment.
A strong inflow ranking can indicate that users are actively preparing for new market opportunities rather than simply reducing exposure.
However, inflows should never be interpreted as a guaranteed bullish signal for the entire crypto market.
Capital can enter an exchange before both buying and selling activity.
Some traders may deposit funds because they expect volatility.
Others may move assets to take advantage of derivatives, spot opportunities, new listings or portfolio rebalancing.
Therefore, the most useful way to interpret net inflows is together with other market indicators.
Bitcoin price structure remains one of the most important factors.
If BTC is holding key support levels while exchange inflows increase, it may suggest that market participants are positioning capital for potential upside opportunities.
If BTC is approaching major resistance, higher inflows could also indicate that traders are preparing for increased volatility.
The same logic applies to Ethereum and major altcoins.
Crypto markets are increasingly interconnected. Capital entering a large global platform can eventually move across different asset categories depending on market conditions.
This is where Gate's broad ecosystem becomes particularly relevant.
A platform supporting thousands of digital assets provides users with access to multiple market segments rather than limiting activity to only a handful of major cryptocurrencies.
That creates more flexibility for investors and traders who constantly adjust their strategies according to changing market conditions.
One of the biggest developments in modern crypto markets is the increasing importance of liquidity.
Liquidity allows traders to enter and exit positions more efficiently and can help markets absorb large orders without excessive price disruption.
Growing capital flows can contribute to deeper liquidity, although the relationship is not automatic and depends on how those assets are distributed across markets and trading pairs.
This is why a sustained inflow trend may be more meaningful than a single-day spike.
Seven-day performance provides a broader window.
It reduces the importance of one isolated transaction or one unusually active trading session and gives a better indication of recent capital movement.
If strong inflows continue over multiple periods, the signal becomes more interesting.
It may indicate that users are consistently increasing their presence on the platform rather than responding to one temporary event.
There is also a broader industry trend behind this development.
Crypto investors today have access to significantly more financial products than they did several years ago.
Spot trading, futures, options, staking, earn products, Web3 applications and other services are increasingly becoming part of the same digital financial environment.
This means that exchange platforms are no longer competing only on trading fees or the number of listed tokens.
They are competing on liquidity, security, product depth, technology, accessibility and the overall user experience.
Gate's global positioning is therefore important when interpreting its seven-day inflow ranking.
A platform serving users across different regions can experience capital movements influenced by multiple market cycles at the same time.
Asian trading hours, European market activity and US macroeconomic developments can all affect crypto liquidity and sentiment.
This creates a continuously evolving flow of capital throughout the global market.
Another factor worth watching is stablecoin liquidity.
Stablecoins often act as the bridge between traditional currency and crypto markets. When traders move stablecoins onto an exchange, they can potentially deploy that capital into Bitcoin, Ethereum, altcoins or other available products.
Therefore, changes in stablecoin balances and exchange inflows can provide additional context for understanding market positioning.
At the same time, investors should avoid assuming that every inflow immediately becomes buying pressure.
Capital can remain unused, move between products or eventually leave the platform.
The real significance comes from combining inflow data with price action, open interest, funding rates, trading volume and broader market sentiment.
This is especially important during volatile market conditions.
When uncertainty increases, investors often become more active in managing risk.
Some increase cash or stablecoin positions.
Some hedge through derivatives.
Others search for opportunities created by large price movements.
A platform experiencing strong net inflows can therefore become an important center of this activity.
The seven-day timeframe also makes the metric particularly relevant for short-term market analysis.
Long-term adoption tells us about structural growth.
Short-term net inflows tell us more about current positioning.
Both are important, but they answer different questions.
Long-term user growth shows whether a platform is expanding its reach.
Net inflows show where capital has recently been moving.
Trading volume shows how actively that capital is being used.
Liquidity shows how efficiently markets can absorb that activity.
Together, these indicators provide a much clearer picture than any single metric.
This is why #GateTops7DayNetInflowsGlobally deserves attention beyond the headline ranking.
It highlights the importance of capital flows in understanding the modern crypto market.
The digital asset industry has matured significantly. Investors now monitor not only token prices but also exchange reserves, ETF flows, stablecoin supply, derivatives positioning, institutional activity and macroeconomic liquidity.
Capital movement has become one of the most important pieces of the market puzzle.
If Gate can maintain strong net inflows while continuing to expand liquidity, products and global accessibility, the significance of this ranking could become even greater.
But sustainability will be the key.
One strong seven-day period is interesting.
Repeated strong inflows across multiple periods would be a much stronger signal.
That would suggest that capital is not simply moving temporarily but that users are increasingly choosing the platform as part of their ongoing trading and investment activity.
The broader market environment will also remain important.
Interest-rate expectations, inflation data, central-bank policy, equity-market performance, geopolitical risks and global liquidity conditions can all influence how much capital investors are willing to allocate toward digital assets.
Crypto does not operate in isolation anymore.
Bitcoin increasingly trades within the same global liquidity environment that affects technology stocks, commodities, currencies and other risk assets.
This makes exchange-level capital flows even more useful.
They provide a real-time window into how market participants are preparing for the next phase of volatility.
The most interesting question is therefore not simply why Gate ranked first in seven-day net inflows.
The bigger question is what happens next.
Will these inflows translate into higher trading activity?
Will liquidity continue improving?
Will capital rotate toward Bitcoin and Ethereum, or toward higher-beta altcoins?
Will traders increase derivatives exposure?
Will stablecoin balances remain elevated?
And most importantly, will strong capital inflows continue beyond a single seven-day period?
Those developments will determine whether this ranking becomes a temporary market event or part of a longer-term trend.
For traders and investors, the lesson is simple.
Do not look at price alone.
Watch where capital is moving.
Watch liquidity.
Watch volume.
Watch derivatives positioning.
Watch macroeconomic conditions.
And watch whether capital flows remain consistent over time.
Gate topping the global seven-day net inflow ranking provides another data point for that analysis.
It does not guarantee that prices will rise, and it should not be treated as a standalone buy or sell signal.
But it does highlight an important development: significant capital is moving through Gate's ecosystem, and that movement deserves attention.
As crypto continues evolving into a broader digital financial market, capital flow data will become increasingly important for understanding investor behavior.
The next stage of the market will not be defined only by who has the highest trading volume.
It will also be defined by where capital is moving, why it is moving and whether those flows can remain sustainable.
That is what makes more than a ranking.
It is a snapshot of current market positioning and another indication of how quickly the global digital asset ecosystem continues to develop.
#GateSquare
#ContentMining
@Gate_Square