Square
Following
Hot
News
Profile

VANYA

vip
Web3 Creator
Diamond Hands
WeB 3 Creator
10
Following
2.2k
Followers
2.6k
Liked
Pin
$DEXE A Reminder That Risk Management Always Wins
$DEX#CXMTDebutsWith90.1BTradingVolume E delivered an impressive rally, but after reaching new highs, heavy selling pressure quickly changed the trend.
Every cycle teaches the same lesson:
Don't chase parabolic moves.
Strong pumps don't guarantee long-term strength.
Always manage risk and protect your capital.
In crypto, preserving capital is just as important as making profits.
Trade the trend, respect your stop-loss, and never let emotions control your decisions.
Survive the volatility today, so you're ready for the next opportunity tomorrow
DEXE-4.14%
  • 127
  • 17
Bitcoin Holds Support — Is $81.4K Next?
$BTC has tested the $79,150–$80,400 support zone twice, but sellers have failed to break it. Higher lows suggest buyers are still defending this area.
Key level to watch: $80,550
A breakout above this level could push BTC toward $80,830 and then $81,400. If bullish momentum continues, $82,180–$82,660 could become the next target zone.
However, rejection near resistance could bring another pullback.
For now, $80,550 is the level to watch for confirmation.
BTC-0.67%
  • 3
$SNDK is currently trading near $1,403 after a sharp intraday pullback. The immediate focus is whether buyers can defend the $1,350–$1,400 demand area and rebuild momentum.
Key levels: • Support: $1,350–$1,400
• First resistance: $1,460
• Next resistance: $1,520
• Major upside level: $1,600
Trade idea: I would prefer a confirmed reclaim and hold above $1,400 rather than entering during the current sell-off. A strong reaction from support could open the door toward the resistance levels above.
If $1,350 fails decisively, the setup needs to be reassessed rather than forcing a long position.
For
SNDK-13.55%
  • 3
$NVDA is cooling off. I’m not rushing to buy the dip.
After pulling back from the $237 area, NVDA is trading around $232.66 in my chart screenshot. The AI story is still strong, but price action needs to confirm the next move.
My plan:
→ Watch $230–232 for a possible support reaction.
→ A recovery toward $237 could be worth watching if momentum returns.
→ If support fails, I’ll stay patient instead of forcing an entry.
High Treasury yields remain a risk for growth stocks, so I’m keeping risk management ahead of FOMO.
#LedgerLossesNear90Million #GateAtTOKEN2049 #GateWCTCS9GlobalTradingCompetit
NVDA-3.46%
  • 2
$XAU
Gold is currently around $4,268/oz, with today’s range roughly $4,263–$4,303.
Market structure: Short-term bearish pressure is still visible after the break below $4,300. Rising Treasury yields, a stronger USD and hawkish Fed expectations are currently weighing on gold.
Key levels:
Current: ~$4,268
Support: $4,235–$4,260
Resistance: $4,300–$4,320
Major resistance: $4,347–$4,371
Trade view: Rather than chasing at current price, watch the $4,235–$4,260 support zone for a confirmed reaction. A reclaim and hold above $4,300 would improve the short-term structure; a clean breakdown below su
XAU+0.38%
  • 10
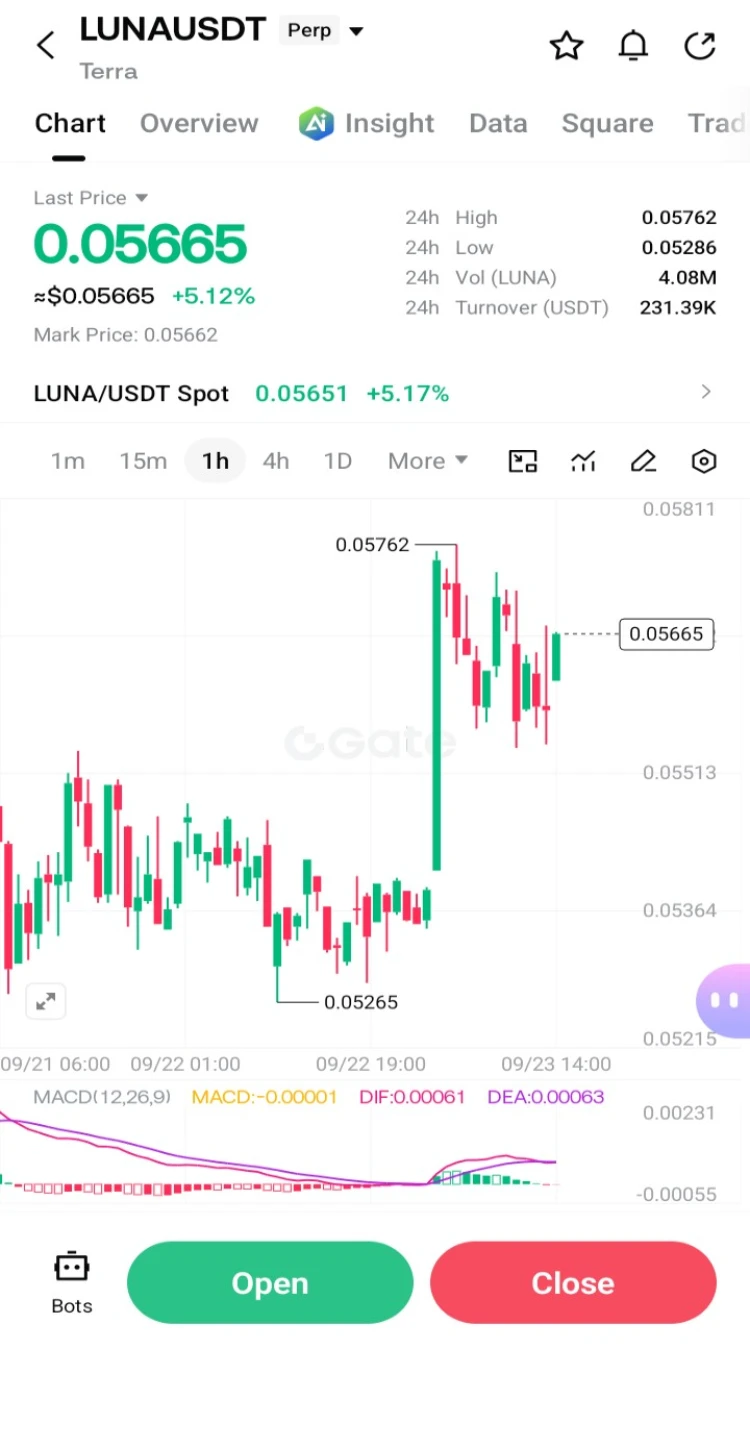
$LUNA is showing a noticeable shift in short-term market structure.
Price is currently trading around $0.056, after moving strongly from the $0.043–$0.045 area over the past several sessions. The move has also been accompanied by a clear increase in trading activity, suggesting that the recent upside is attracting fresh participation.
From a technical perspective, the important development is the sequence of higher lows forming after the mid-September bottom. LUNA2 moved from roughly $0.0436 on September 15 to above $0.056 by September 22, showing that buyers have gained short-term control.
A
post-image
LUNA-2.79%
  • 6
Guys, $AVAX is sitting around $10.60 right now. On the 15M chart, I’m watching how price reacts around the $10.50–$10.60 zone.
If buyers keep defending this area, I’d be watching for:
📍 Entry: $10.52 – $10.62
🎯 TP1: $10.78
🎯 TP2: $10.95
🎯 TP3: $11.15
🛑 SL: $10.28
The key for me is simple: hold $10.50 = bullish structure stays interesting.
Don’t rush the entry, my friends. Let the 15M candle give confirmation and manage your risk properly.
#MSTRTopsNasdaq100 #GateTops24HNetInflowsAmongExchanges #GateTopsStockPerpetualCoverage #ShareWeekly #FOMCMeetingAnalysis
AVAX-0.06%
  • 10
  • 3
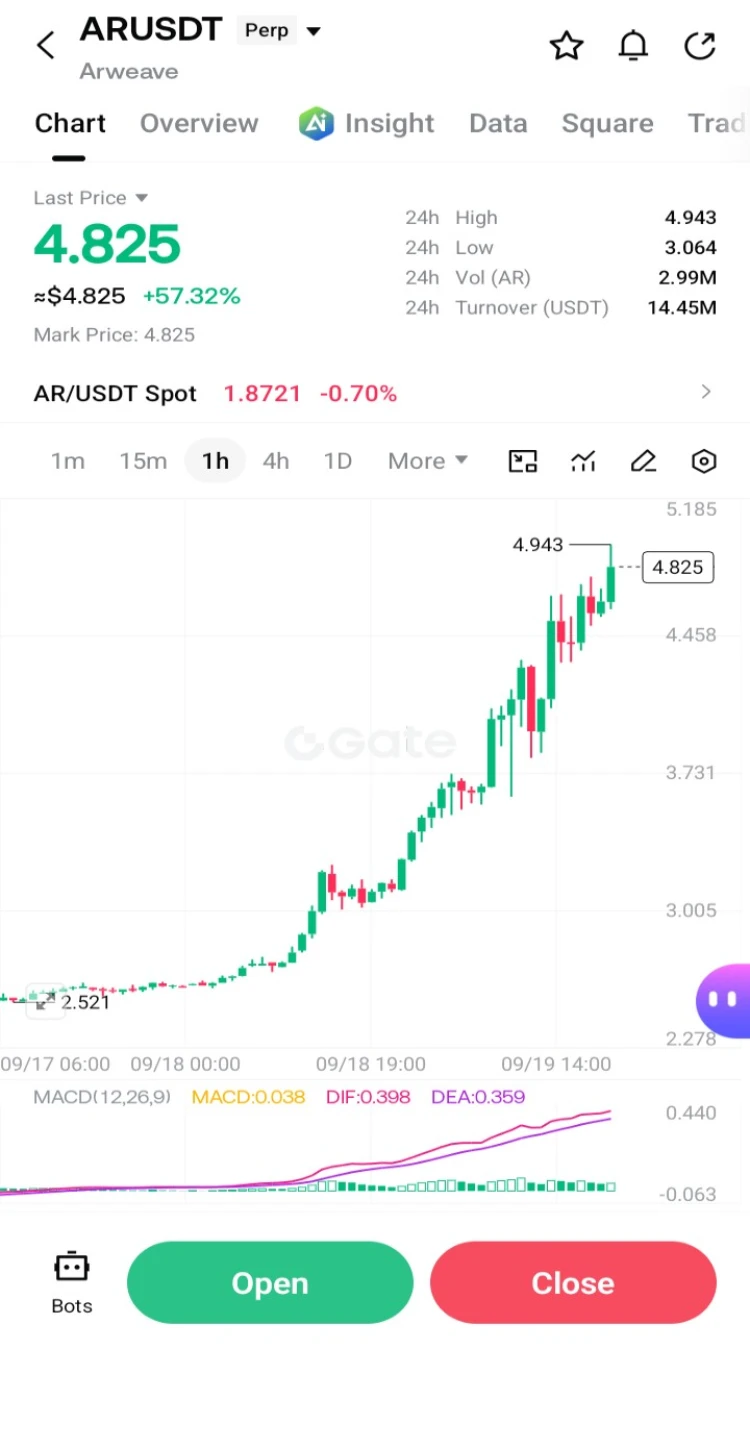
Wow, $AR is showing some serious momentum right now! Price is around $4.18 and buyers are clearly active after the strong move.
📍 Entry: $4.05 – $4.20
🎯 TP1: $4.40
🎯 TP2: $4.70
🎯 TP3: $5.00
🛑 SL: $3.85
I’m watching the $4.00 area closely. If buyers defend this zone and momentum stays strong, another leg higher could come.
Trade with proper risk management — DYOR. Not financial advice.
#JapanRealEstatePowerChipStocksRise #USAIConceptStocksRally #USHouseAdvancesBitcoinReserveBill #ShareWeekly
post-image
AR-0.92%
  • 4
  • 1
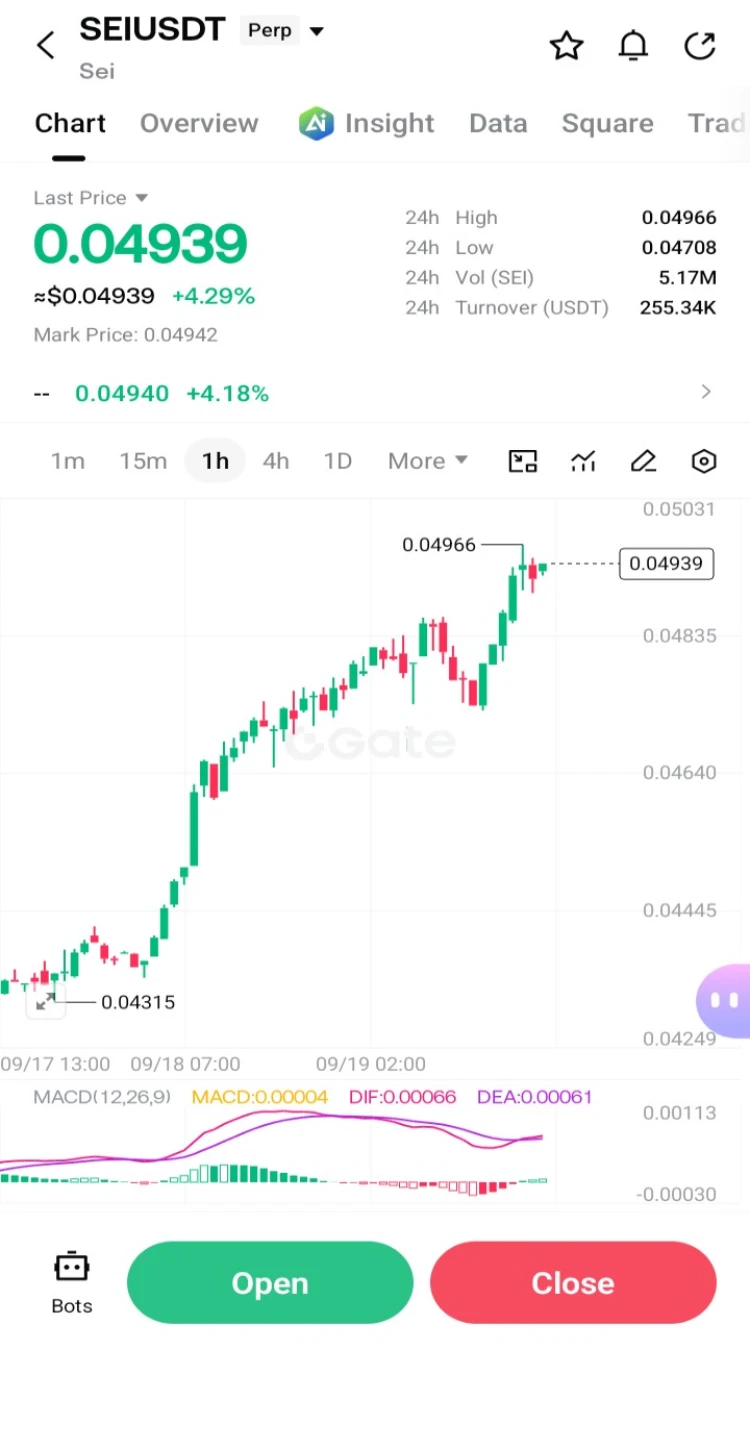
🔥 $SEI — I’m Watching This One Closely!
SEI is sitting around $0.048 and honestly, I like what I’m seeing here. 👀
Buyers have stepped back in strongly, and the short-term structure is looking bullish.
🟢 LONG ENTRY: $0.0477 – $0.0481
🛑 SL: $0.0468
🎯 TP1: $0.0488
🎯 TP2: $0.0495
🎯 TP3: $0.0502
Wow, if buyers keep defending this zone, I’d love to see SEI test that $0.05 area next. 🚀
I’m watching the $0.0477 zone closely — let’s see what the bulls do from here.
DYOR. Manage your risk.
#GateTopsStockPerpetualCoverage #GateTrenchesExclusive0GasTrading #ShareWeekly
#FOMCMeetingAnalysis
post-image
SEI-1.48%
  • 4
  • 1
🔥 WOW! $SOL IS SHOWING SOME SERIOUS STRENGTH!
SOL is holding strong around $113.6 and buyers are clearly stepping in. If momentum continues, this move could get interesting fast. 🚀
📍 Entry: $112.8 – $114.0
🎯 TP: $116 / $119 / $123
🛑 SL: $109.8
WOW… this setup is looking fantastic! 🔥
Let’s see if SOL can push through the resistance and deliver the next leg higher.
Manage risk • DYOR • Not financial advice
#JapanRealEstatePowerChipStocksRise #GateTopsStockPerpetualCoverage #ShareWeekly #GateTrenchesExclusive0GasTrading
SOL-0.77%
  • 11
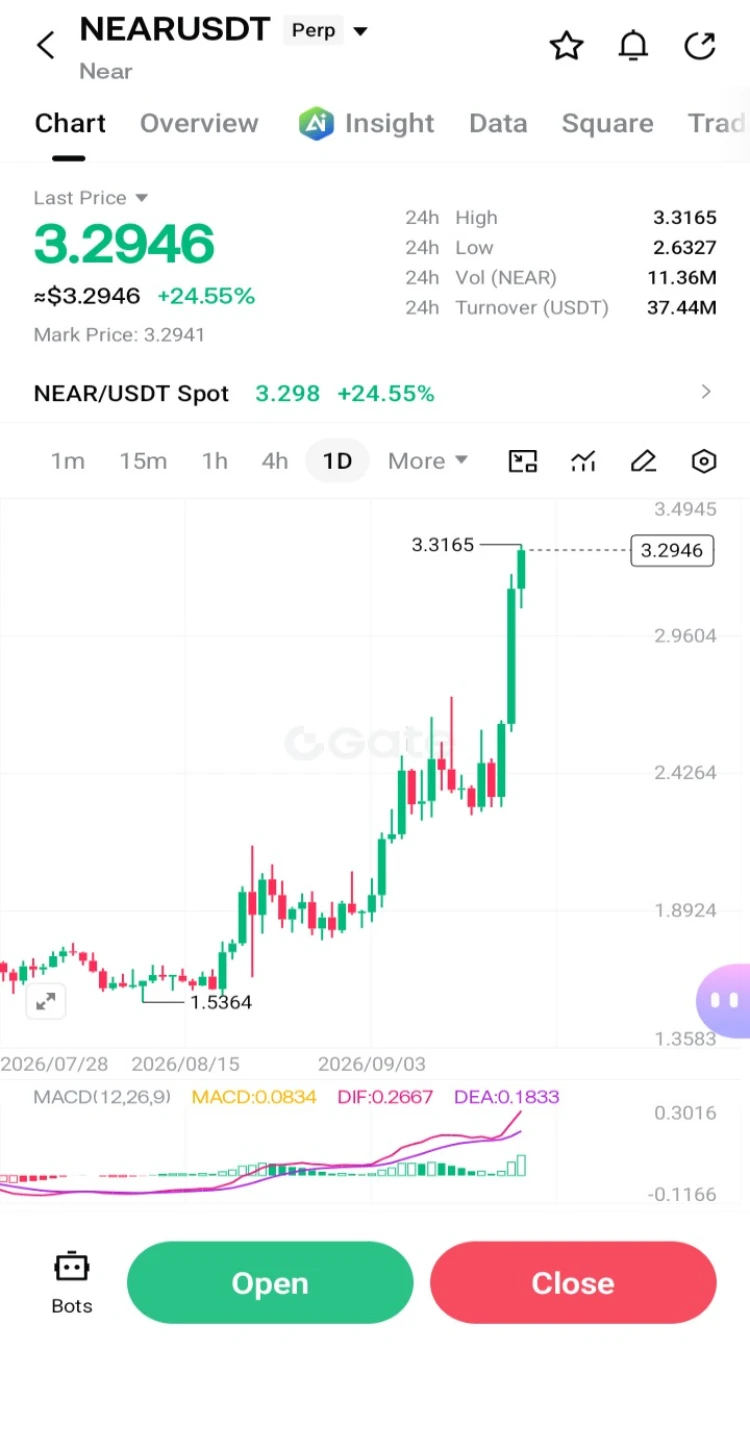
$NEAR Weekly Structure Remains Bullish
$NEAR is showing strength on the weekly chart, with price attempting to reclaim the key blue resistance line.
If the breakout is confirmed and the level holds as support, the next longer-term areas to watch are $3.36 and $3.93.
Confirmation matters — a failed reclaim could bring another retest of lower support.
#GateTopsStockPerpetualCoverage #GateTrenchesExclusive0GasTrading #WhereToParkStablecoinsWhileWaiting #ShareWeekly
post-image
NEAR+1.30%
  • 12
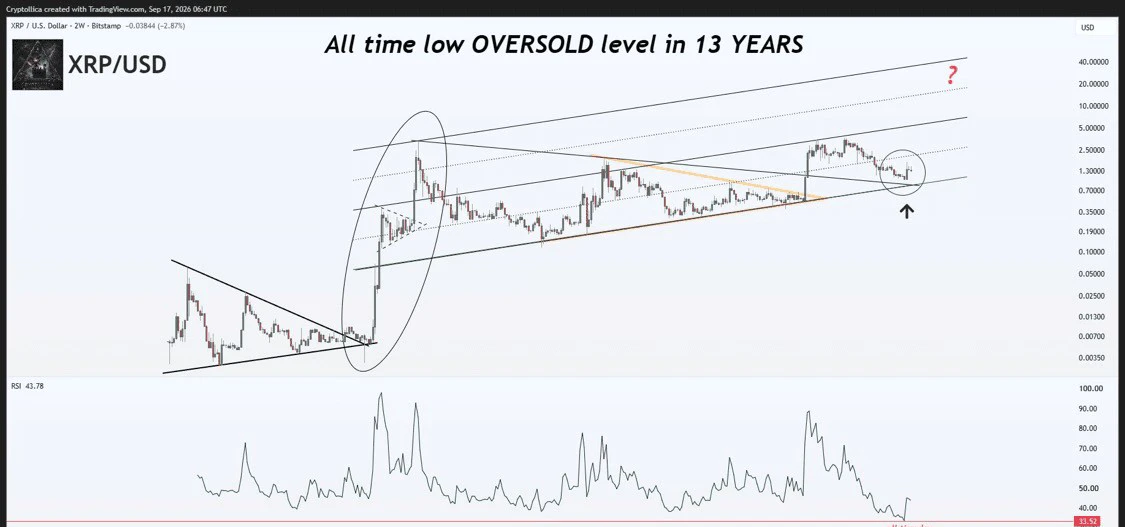
XRP: The Setup Most Traders May Be Overlooking
$XRP has just printed one of its lowest two-week RSI readings in its 13-year history — below levels seen during the 2018 bear market, the 2020 COVID crash, and the 2022 market downturn.
Yet despite this extreme momentum reset, XRP is still holding above its long-term rising structure that has remained relevant across multiple market cycles.
That divergence is worth watching.
Sentiment has been heavily damaged, momentum has been flushed out, and many traders are already treating the current weakness as a sign that the XRP story is over.
But histor
post-image
XRP-1.12%
  • 10
  • 1
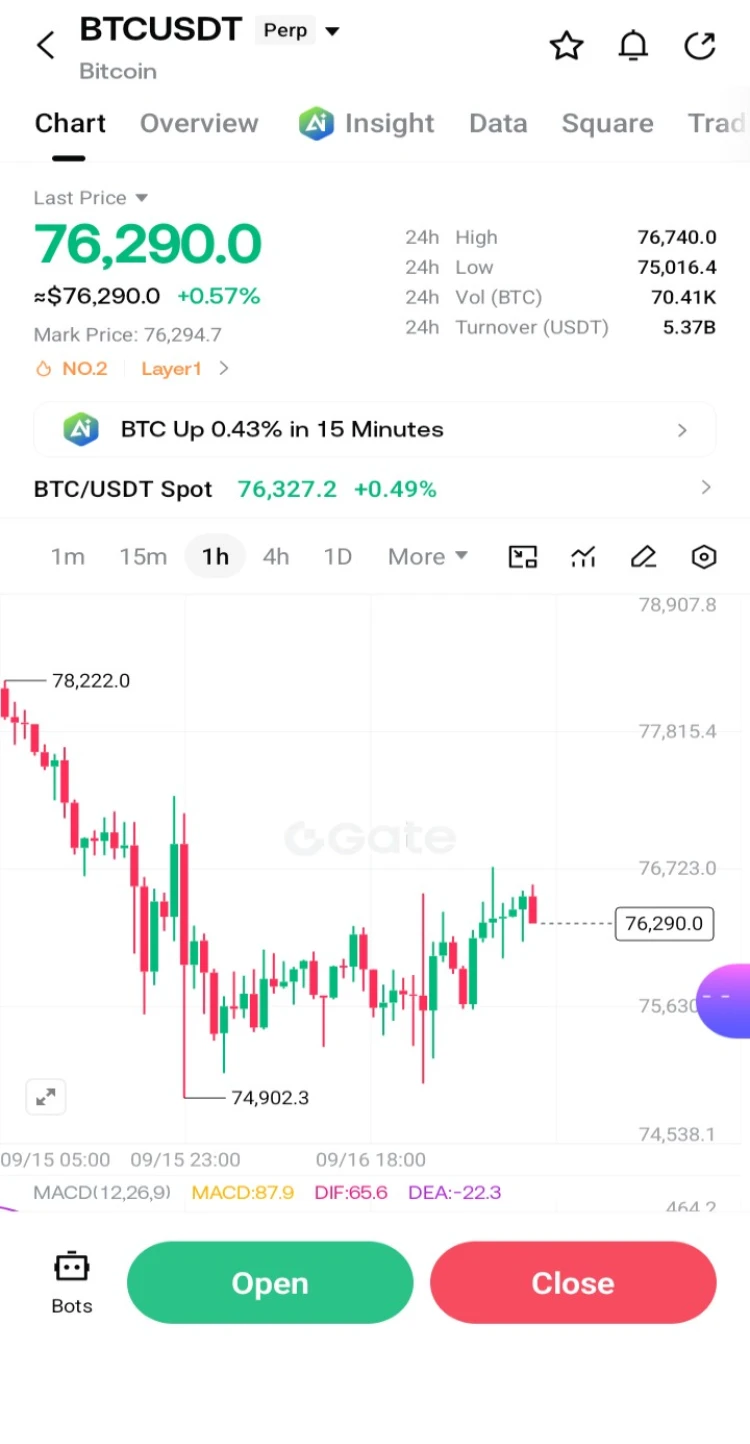
🚨 $BTC — BUYERS ARE TRYING TO TAKE CONTROL AGAIN 📈
BTC is trading around $76,200, recovering from the recent dip toward $75K.
I’m watching the current zone for a short-term upside move, but the key is whether buyers can hold above $76K and push through the nearby resistance.
🟢 LONG ENTRY: $76,000 – $76,300
🛑 SL: $75,400
🎯 TP1: $76,600
🎯 TP2: $76,900
🎯 TP3: $77,300
These targets are kept close so the move can be managed step-by-step.
⚠️ If BTC loses $75,400, I’d step away from the setup.
$76K is the battle zone — let the price action confirm the next move. 👀
DYOR & manage risk.
#GateTr
post-image
BTC-0.67%
  • 10
  • 2
$BCH is showing a bullish market structure, with price forming a clear Higher High and Higher Low sequence.
Price is currently around the 220 area, while the key demand zone sits between 212–208.
I’m watching this zone for a potential long, but I won’t enter blindly. The setup needs a clear bullish rejection and confirmation from the demand area first.
Trade Setup: Direction: LONG Entry Zone: 212–208 Target: 305 Confirmation: Bullish rejection from demand
Structure first. Confirmation second. Entry third.
#16FedOfficialsExpectAnotherHikeThisYear #ShareWeekly
BCH+0.95%
  • 6
  • 1
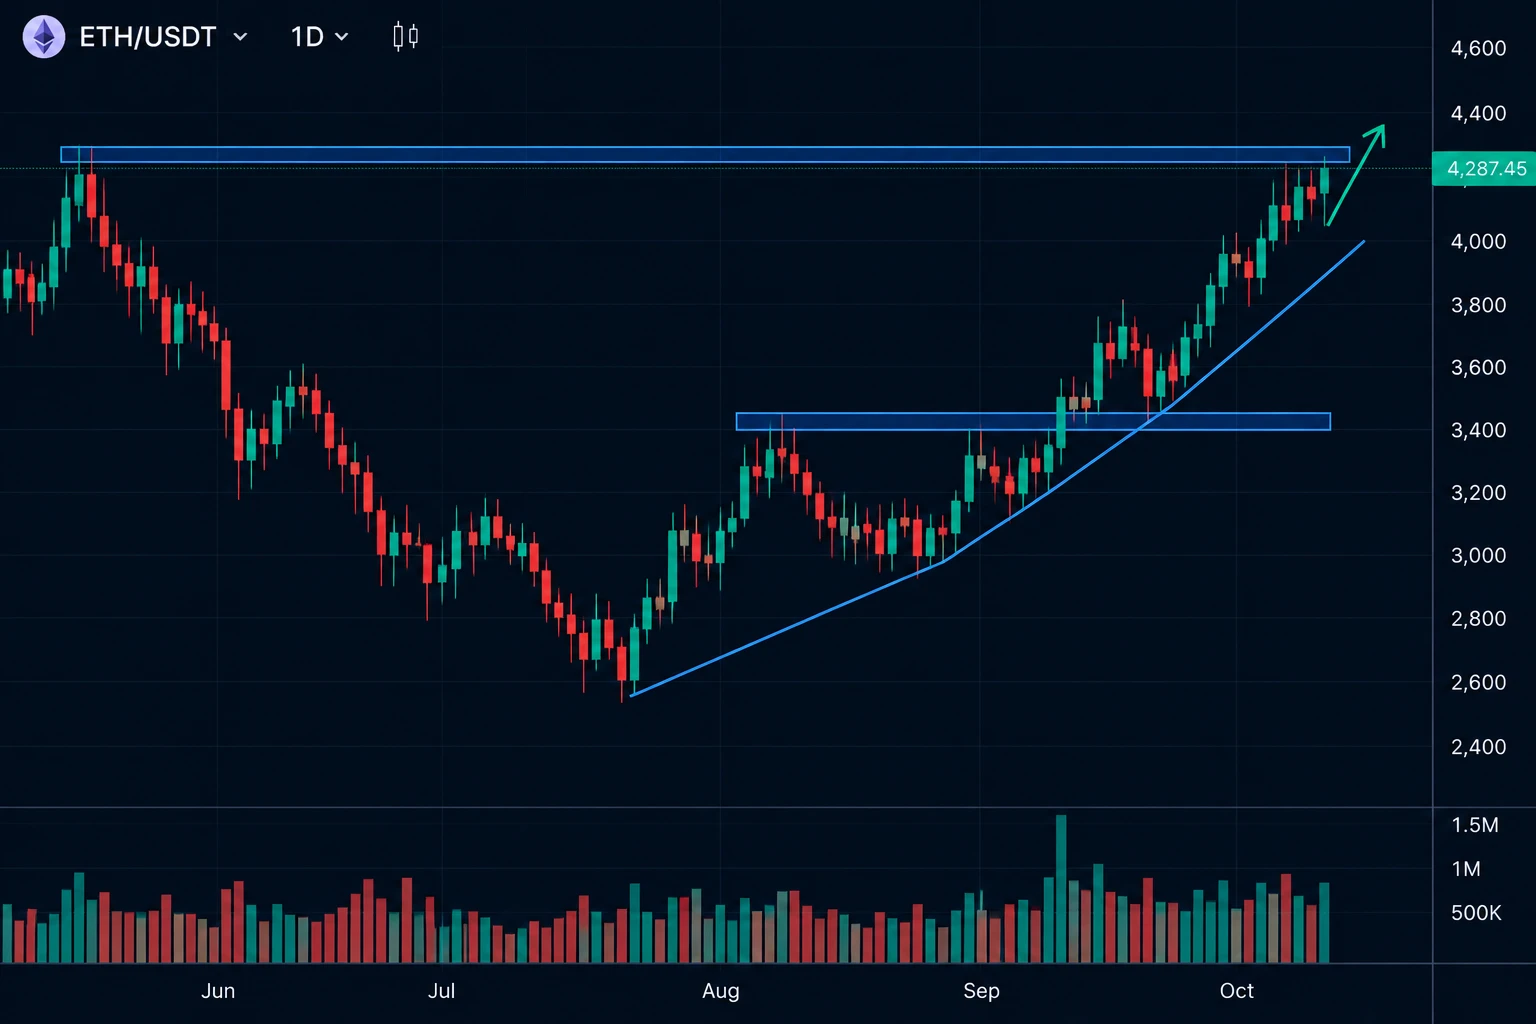
I don’t want to be fully positioned before the market confirms its direction.
If the market turns bullish, $ETH would be one of the assets I’d watch for confirmation and potential rotation from stablecoins.
My approach would be simple:
→ Keep part of the portfolio in stablecoins
→ Start with a smaller $ETH position after confirmation
→ Add gradually if momentum continues
→ Keep some liquidity in case the breakout fails
I’d rather miss the first part of a move than risk deploying everything before the trend is clear.
What would make you start moving stablecoins into $ETH?
#ShareWeekly #WhereT
post-image
ETH-1.23%
  • 4
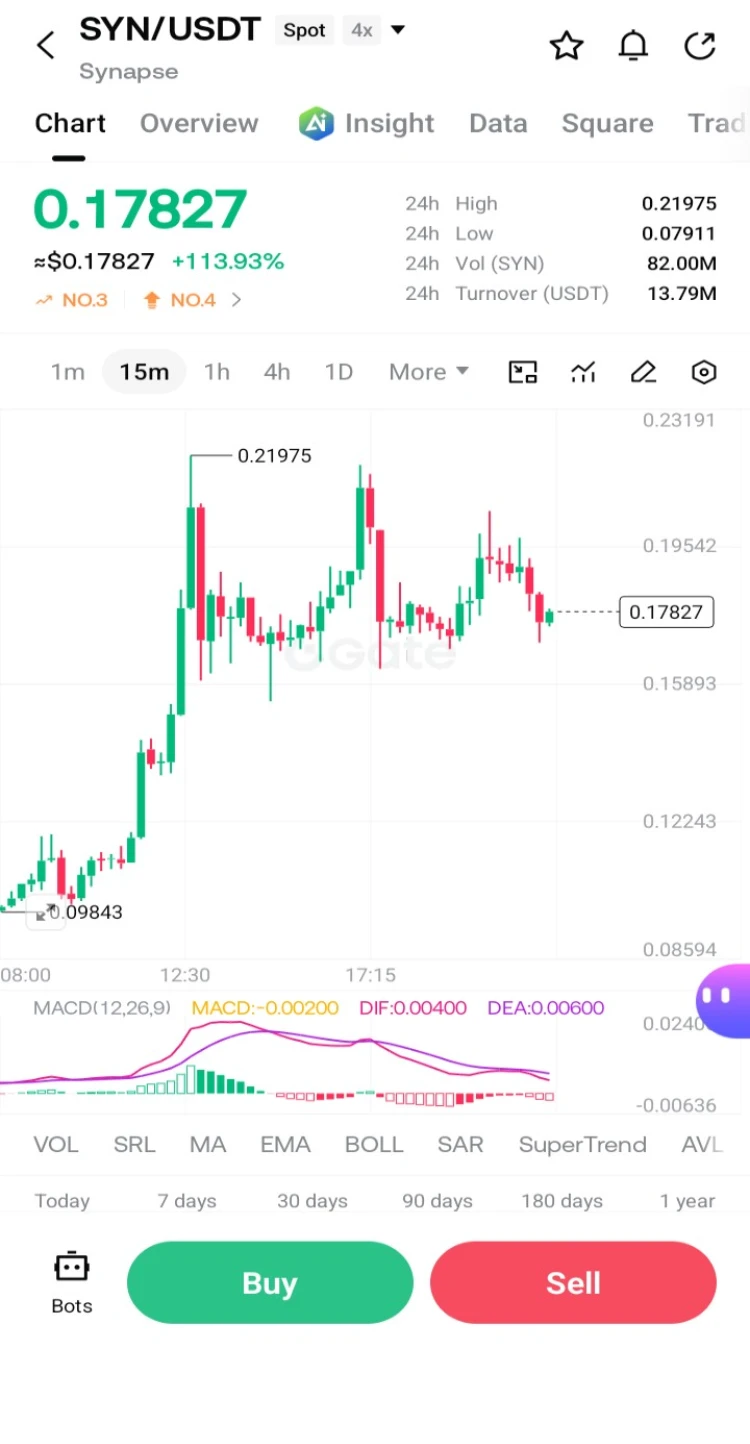
$SYN is making a massive move, trading around $0.17–$0.18 after a sharp volume-driven rally. Price has already tested the $0.21 area, so volatility is extremely high right now.
The key zone to watch is $0.17. Holding this area could keep buyers in control, while a deeper rejection may trigger a fast pullback.
After such a vertical move, chasing candles can be risky — confirmation matters.
#ShareWeekly #FOMCMeetingAnalysis
post-image
SYN+1.57%
  • 6
  • 1
$ZIL — BUY & HOLD
ZIL is back on my watchlist as momentum starts building around a potential breakout zone.
The key is simple: let price confirm the move. A clean break and hold above resistance could open the door for a stronger upside move, while failed momentum would keep ZIL in consolidation.
Entry: Current market / pullbacks
Targets: Scale out into strength
Stop Loss: Below key support / invalidation
Leverage: Keep it low
Risk: Manage your position carefully
Plan: Buy → Hold → Wait for confirmation → Take profit in stages.
No FOMO. Let the chart confirm the move.
#GateSquareMidAutumnReun
ZIL-4.12%
  • 7
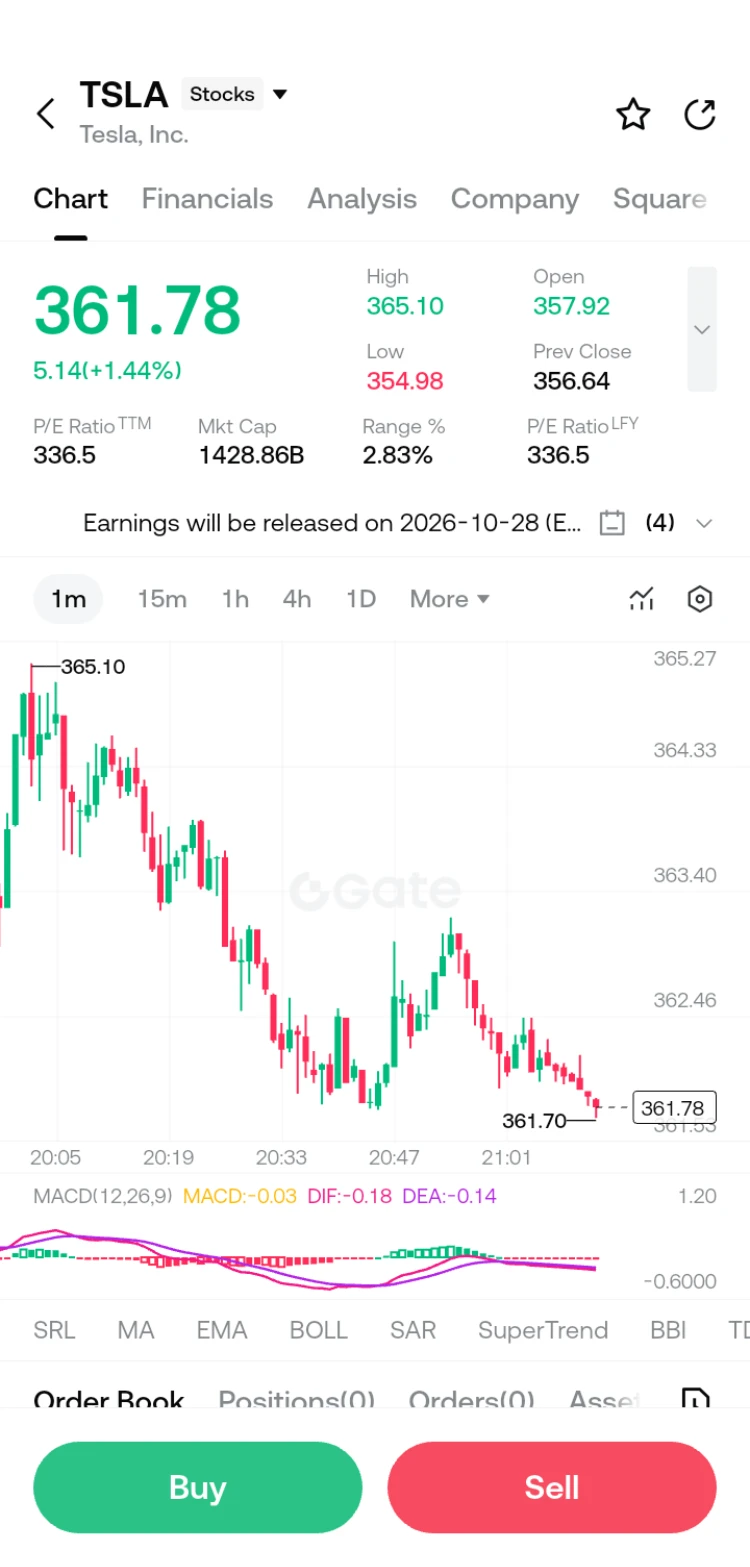
🚘 $TSLA THE CHART IS AT A DECISION POINT 👀
Tesla is trading around $356.6, sitting close to the lower side of its recent range.
Right now, I’m watching the $354–$355 area closely. Buyers need to defend this zone if they want to shift the short-term structure back upward.
On the other side, $369–$379 remains a major area where sellers could appear again.
So for now, I’m not chasing either direction.
📌 Below $354: weakness could accelerate.
📌 Above $369: momentum would start looking stronger.
📌 $354–$369: expect the range to remain the main battle zone.
The chart is compressed — the next c
post-image
TSLA-1.34%
  • 4
  • 2
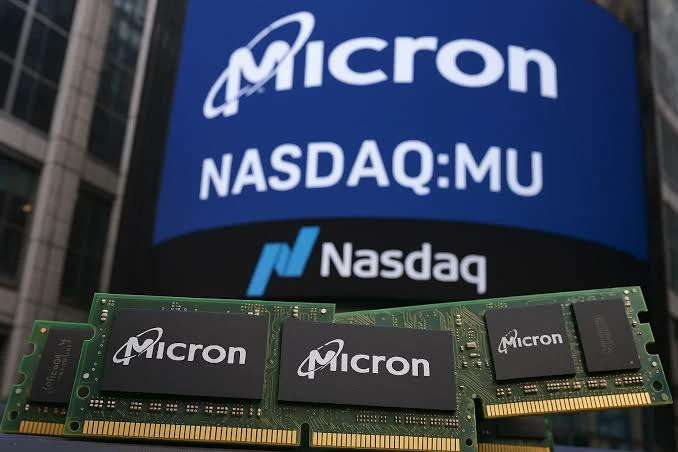
$MU is showing some weakness in the short term.
Price was rejected at horizontal resistance and has now broken the local uptrend. The structure is starting to shift, with a potential lower high taking shape.
For now, momentum looks cautious. I’d want to see how price reacts around the next key support before expecting a clear directional move.
#MemeTokensPullBackAcrossChain
#ShareWeekly
#FOMCMeetingAnalysis
post-image
MU-6.21%
  • 4
  • 3
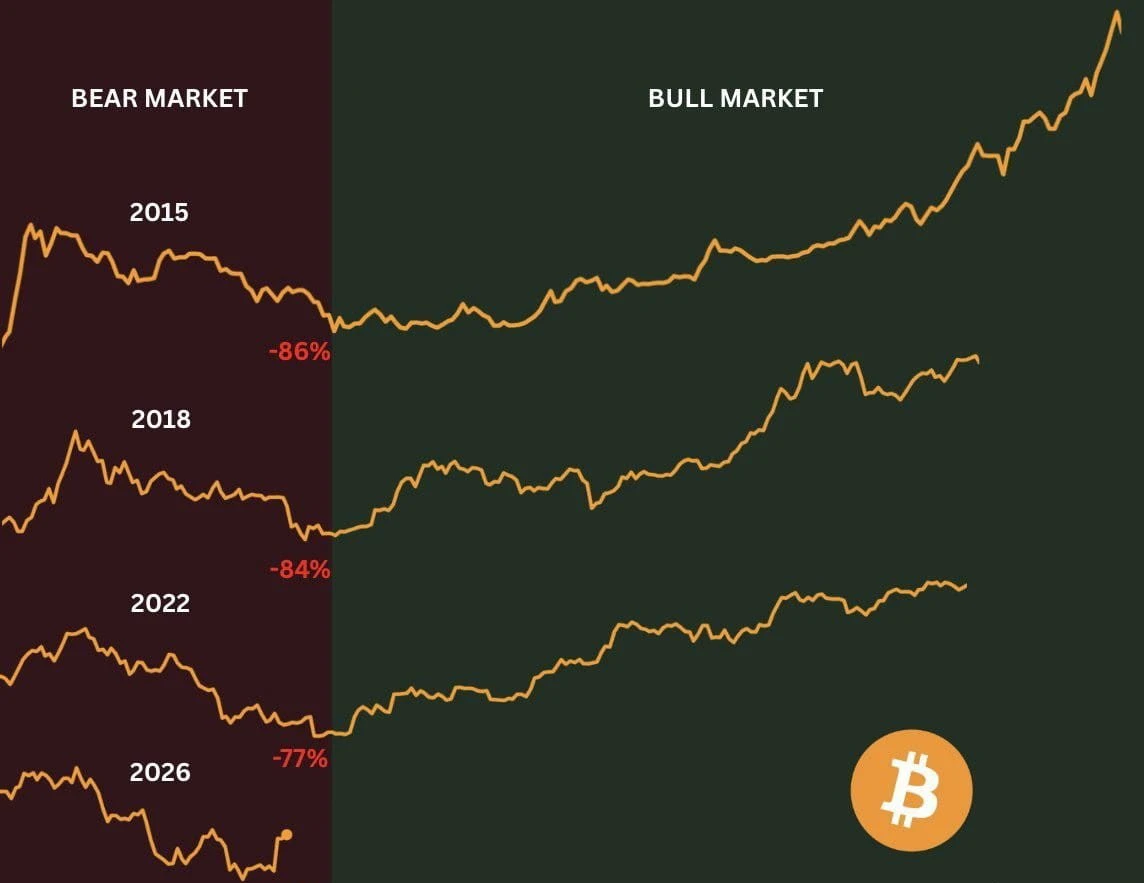
After nine years in crypto, I thought I had become used to Bitcoin’s volatility.
This cycle proved otherwise.
A potential 54% drop from the top would make this one of the toughest drawdowns I’ve experienced. Not because the numbers are unfamiliar, but because the emotional weight feels different this time.
Watching $BTC reach around $120K and then lose momentum has been frustrating. The market can test your patience in ways a chart never shows.
For me, the answer has never been to chase leverage or react to every red candle. It’s about keeping position size under control, staying in spot, and
post-image
BTC-0.65%
  • 5
  • 1
FOMC DAY 1 — THE MARKET IS ALREADY REPRICING RISK
The probability of a rate hike is still being heavily watched, yet banks benefiting from higher interest-rate spreads haven’t shown much strength.
That’s interesting.
Today is only the first day of the FOMC meeting. The actual rate decision and updated dot plot come tomorrow, so the market has not fully priced in the Fed’s updated projections yet.
So far, the market appears to be pricing in the rate decision itself — but the bigger question is what the dot plot says about the path ahead.
If the Fed comes across more hawkish than expected, I’d e
post-image
BTC-0.67%
  • 8
  • 2
Load More