Square
Following
Hot
News
Notifications
Profile
Share your thoughts
placeholder
Article
$HANA Up 12% in 24 hours, currently at 0.0155, but I’m still sitting on an unrealized loss of -8% in my account—that’s the difference between chasing a pump and getting in early. Today’s move from 0.0132 to 0.0161, with a trading volume of 4.6M, isn’t that large—a typical small-cap pump pattern. My plan: I’m not chasing at the current price; I’ll wait for a pullback to the 0.0142-0.0145 range and buy in batches, keeping my position under 15% of total capital. Stop-loss at 0.0130 (if it breaks below the previous low, I’m out immediately), first take-profit at 0.0168, second target at 0.0185. Tw
HANA-3.22%
$Jct up 10x
$Hana same alpha same chart bottomed out ready for 100-500% still a lot will miss
Easy trade after JCT
JCT-3.26%
HANA-3.22%
Trenches
ZIG
Z
bade
b
ZIG
0x8c...1145
Market Cap
$.
Change
.
24h Vol
$.
Holders
.
STONK
S
bade
b
STONK
6GmA...UNgx
Market Cap
$.
Change
.
24h Vol
$.
Holders
.
CLAUDIA
C
bade
b
CLAUDIA
2j5S...W2ZM
Market Cap
$.
Change
.
24h Vol
$.
Holders
.
IDOL
I
bade
b
IDOL
0x3b...ab07
Market Cap
$.
Change
.
24h Vol
$.
Holders
.
FLOAT
F
bade
b
FLOAT
Bv1a...BMmr
Market Cap
$.
Change
.
24h Vol
$.
Holders
.
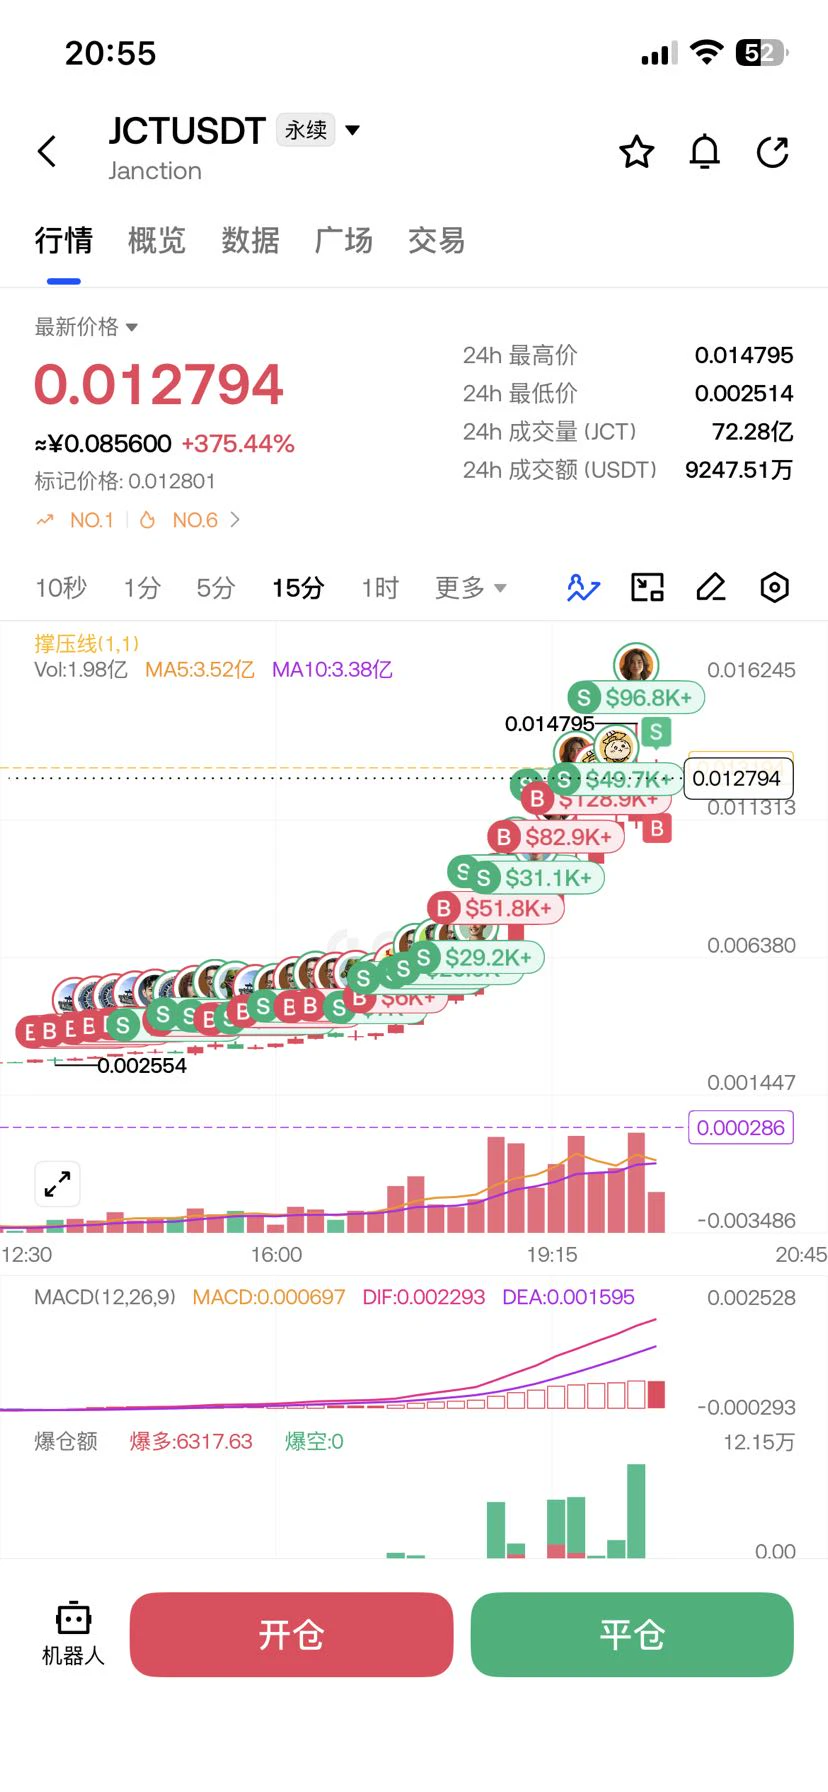
$JCT Up nearly 400%… short sellers get crushed

JCT’s move is truly wild. The price surged from 0.002512 to 0.011798, up nearly 370% from its low! As the rally continued, our earlier short strategy failed, and the stop-loss at 0.0100 was hit. Buying pressure was tremendous, and the price kept climbing, inflicting heavy losses on early short positions. JCT is now pulling back from its recent high, but volatility remains extreme. The sharp rally and devastating blow to short sellers are another reminder of how unpredictable the crypto market can be. $JCT
post-image
JCT-3.26%
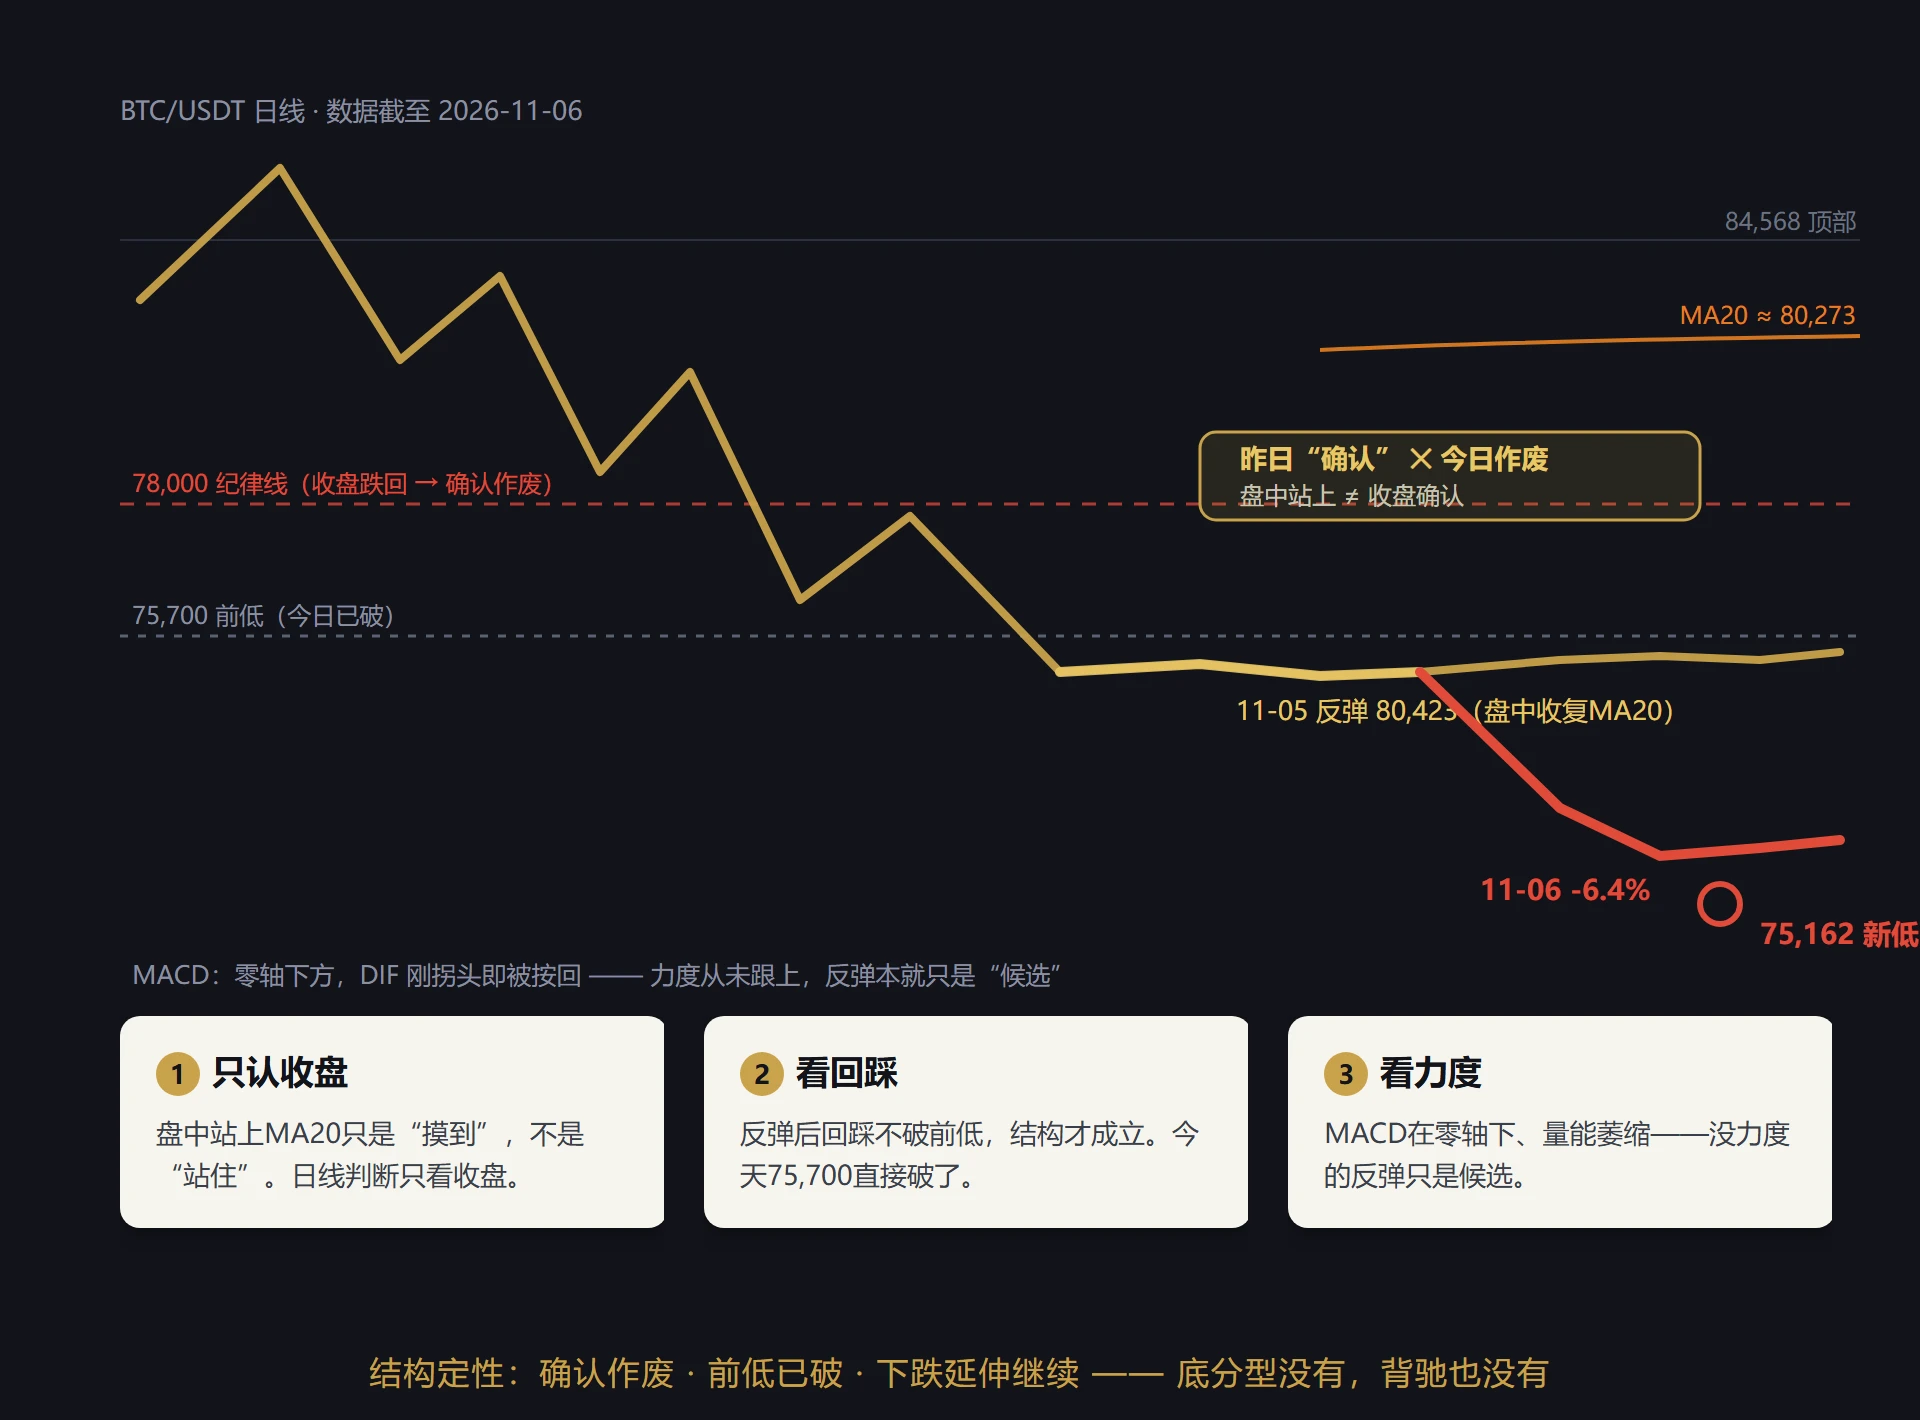
Before the weekly close: Where has this large bearish candle taken the structure?

Draw the chart first, then talk.

This week, a nearly full-bodied bearish candle swallowed the entire August–October high-level consolidation range, with a range exceeding 7%. The weekly candle has not closed yet, but its pattern can already be read: the pattern can be read, but the outcome cannot.

On the daily chart, previous lows have been broken one after another—first, second, and third levels. The current rebound is only a minor repair, and price is still below the discipline line drawn last week. There is
post-image
BTC-0.65%
$PI I want to buy a little, but I don't dare
post-image
PI-0.60%
  • 3
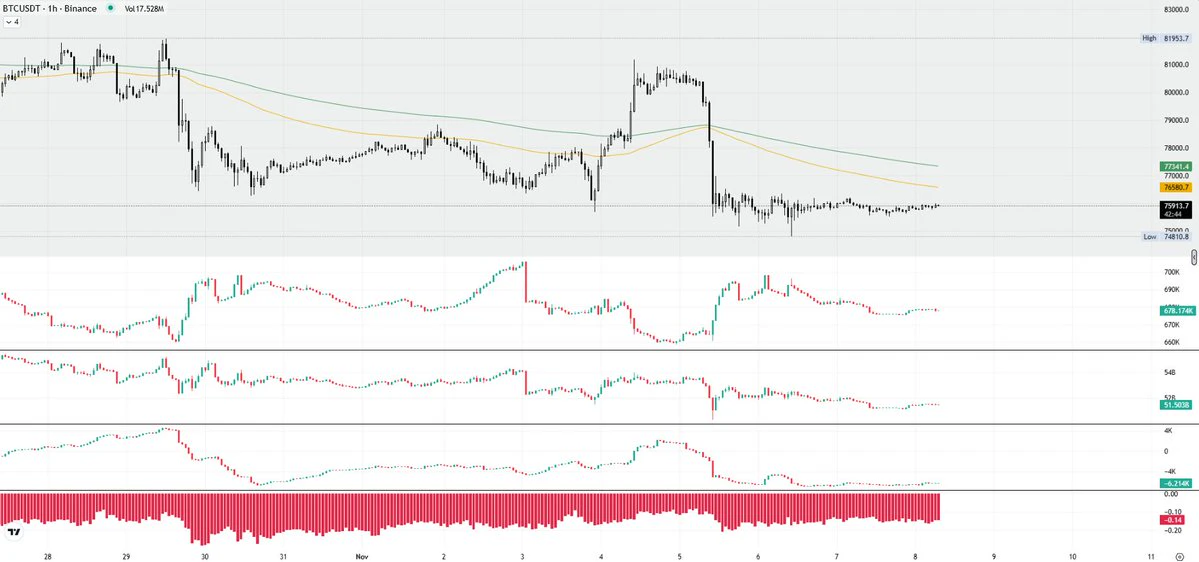
This is the calmest weekend ever for $BTC
Literally a stable coin this weekend with no liquidation wicks
MM and CEX are too worried restructuring to meet EU and US compliances
Democrats sweeping Congress signaling much harder regulations might be the reason
Wouldn't it be nice if regulations become so hard again against market manipulations?
You miss Gensler now after the brutal 2026 don't you?
Will make a market update today for subscribers. Until then stay safe. Don't get liquidated and extracted on shitcoins before the actual bull market begins
post-image
BTC-0.65%
The tricky thing about recession signals is that they never arrive with a big announcement—employment is still steady, and consumer spending is still holding up. By the time the data really turns, the market has already taken a full leg down. Fear is the time to buy; optimism is the time to sell. That’s where human nature gets in the way. What leading indicators have you seen changing lately?
post-image
· Cyber Buys Back $13M in CYBER
live-cover
LIVE2,219
#AIOT

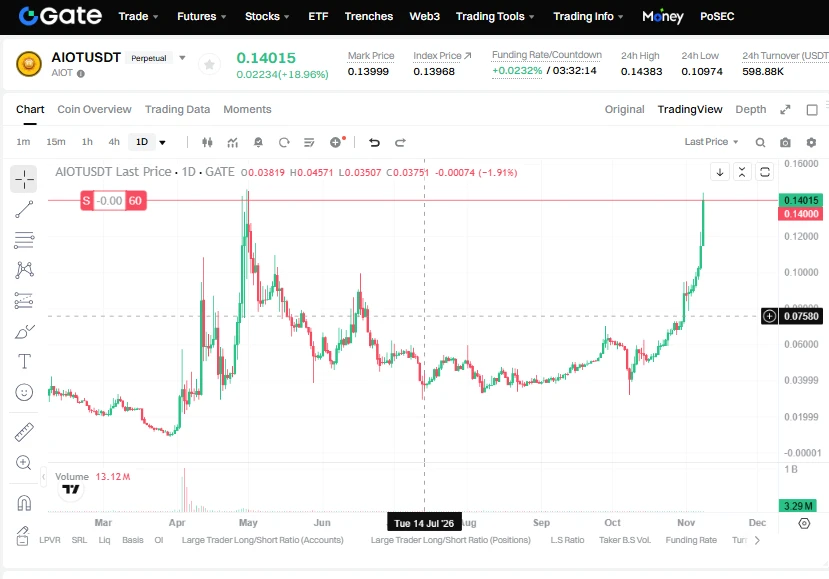
AIOT Jumps 27.5%: Understanding the Rally, Market Activity and What Investors Should Watch

1. The Number That Deserves Attention

AIOT/USDT recorded a 27.5% increase in 24 hours, reaching $0.14064, with approximately $1,013,315 in trading volume. These figures represent the market snapshot provided for November 8, 2026, at 11:22 UTC.

A move of this size naturally attracts attention, but the important question is not simply how much the price has increased. It is whether the buying activity can continue and what risks could reverse the move.

2. First, Understand What AIOT Repres
post-image
AIOT-1.80%
Started with 2500u in principal on Sesame
Currently deposited 1000u
Another 1500u needs to be deposited
Target: 20u per day
Starting now, November 7
23 days remaining
Target: 460
Completed: 0
$JCT Can we go short now
post-image
JCT-3.26%
$AGT Now at 0.0293, up nearly 15% in 24h, but I’ve only kept my core position—I entered at 0.0268 yesterday and just took profit on 70% at 0.0306. I moved the stop on the rest up to 0.0278 to lock in breakeven; for now, I’m taking some gains off the table.
Plan from here: scale back in between 0.0272 and 0.0278 on a pullback, starting with a 30% position; stop out unconditionally if it breaks below 0.0258 (above today’s low). If it breaks straight through the previous high of 0.0309 on strong volume, I’ll chase with a 20% position, target 0.0345, with a stop at 0.0295. Maximum position size:
AGT-26.77%
$BANK & DIM777 & BTC & DIM777 & LTC & DIM777 & GT
in Alpha
BANK-1.17%
Most vault launches I see are a deposit button and a countdown. @atoma_fi is framing this one differently, and it's worth a few minutes.
They call it Convergence: a long-running effort to grow Atoma's infrastructure, its capital base and its ecosystem, split into three chapters. Chapter I, Formation, is live now. Chapters II and III haven't been revealed, so I have nothing to say about them and won't pretend otherwise.
Formation opens with the Genesis Points Boost. Whatever USDC you hold in either vault at the 14 Nov 00:00 UTC snapshot earns boosted Atoma Points until 7 Dec.
After that, Forma
post-image
USDC+0.01%
ZRO’s 0.6% Rise: Why LayerZero’s Bigger Developments Matter More Than Today’s Price

The Myth: A Green Candle Confirms a Bullish Trend

A common market mistake is treating every positive daily move as proof that buyers are taking control. ZRO is a good example of why that assumption can be misleading. A price increase is encouraging, but one green 24-hour reading cannot confirm a lasting trend, a breakout, or a change in market direction.

The more useful approach is to examine three things together: price movement, trading activity, and developments within the project. ZRO has several impo
post-image
ZRO-2.59%
Gate Square Stock Talk Season: Share Your Views, Win GT and Stock Rewards https://www.gate.com/campaigns/6898?ref=VLARBF1YAG&ref_type=132
post-image
GT-2.41%
$EVAA Down 16% in a day—this isn’t a pullback, it’s a slaughter. It’s currently at 1.2460, with a 24h low of 1.2224 and trading volume of 26.1M. The selloff on high volume suggests some are scrambling for the exits, while buyers are putting real money in.
First, let’s clarify the macro picture. This crypto pullback isn’t happening in isolation: hawkish Fed minutes have pushed back rate-cut expectations, and rising real interest rates are directly weighing on risk-asset valuations. Quantitatively, BTC’s correlation with the Nasdaq has held in the 0.6–0.7 range over the past three months, while
EVAA-0.49%
BTC-0.67%
NAS100+1.90%
  • 4
$400B wiped from Crypto during "UPtober" and "Moonvember."
post-image
  • 1
  • 1
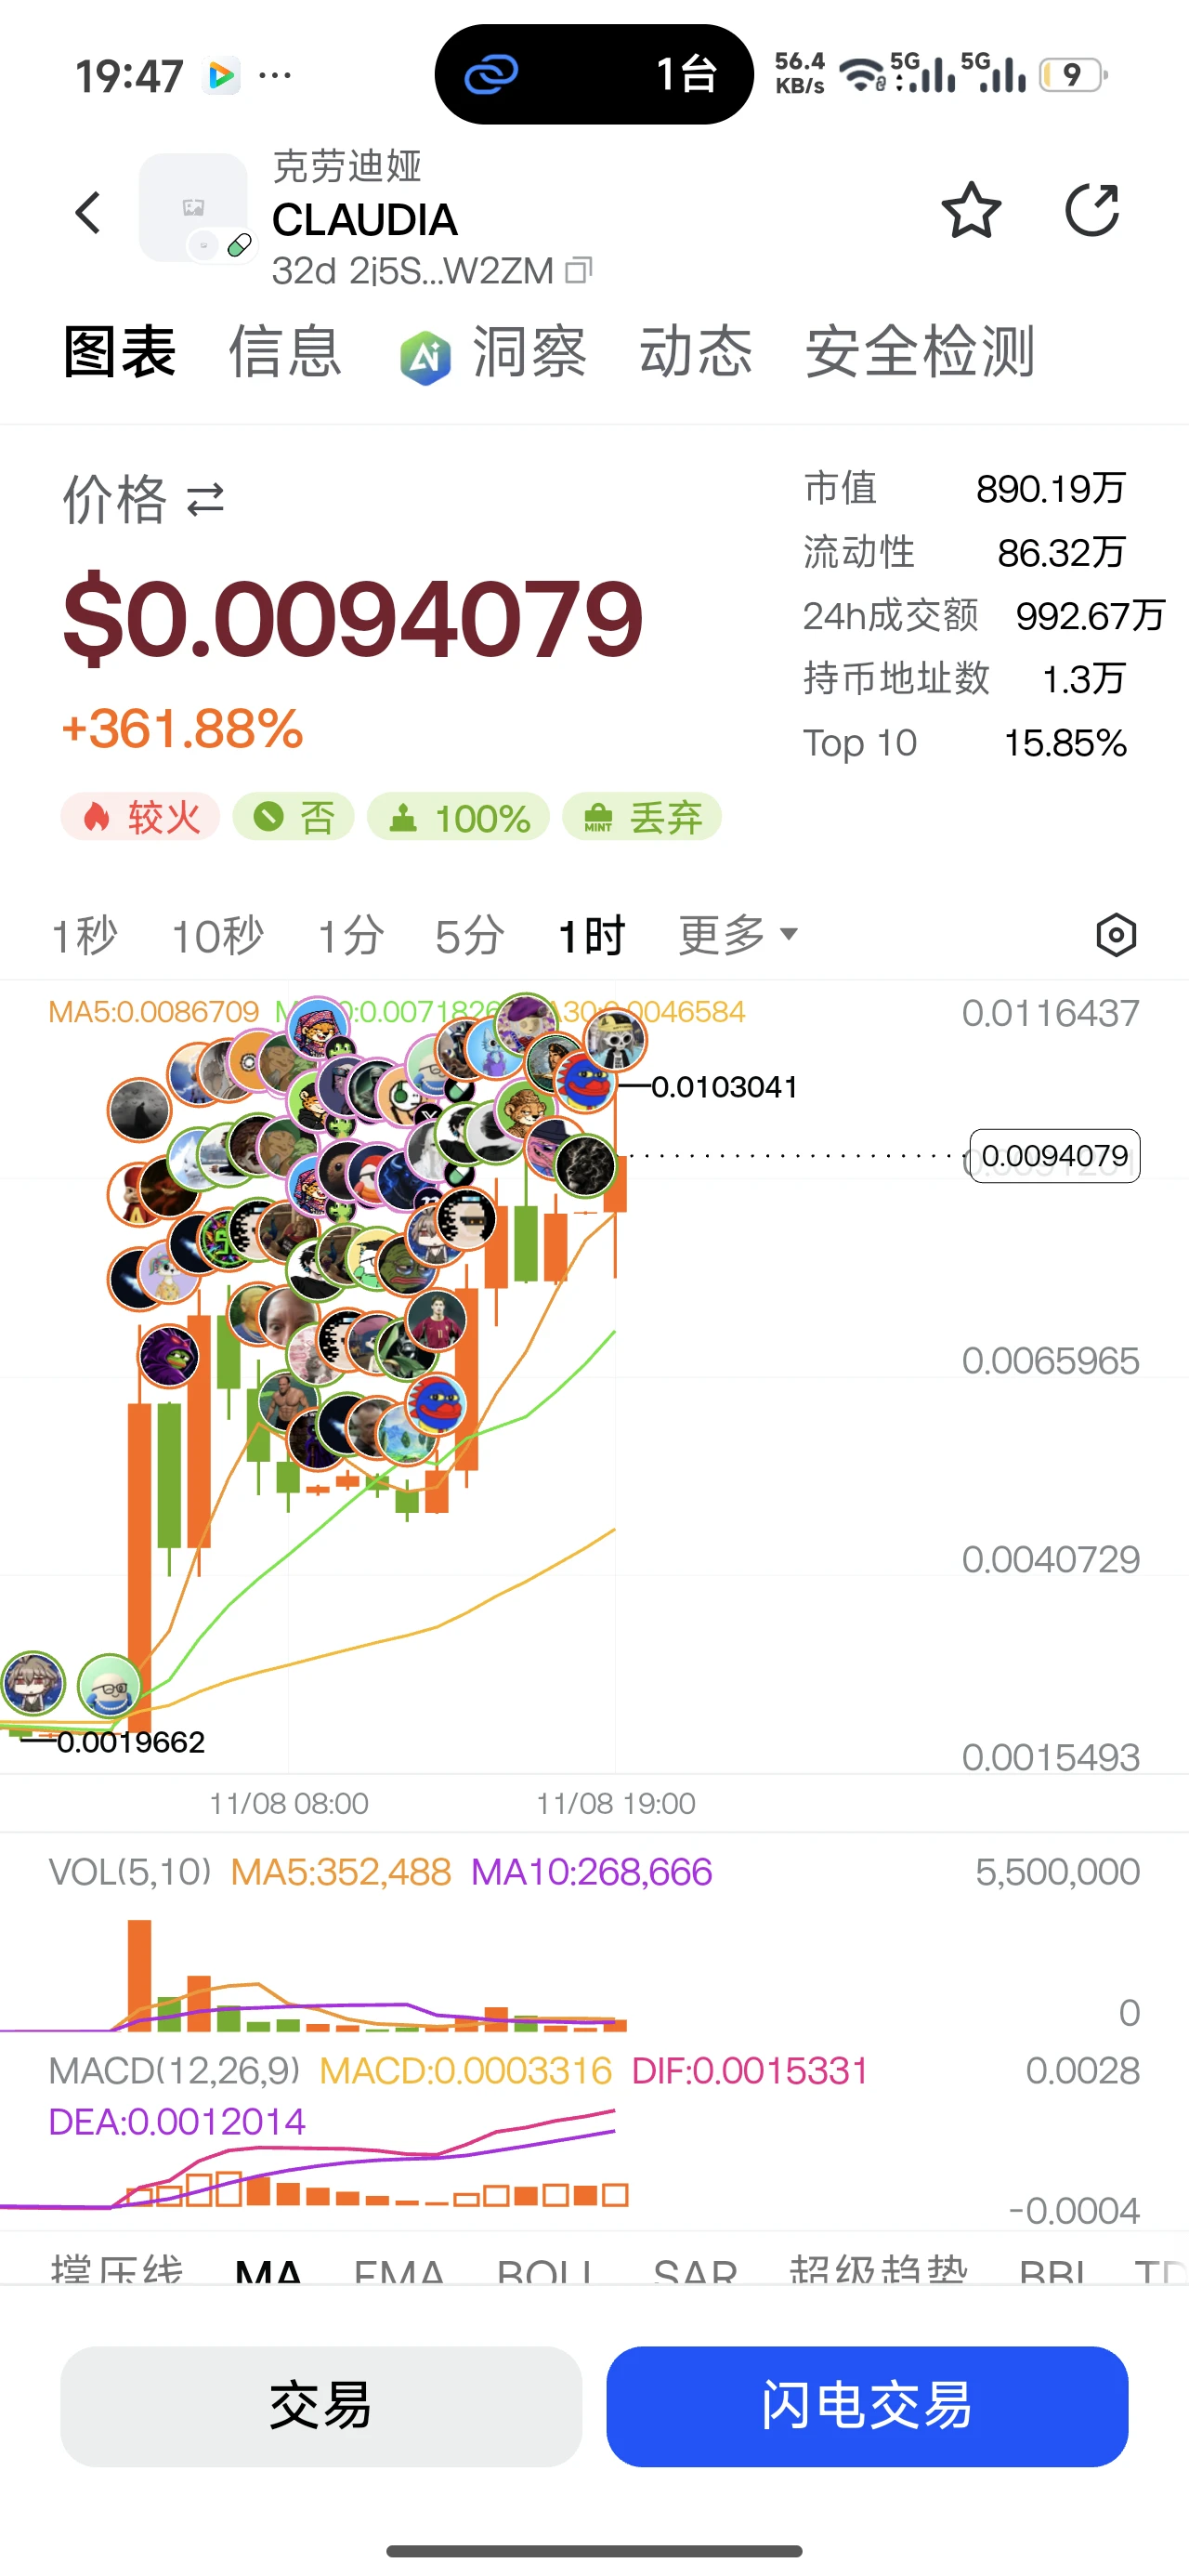
$CLAUDIA Aren’t you running yet
post-image
Load More

Join 40 M users in our growing community

⚡️ Join 40 M users in the crypto craze discussion

💬 Engage with your favorite top creators

👍 See what interests you

Trending Topics

USCPIDataIncoming

8.12k Views1.57k Discussing

The U.S. October CPI report will be released on November 10 at 8:30 a.m. ET. September CPI came in at 3.7% year over year, and markets will be watching closely for signs that inflation is cooling, especially in core CPI. A softer-than-expected reading could strengthen rate-cut expectations, while hotter inflation may pressure risk assets through higher Treasury yields and a stronger dollar. How do you think this CPI print will move $BTC, U.S. stocks and gold?

USAIStocksHitHard

26.98k Views3.72k Discussing

USNonfarmPayrolls

50.32k Views4.46k Discussing

View More