Square
Following
Hot
News
Notifications
Profile
Share your thoughts
placeholder
Article
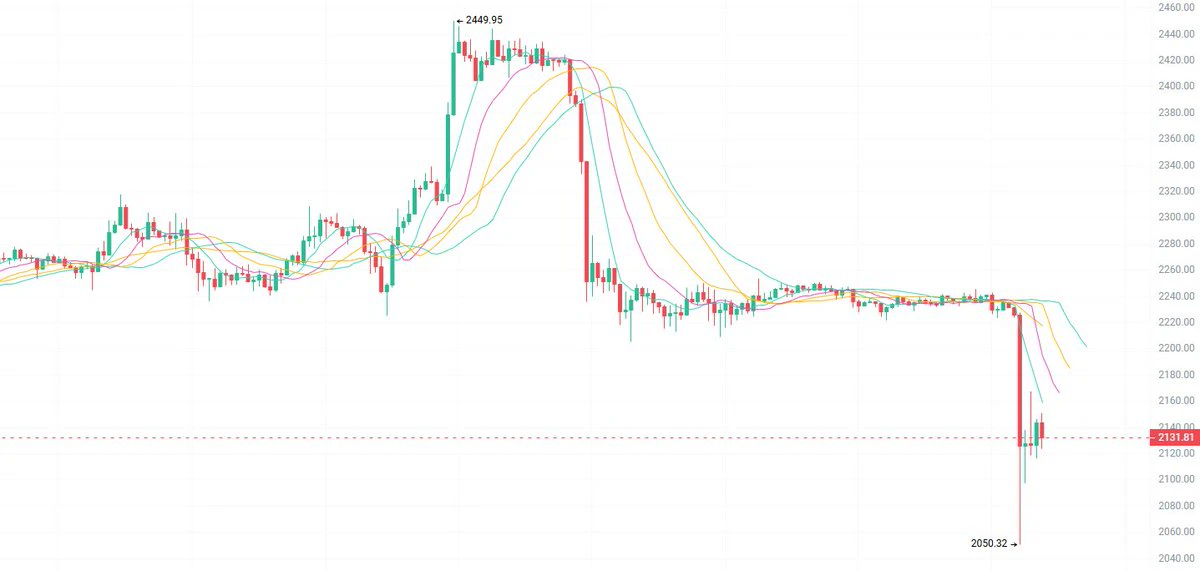
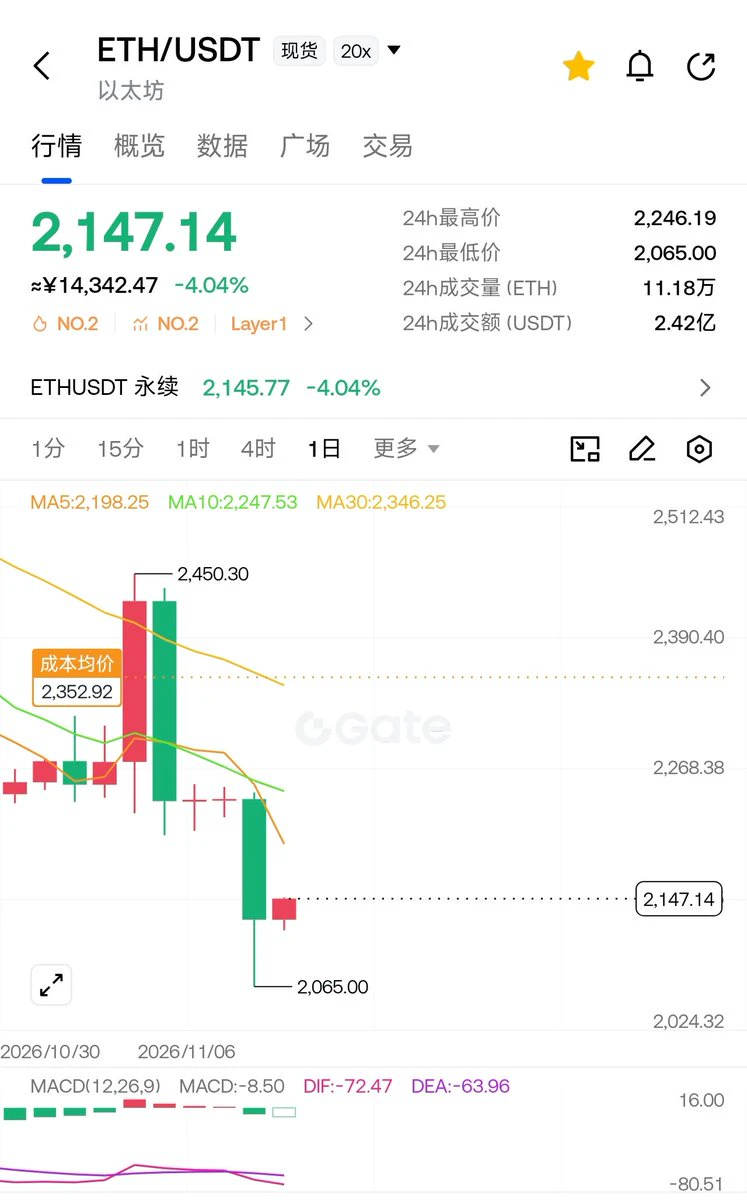
11.9 ETH: The rebound near 2150 is meeting resistance; consider a light short, targeting 2080/2050.
For those looking to go long, wait for support to hold near 2050 before entering. Stop at 2010; targets are 2120/2160.
On the 1H chart, price has plunged from the high of 2449, with a wick down to 2050. It briefly rebounded to around 2130, but the moving averages are fully aligned bearishly and diverging. The 2100 support level is being contested repeatedly, while 2160/2200 are resistance overhead. Bears still have the upper hand for now $ETH #ETH
post-image
ETH-1.26%
🔹Democrats Sweep Congress: Is a Major Shift Coming for Crypto? Tighter SEC Oversight and Prediction
live-cover
LIVE2,548
  • 1
Trenches
ZIG
Z
bade
b
ZIG
0x8c...1145
Market Cap
$.
Change
.
24h Vol
$.
Holders
.
BTC
B
bade
b
BTC
C5xp...pump
Market Cap
$.
Change
.
24h Vol
$.
Holders
.
STONK
S
bade
b
STONK
6GmA...UNgx
Market Cap
$.
Change
.
24h Vol
$.
Holders
.
ANSEM
A
bade
b
ANSEM
9cRC...pump
Market Cap
$.
Change
.
24h Vol
$.
Holders
.
CLAUDIA
C
bade
b
CLAUDIA
2j5S...W2ZM
Market Cap
$.
Change
.
24h Vol
$.
Holders
.
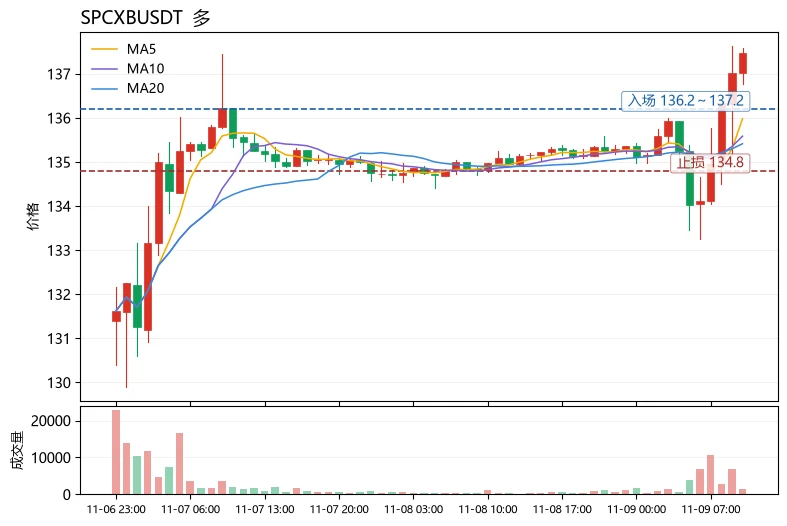
$SPCXB Current price 137.48, the upper Bollinger Band at 136.98 has been breached. MA5 (135.982) and MA20 (135.416) are in a bullish alignment, providing support. Key short-term support is at 135.4, with resistance around 138.5.

Looking at sentiment and correlations, the Fear & Greed Index is only 29, still in the fear zone, indicating the broader market has not entered an exuberant phase. BTC's influence is more structural than broadly market-wide. In this environment, capital tends to flow toward assets whose technical patterns have already turned stronger, and $SPCXB is one of them: MA5
post-image
SPCXB
SPCXBSpaceX
Four.meme
MC:$3.12KHolders:2
0%
QNT+4.79%
How to Set Stop-Losses Scientifically When Trading BTC?
In BTC trading, many people know the importance of stop-losses but still don't know where to place them. Set one too close, and a slight price move can stop you out; set one too far away, and if your judgment is wrong, you could take a significant loss.
So how should you set a stop-loss?
First, determine the stop-loss level based on your trading logic. When going long, pay attention to key support levels, previous lows, and price structure. If the price breaks below these levels decisively, the original bullish thesis may no longer be val
post-image
BTC-0.67%
Got it!
The idea is to hurry up and find a wife, then start a business together.
A modest annual income goal.
post-image
Bitcoin’s outlook for this week: 72,500 is not the bottom; I’m more inclined to expect another test of 71,000–71,400.
The Jiazi piece projected 73k based on a 10% drop from 81,490. This morning, spot hit a low of 73,510, already close to that level. But my view is not that “the target is almost here, so the decline is over.” Last week closed around 74,851, and 77,500 has been decisively lost; the bears have yet to give up control.
The Start of Winter ushered in the Ji-Hai month, when Hai water is in season. The Twelve Monthly Hexagrams move from the Bo hexagram in the Xu month to the Kun hexag
post-image
BTC-0.67%
  • 1
$ETH
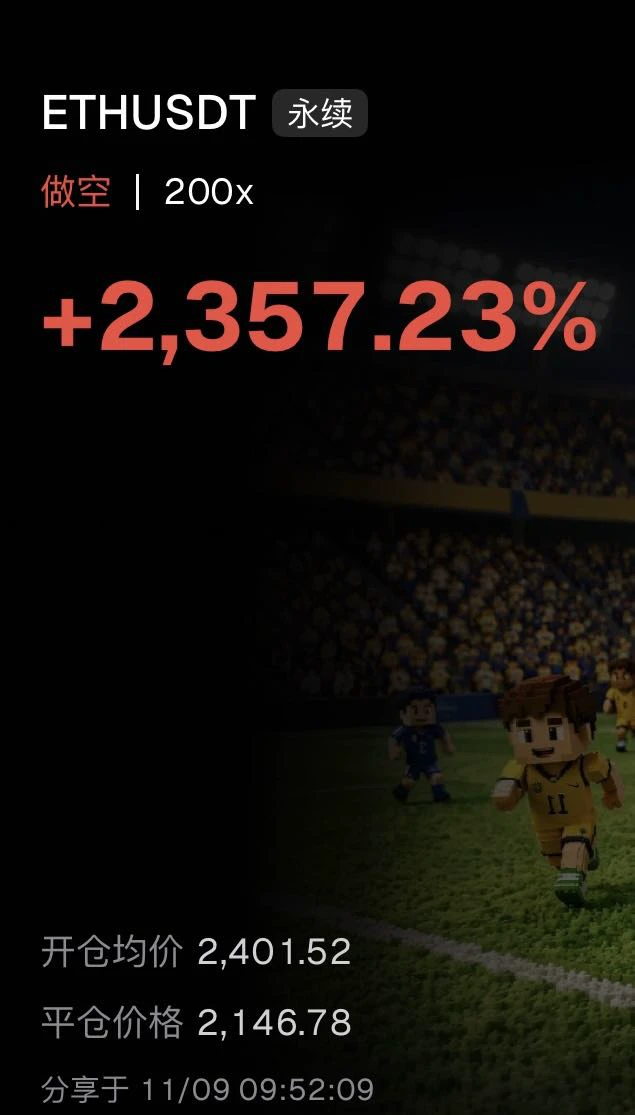
Another win in the bearish market, with a single trade returning 23x
The major downtrend channel fully opened up. We positioned short around 2401.52 on the rebound, trading with the trend. The market remained under pressure and continued to weaken, allowing us to take profit at 2146.78 and capture the full decline of over 250 points. The 200x leveraged short trade earned a 2357.23% return in a single trade.
#70%山寨币跌破200日均线
Support levels have been breached one after another, and the bearish trend is far from over. Every rebound is an opportunity to enter short at a higher level.
Identif
post-image
ETH-1.26%
#CPI数据前瞻 #WCTCS9 U.S. October CPI is expected to cool significantly, with the month-over-month increase roughly half that of September. The data will be released at 9:30 p.m. Beijing time on November 10.

Market expectations
Headline CPI: Up about 0.3% month over month, versus 0.6% in September.
Core CPI: Up about 0.2% month over month, the smallest increase in three months.
Year over year: Prices were not collected in the same month last year, so no year-over-year figure will be released this time; only the month-over-month figure will be available.

Why the outlook is relatively optimistic
P
  • 3
#WCTCS9

"Join us, Team No. 1, to achieve victories together towards the top with Gate."
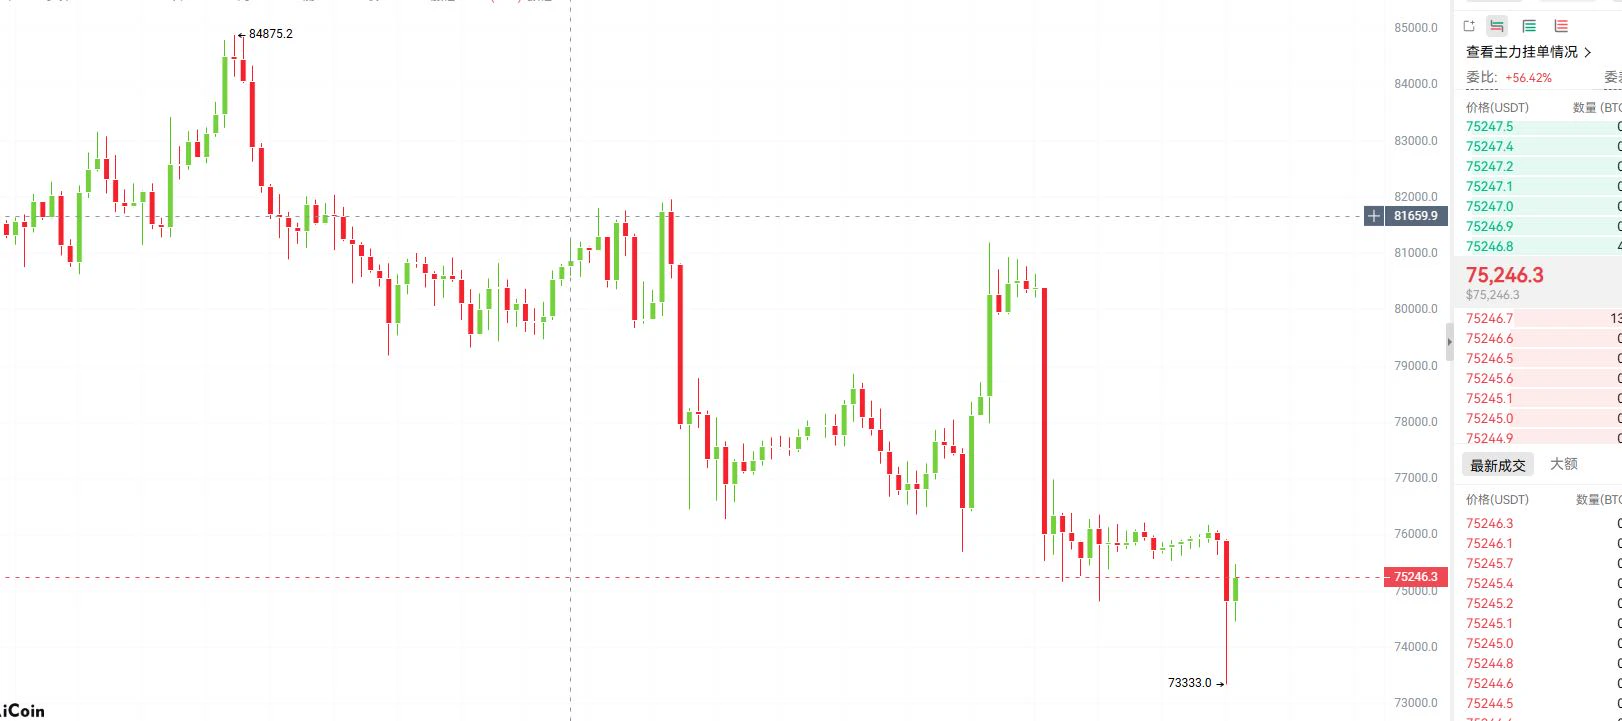
U Jie 11.9 Monday BTC $BTC Strategy
Entry: Short around 75500-75900
Stop-loss: Above 76500
Target: 74600-73500
A sharp, high-volume drop overnight sent BTC straight down through the 76200 consolidation range, with a brief wick to a low of 73500. Buying then triggered a V-shaped rebound, bringing the price back to around 75150 to consolidate. The contrast is clear: the sell-off came on high volume, while the rebound came on low volume. After concentrated selling pressure was released, buyers simply couldn't keep up. This rebound is only a technical correction after being oversold, not a revers
post-image
BTC-0.65%
Live Market Update
live-cover
LIVE1,354
Old Huang cheats,
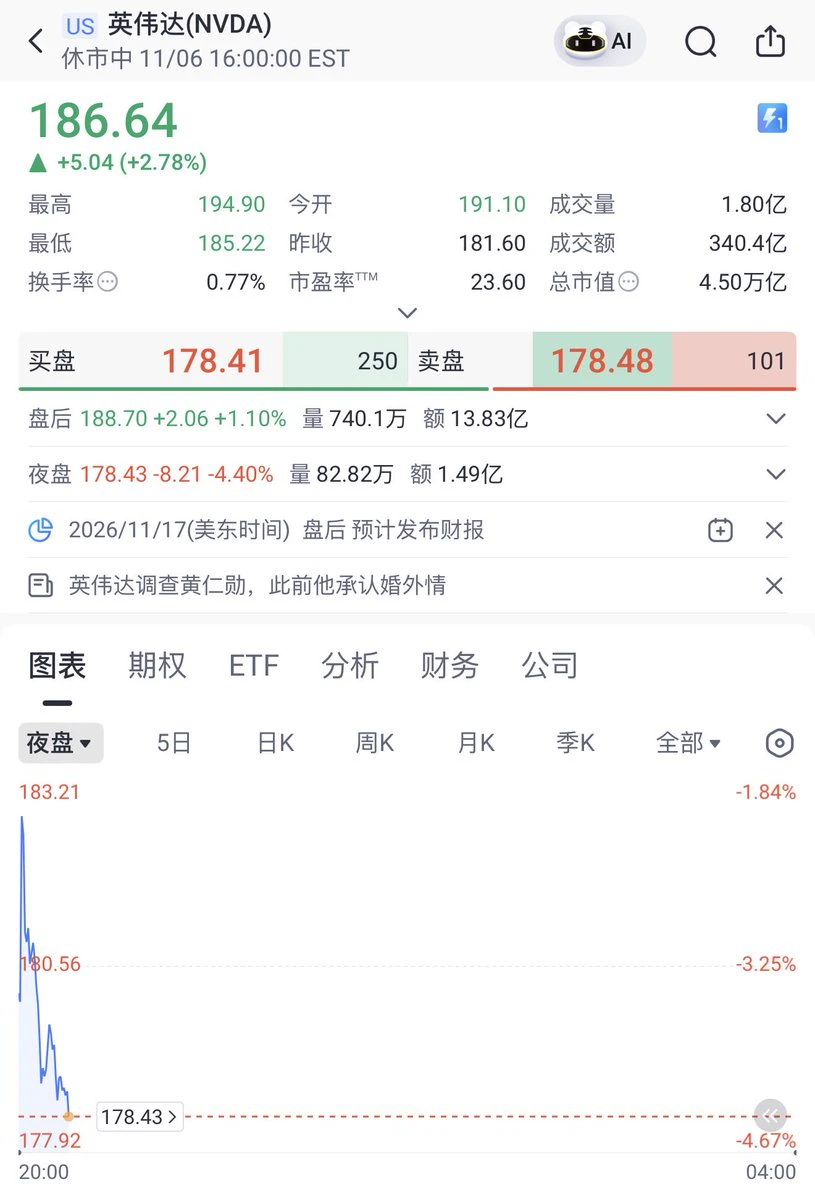
what’s that got to do with my Ethereum?
I’m getting caught in the crossfire just lying here.
If I cheat tomorrow,
does that mean U.S. stocks have to wobble too?
post-image
ETH-1.26%
  • 1
Every individual stock has its moment of blowing up
First it was META, then GOOG
Now it's Nvidia
NVDA is headed for $150 this time
Thank you, Jensen Huang!
P.S. Don't buy individual stocks; only buy index funds
It's such a simple principle, yet so many people just won't listen
Some people are even proud of going all-in and heavily investing in INTC and GOOG
And they brag about their 10% annualized returns
Is that really your stock-picking skill, or is Wall Street just rewarding you?
Don't you have any sense of that?
😅😅😅
post-image
GOOG+0.71%
NVDA+2.80%
INTC+8.00%
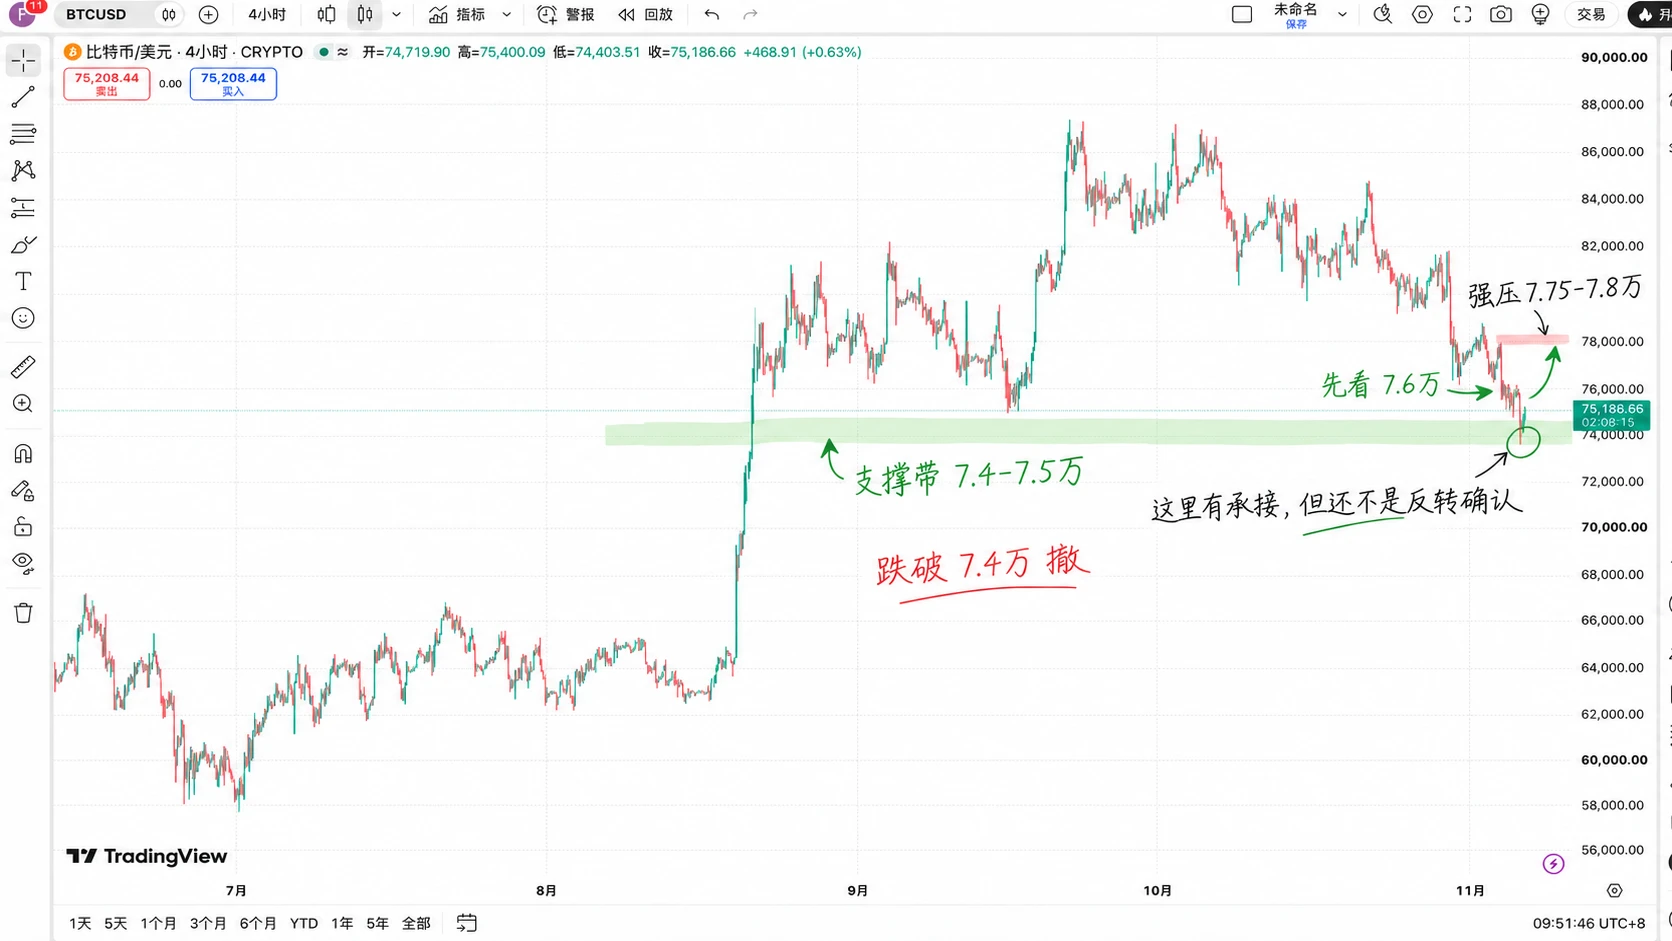
#BTCETF资金持续流出 Wow, BTC has fallen this far. Is 75k still a good level to buy the dip?

First, look at the chart. $BTC It plunged from around 87k all the way to 74k, breaking through support at 80k and 78k one after another. Now it’s finally bounced back to 75k, and people are already calling for the bull market to return.

So, has it really bottomed this time?

Honestly, I’m not that optimistic, but there’s no need to be overly pessimistic either.

There’s a detail on the 4-hour chart: BTC just broke below 74k, then bounced back above it, which shows there are still buyers below. But there’s s
post-image
At the 75k level
Golden buying opportunity
The starting point of the next downturn
1 Participants
Ends In 23 Hour
BTC-0.65%
  • 2
CPI and PPI hit next week! BTC’s real opponent may not be AI, but the Fed!

Tech stocks have just weathered a major shock, and before the crypto market could catch its breath, the next test is already on its way: U.S. CPI and PPI data are about to be released.
The market’s real focus this time may not be how many more chips AI companies will buy, but when the Fed will be willing to loosen its grip on the market.
Why are inflation data so important? Because CPI reflects changes in consumer prices, while PPI reflects changes in producer prices, and both affect market expectations for future inte
NVDA+2.80%
  • 2
People who have never truly loved a car, or even felt for one the way they would for a pet, won’t understand.
post-image
$2.5 trillion evaporated overnight! AI stocks cool off—will BTC be the next victim?

What does $2.5 trillion mean? If it were a sum of money, it would be enough to make countless investors rethink what risk management means. The Nasdaq plunged 5.5% in a single day, and AI stocks sank across the board. The market has finally started taking a serious look at one question: The future of artificial intelligence is bright, but are prices too high right now?
Previously, investors were willing to pay high valuations for the AI growth story. As long as data center expansion, chip demand, and capital s
NVDA+2.80%
$ONDO Short setup update: I placed a short in the 0.3517–0.3533 range. Price has now moved into this area, so I’m watching closely. If it breaks above 0.362, I’ll abandon the trade and exit immediately.
On the 4-hour chart, the current price of 0.352 is below the EMA50 (0.381), and the overall structure remains bearish. Current risk/reward: about 2.7% to the stop loss and about 4.4% to the third target. If TP3 is reached, that would be around 1.6R.
🔴 Direction: Short · Entry: 0.3517–0.3533 · Targets: 0.3467 / 0.3429 / 0.3371 · Stop loss: 0.3621
Next, either we drop cleanly from here, or we g
post-image
ONDO-0.29%
#StockTalkSeason

Stock Talk Season: Can Better Market Discussions Lead to Smarter Investment Decisions?

What Is the Biggest Myth?

Many people believe that successful stock investing is all about finding a company whose share price will rise. But that is only one part of the picture. Understanding why a company may grow, what risks it faces, and whether its current price makes sense are equally important.

A rising stock is not automatically a good investment, just as a falling stock is not automatically a bad one. Good decisions come from research, patience, and the ability to understand d
post-image
Load More

Join 40 M users in our growing community

⚡️ Join 40 M users in the crypto craze discussion

💬 Engage with your favorite top creators

👍 See what interests you

Trending Topics

USCPIDataIncoming

21.09k Views1.72k Discussing

The U.S. October CPI report will be released on November 10 at 8:30 a.m. ET. September CPI came in at 3.7% year over year, and markets will be watching closely for signs that inflation is cooling, especially in core CPI. A softer-than-expected reading could strengthen rate-cut expectations, while hotter inflation may pressure risk assets through higher Treasury yields and a stronger dollar. How do you think this CPI print will move $BTC, U.S. stocks and gold?

BTCFlashCrash

11.44k Views66k Discussing

USAIStocksHitHard

31.15k Views3.75k Discussing

View More