






Square
Following
Hot
News
Notifications
Profile
Share your thoughts
placeholder
Article
IMX short alert 🤯 IMX has shown weakness after its recent pullback. I'm preparing to short 👇Entry price: 0.1224 Stop loss: 0.1239 Take profit 1: 0.1206 Take profit 2: 0.1189 Take profit 3: 0.1171 Click here to trade 👇⬇️⬇️ Short with me...👇⬇️ $IMX
post-image
IMX-1.47%
Nvidia's boss had an affair—the company that makes graphics cards. Go home and check whether your husband uses an Nvidia graphics card too. Take it out and give it to me; I'll help you get rid of it. Men who use this thing are all potential cheating scumbags. Hurry up and get rid of it
post-image
Trenches
牛逼
牛
bade
b
牛逼
0x96...7777
Market Cap
$.
Change
.
24h Vol
$.
Holders
.
ZIG
Z
bade
b
ZIG
0x8c...1145
Market Cap
$.
Change
.
24h Vol
$.
Holders
.
BTC
B
bade
b
BTC
C5xp...pump
Market Cap
$.
Change
.
24h Vol
$.
Holders
.
STONK
S
bade
b
STONK
6GmA...UNgx
Market Cap
$.
Change
.
24h Vol
$.
Holders
.
ANSEM
A
bade
b
ANSEM
9cRC...pump
Market Cap
$.
Change
.
24h Vol
$.
Holders
.
The short I gave around 49 banked over 100 points. Even the small runner left on made a killing🥳#ETH
ETH-1.23%
$ETH Another major shock! Early this morning, Nvidia CEO Jensen Huang was exposed for having an affair while married!

After the news broke, Nasdaq futures briefly fell about 1%. Although they quickly recovered, the market was still affected to some extent. AI stocks and the crypto market are now both being affected by risk appetite and liquidity. If U.S. stocks see significant volatility, BTC and ETH may also come under pressure.
#BTC闪崩插针
post-image
ETH-1.23%
Bitcoin short from 75,500, another call delivered!
Shared my view publicly this morning, and I’m currently up around 1,000 points.
This old short seller is still the same: willing to call the direction in advance and execute when the market moves.
The real value has never been in reviewing the trade after the fact, but in showing your hand beforehand! $BTC #BTC
BTC-0.67%
BTC | ETH | Gold | Crude Oil
live-cover
LIVE3,662
#晒出我的合约收益 #Gate24小时净流入全球第三 Earn 0.01U every day, passing the time doing nothing.
post-image
BTC probes lower again; don’t focus only on the rebound

As of 14:30 on November 9, BTC was around 74,318, down about 0.7% on the day, with a high of 75,599 and a low of 74,281. The 1-hour and 4-hour moving averages remain bearish, and MACD is below the zero line; the 4-hour RSI is around 28, already in oversold territory. But oversold conditions only mean a rebound could happen at any time—they do not mean the trend has already reversed.

On the news front, U.S. spot BTC ETFs saw total net outflows of about $1.2817 billion last week, signaling cautious flows. U.S. CPI is due at 21:30 on Novem
BTC-0.67%
  • 3
Gave a short trade idea on ETH this morning, entering at 2148
Price reached the target as expected this afternoon, and I exited smoothly with profits
40 points safely pocketed, banking 2154.78U
Trading isn't about making frequent moves; catching one solid trend is enough#美国10月CPI即将公布 $ETH ‌ ‌
ETH-1.26%
#红牛双车登上巴西领奖台 Congratulations, Pan Zi! Congratulations, Pan Zi! Congratulations, Pan Zi!$GT
post-image
GT-2.41%
I said let’s make friends with integrity. Is that honest enough? Anyone who unfollowed me, go unfollow him too 😕
Get me to 10000, hurry... I’m so honest, guys
#蓝V交友 #MakingFriendsPost
post-image
$BTC still up 30% from its june low
most alts making new all-time lows again
the pain just keeps getting worse
post-image
BTC-0.67%
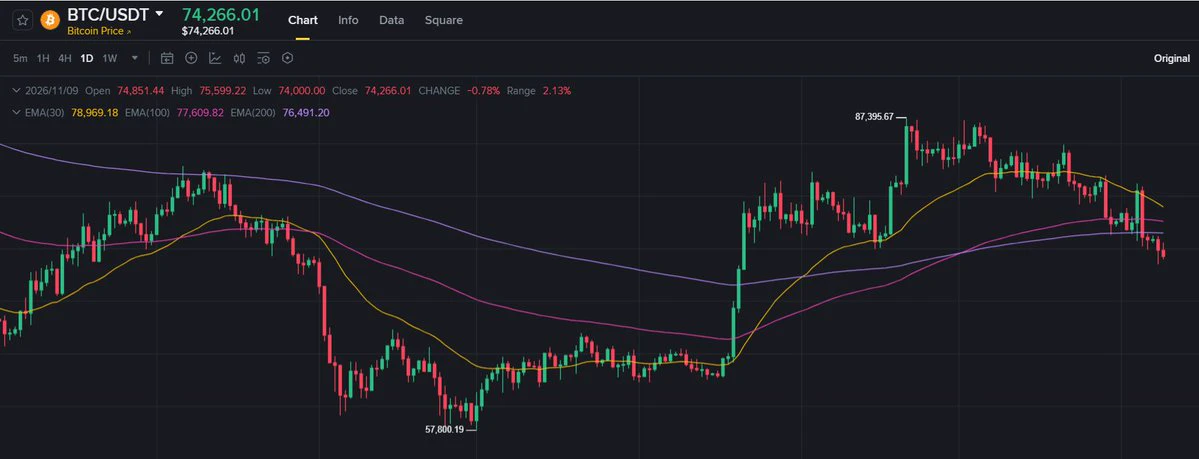
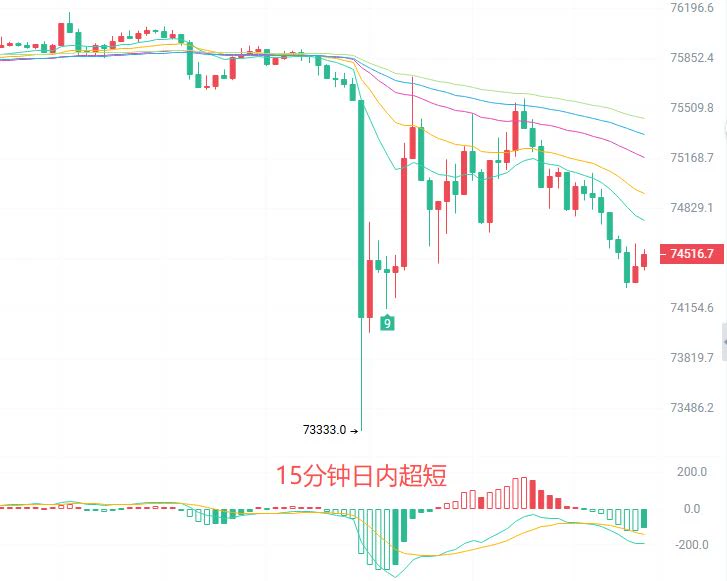
$BTC BTC fell below the lower Bollinger Band, leaving the 74,600 long just $150 from its 74,300 stop loss
The 2-hour chart looks ugly: price has already fallen below the lower Bollinger Band at 74,462, the first time since late October. It’s accelerating downward along the lower band. All the moving averages are overhead, forming a thick bearish wall. The MACD green bars are expanding below the zero line and opening downward; the bears haven’t let up at all. The TD buy count just printed its first bar, and a single bar doesn’t tell us anything
The 15-minute chart is clearer: it closed at 74,44
post-image
BTC-0.65%
$SOL
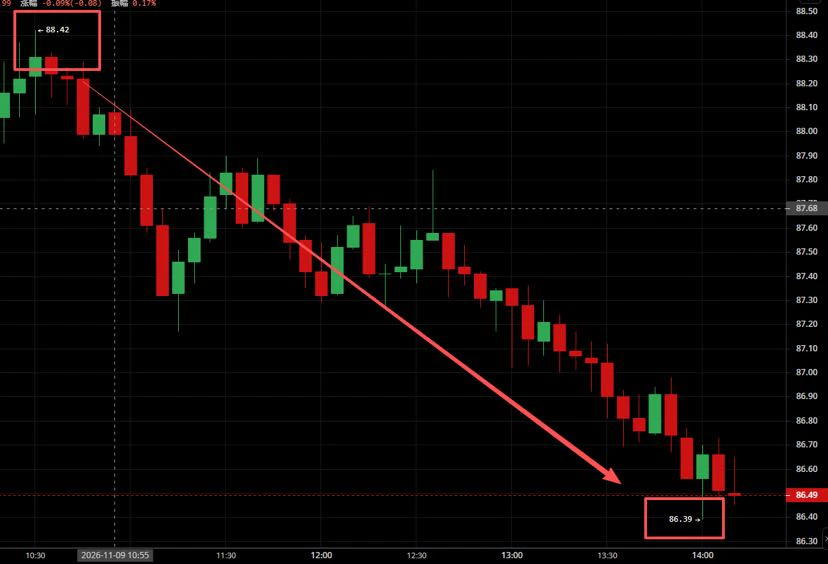
The rebound faced resistance and was rejected precisely, with the short trade's downside playing out gradually
The morning call was to establish short positions in the 88.0-89.5 range. The market climbed to 88.42 before stalling at the resistance zone, then began to pull back amid choppy trading, reaching a low of 86.39. The bearish move unfolded exactly as expected.
#美国10月CPI即将公布
The broader downtrend remains intact; the oversold rebound is merely a pause along the way.
The first downside target is 85.5. If it breaks decisively, the price could continue falling toward the 83.5 area. St
post-image
Top-OutMemo
11.9 SOL Outlook for Today
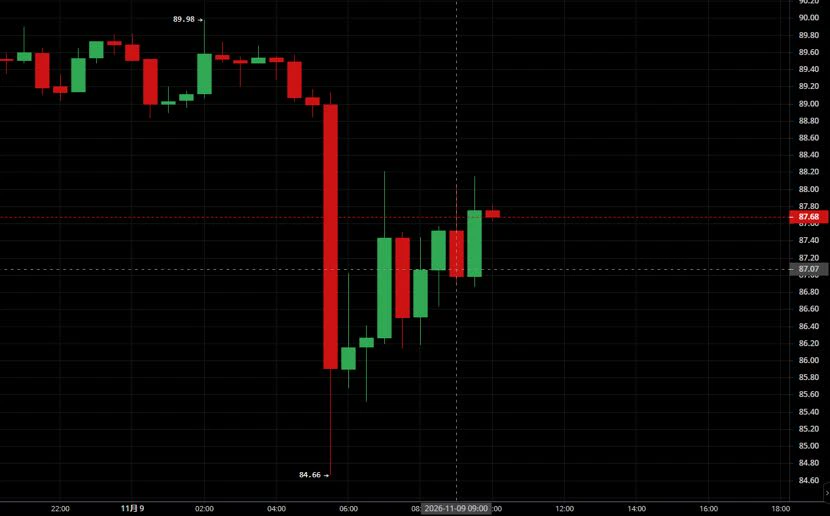
After dipping to an overnight low of 84.66, SOL staged an oversold rebound. It is currently in a weak recovery phase, and the broader bearish trend remains intact. The rebound is expected to face resistance, with further downside still likely. Focus on shorting rallies, with short-term longs at support as a secondary strategy.
#70%山寨币跌破200日均线
Support: 86.0-86.5, 84.5-85.0
Resistance: 88.5-89.0, 89.5-90.0
Short: Enter in batches on a rebound into the 88.5-89.0 range, with a stop-loss at 90.2. First target: 86.5; if the level breaks, look to 85.0
Short-term long: If the price stabilizes after retesting the 86.0-86.5 range, consider a small long position. Enter and exit quickly. Stop-loss: 84.6; target: 87.8-88.2
repost-content-media
SOL-0.77%
11.9 SOL Trading Plan
Market Analysis

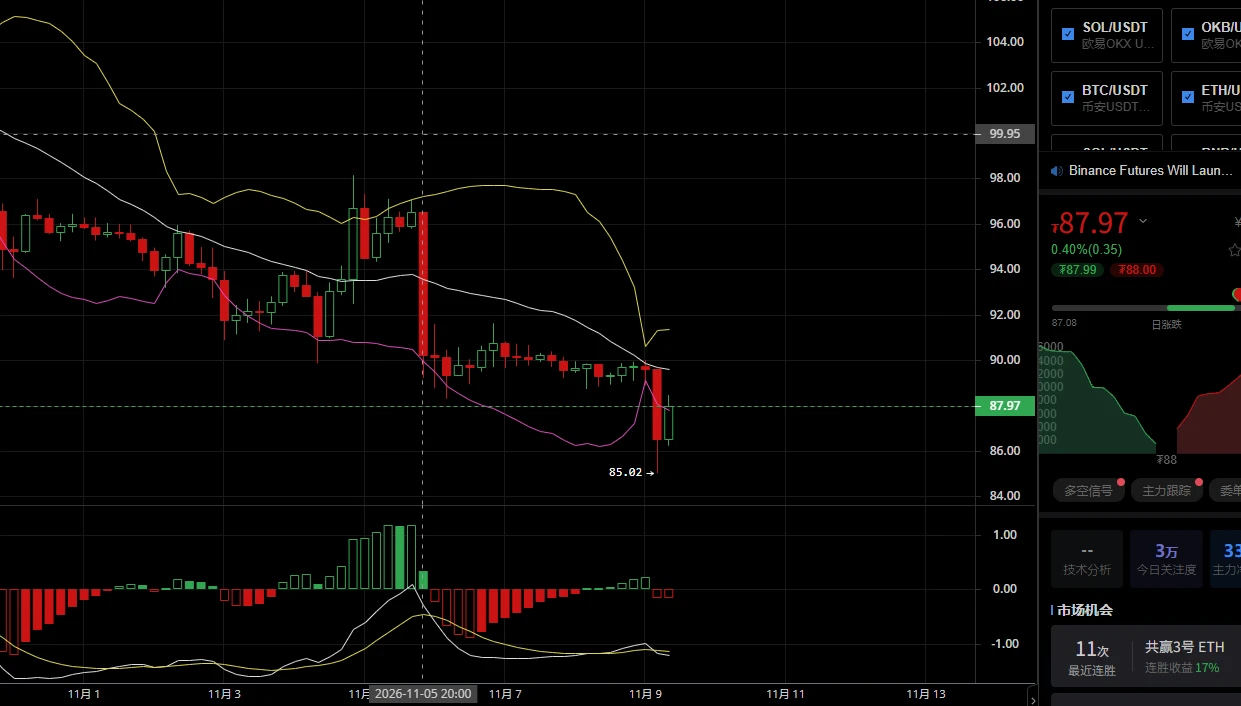
The candlestick chart shows SOL recently dropping sharply, hitting a low of **85.02** and forming a long lower wick—a sign of a short-term plunge that has released bearish pressure. The current price is 87.97, with a slight recovery after the retest. Support is emerging at the lower Bollinger Band, and indicators below show signs of bullish divergence. Bearish momentum is fading, creating an opportunity for a rebound.

Entry Zone

Preferably wait for a retest of the 86.80–87.20 range and enter long in batches;
Aggressive approach: Open a small long pos
post-image
SOL-0.74%
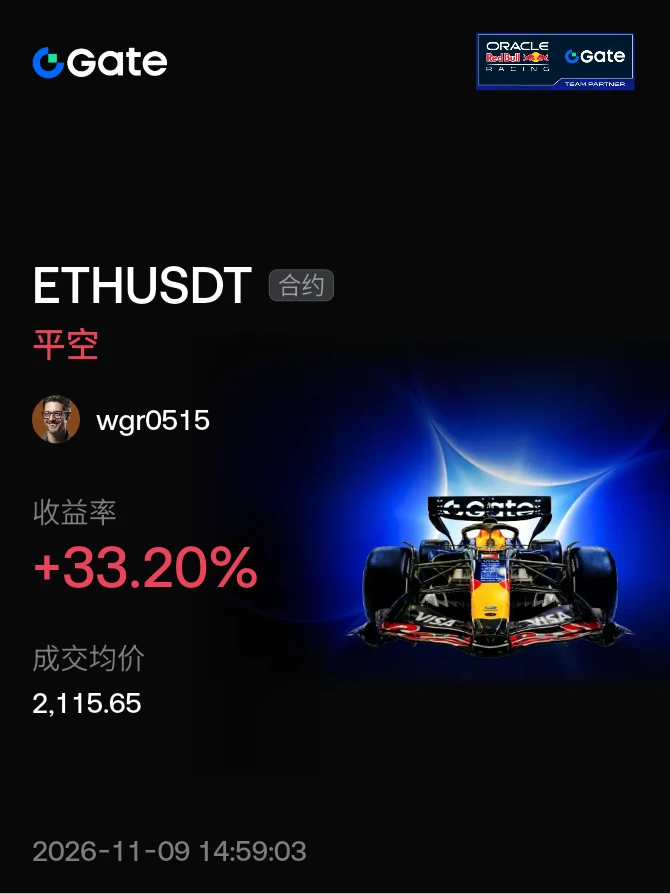
43 points of pure profit, a 396% return! This ETH trade was a satisfying win!

Entered at 2152, the market kept dumping all the way to 2109, smoothly pocketing 4300 U.

That’s why my Yue-jie always says: don’t always think about holding a position; use a small position at key levels to trade the major trend.
With rock-solid risk management, profits can run wild. $ETH #美国10月CPI即将公布
ETH-1.23%
11.09 Qiqi on Gold Midday Review: Consolidation After the Rally, Bulls and Bears Enter a Short-Term Battle!

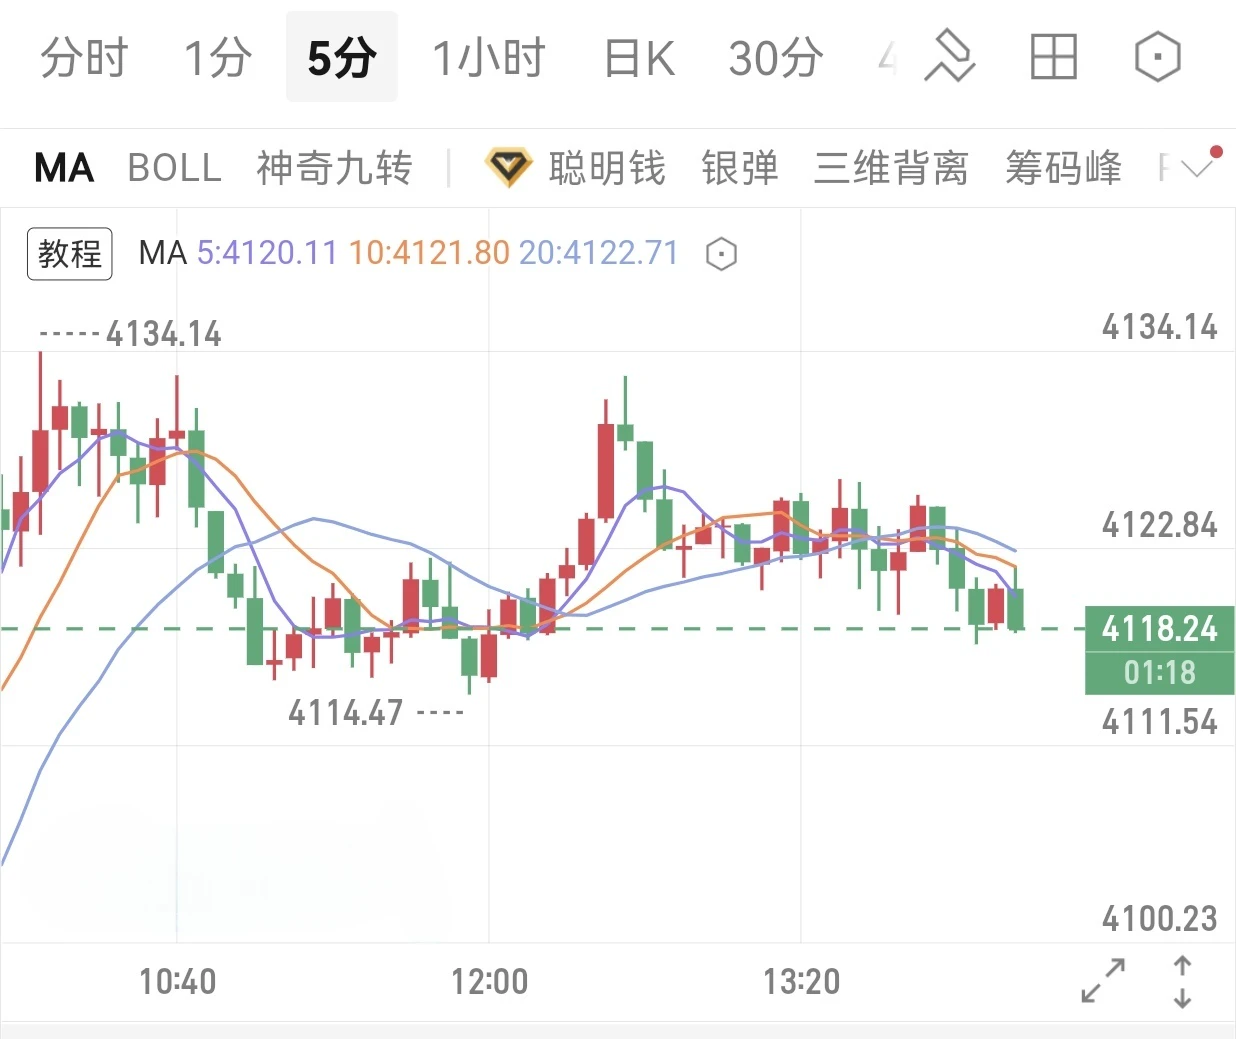
Gold surged to an intraday high of 4134 in the early session, then its gains slowed, with the current price pulling back amid fluctuations near 4118. After a sharp rally, bullish momentum has weakened somewhat, and the market has entered a short-term consolidation phase.

The short-term MACD has turned downward, and the indicator is showing a bearish divergence signal, with overhead pressure gradually emerging. The broader trend remains bullish, but it is not advisable to chase the rall
post-image
XAU+0.38%
  • 1
The index surged 2,647 points intraday, breaking 42,000, but closed up just 1,960 points—was this long upper shadow on Taiwan stocks today a sign of strength or weakness? #Gate上线台股交易

Closing data (November 9, source: CNA / Economic Daily News / Commercial Times): The TAIEX closed at 41661.70 points, up 1960.06 points or 4.94%, marking the second-largest point gain at close in history; it hit an intraday high of 42349.36 points, at one point up 2647.72 points; trading volume was NT$837.929 billion.
Blue-chip stocks led the charge: TSMC closed at NT$2,235, up NT$100 (+4.68%), after hitting an
post-image
TSM+6.60%
Sudden flash crash before BTC’s weekly close! A wick down to $73,510, with $715 million in long
live-cover
LIVE2,014
Load More

Join 40 M users in our growing community

⚡️ Join 40 M users in the crypto craze discussion

💬 Engage with your favorite top creators

👍 See what interests you

Trending Topics

USCPIDataIncoming

28.2k Views1.84k Discussing

The U.S. October CPI report will be released on November 10 at 8:30 a.m. ET. September CPI came in at 3.7% year over year, and markets will be watching closely for signs that inflation is cooling, especially in core CPI. A softer-than-expected reading could strengthen rate-cut expectations, while hotter inflation may pressure risk assets through higher Treasury yields and a stronger dollar. How do you think this CPI print will move $BTC, U.S. stocks and gold?

RedBullDoublePodiumInBrazil

1.76k Views30.52k Discussing

BTCFlashCrash

72.71k Views66.21k Discussing

View More