


Square
Following
Hot
News
Notifications
Profile
Share your thoughts
placeholder
Article
What Does It Mean When Price, Trading Volume, and OI All Rise?

In crypto derivatives markets, traders often watch for a particular combination: prices rise, trading volume increases, and open interest (OI) also rises.

Some see this as a sign of a strong rally, while others worry that the market is accumulating too much leverage. How should this combination be interpreted?

The key is that these data points can provide insight into market participation, but they cannot by themselves prove that prices will continue to rise.

First, what does a rising price mean?

A rising price means that the
post-image
Q4 does not disappoint. Yeah baby!
post-image
Trenches
mihao
m
bade
b
mihao
4Cxj...pump
Market Cap
$.
Change
.
24h Vol
$.
Holders
.
AGT
A
bade
b
AGT
0x5d...e274
Market Cap
$.
Change
.
24h Vol
$.
Holders
.
FOOD
F
bade
b
FOOD
FTu5...pump
Market Cap
$.
Change
.
24h Vol
$.
Holders
.
IDOL
I
bade
b
IDOL
0x3b...ab07
Market Cap
$.
Change
.
24h Vol
$.
Holders
.
AI
A
bade
b
AI
2T56...pump
Market Cap
$.
Change
.
24h Vol
$.
Holders
.
This kid is way too bold.
If the neighbor hadn't seen it.
Something would've happened..
What does it mean when price falls, trading volume increases, and OI rises at the same time?

In the crypto derivatives market, if prices keep falling while trading volume increases and open interest (OI) also rises, many traders will immediately conclude that bears are dominating the market and the decline may continue.

This interpretation has some value, but it should not be treated as a definitive trading signal. The combination of these three indicators needs to be understood in the context of market structure and actual trading activity.

First, what does a price decline mean?

A price d
post-image
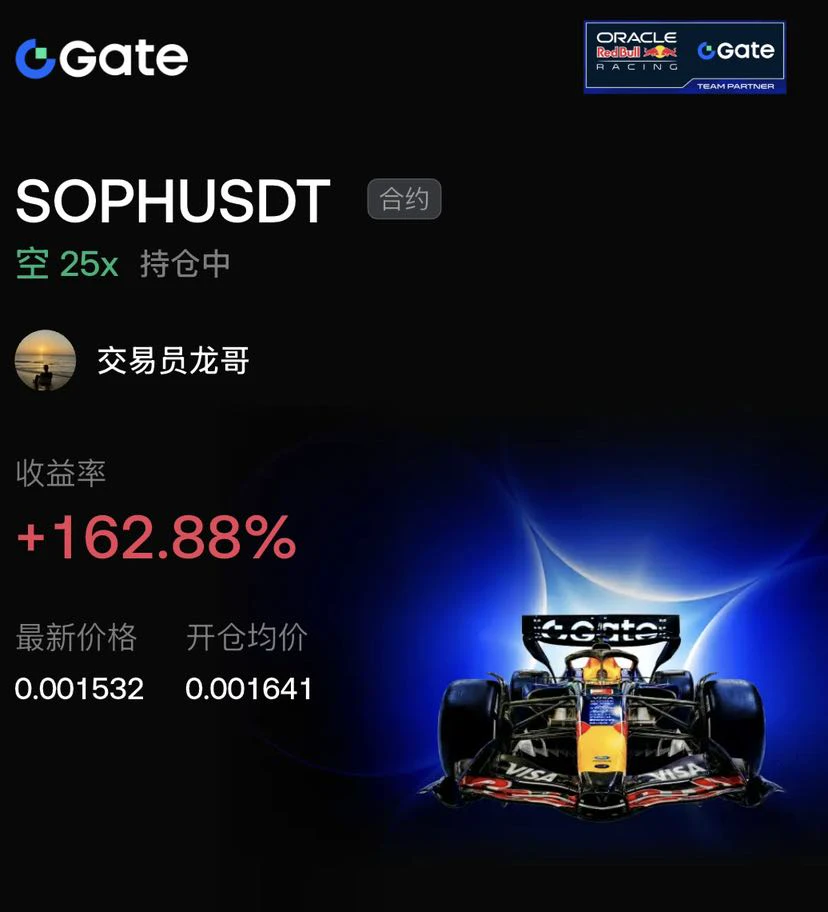
Today's market-wide selloff continues, and altcoins are crashing right along with it. $SOPH has been plunging nonstop. The 25x short has locked in a hefty +162.88% gain! From an average entry price of 0.001641, the price plunged to the latest 0.001532. This waterfall drop was perfectly captured, with the Red Bull Racing-style high-speed sprint delivering huge profits for the bears.

Technically, SOPH has been unable to rebound after breaking down, and 0.001641 has firmly turned into strong resistance. A slow grind downward is the most grueling; the lack of a sharp wick suggests the bulls have
post-image
SOPH-4.34%
BTC-0.65%
ETH-1.23%
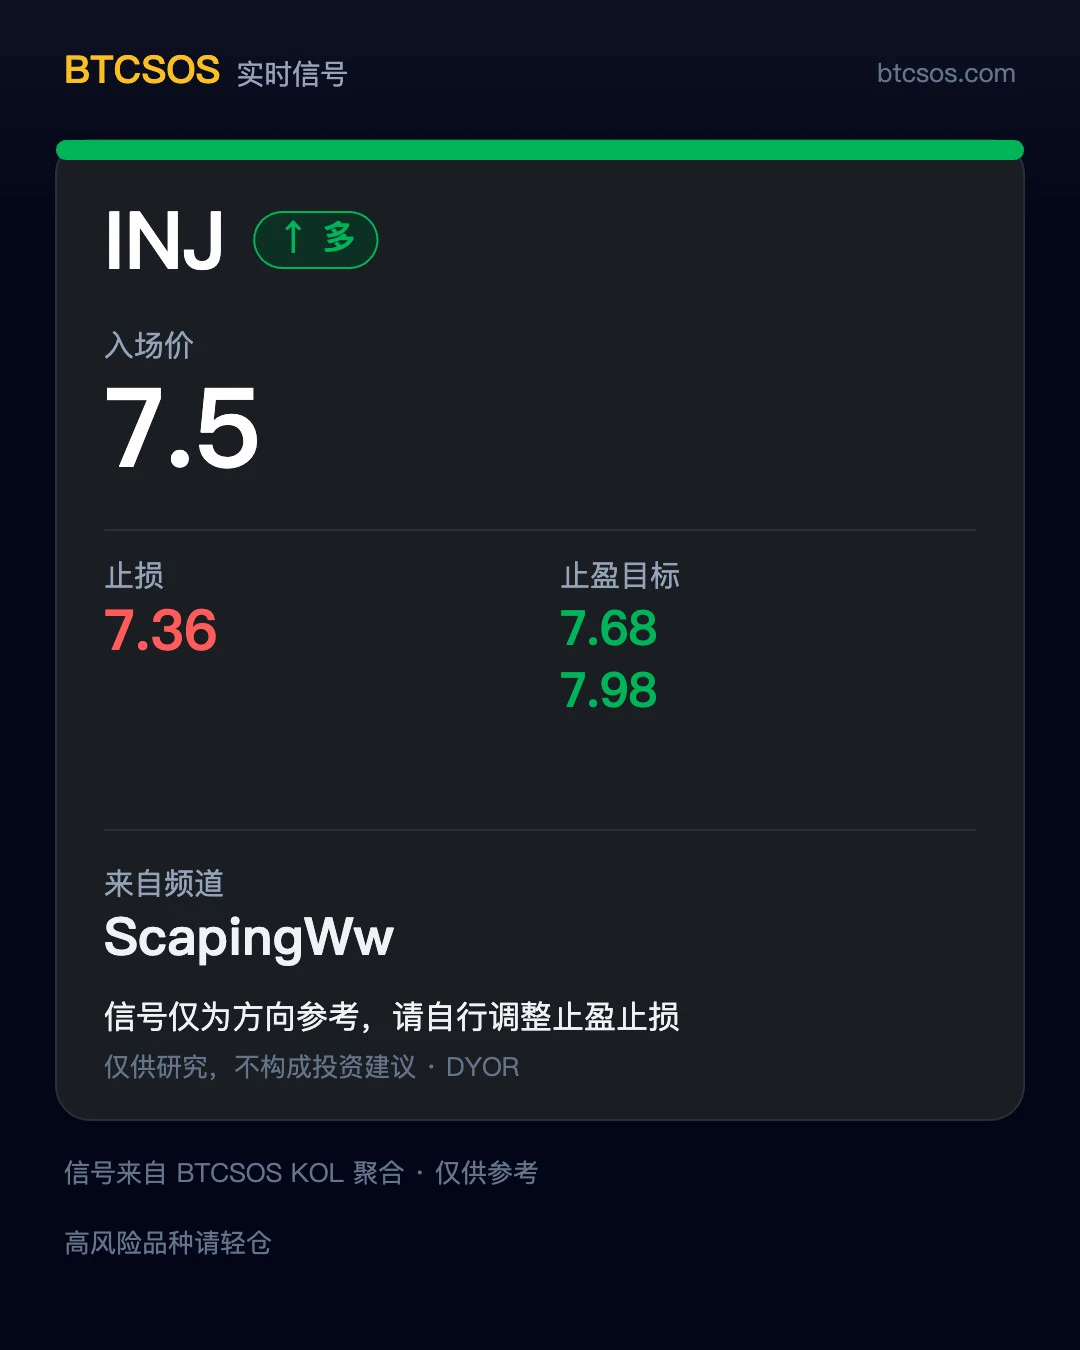
🚨 Signal card · Just captured
Channel: ScapingWw Target: $INJ Long entry: 7.5 Target: 7.68 / 7.98 Stop loss: 7.36
Speaking of which, I reposted this account’s $KGEN trade earlier today, and here it is again—the signals come pretty frequently 👀
Sis is only responsible for reposting everything as-is, without changing a single number. Whether to follow and how much to put in is up to you, folks—the plan is yours, and so is the discipline. Don’t let FOMO place your orders for you 😤
Personal record shared, not investment advice. #MARA sells nearly 14,000 BTC—are mining companies changing their
post-image
INJ-1.67%
KGEN-5.46%
MARA-6.01%
BTC-0.67%
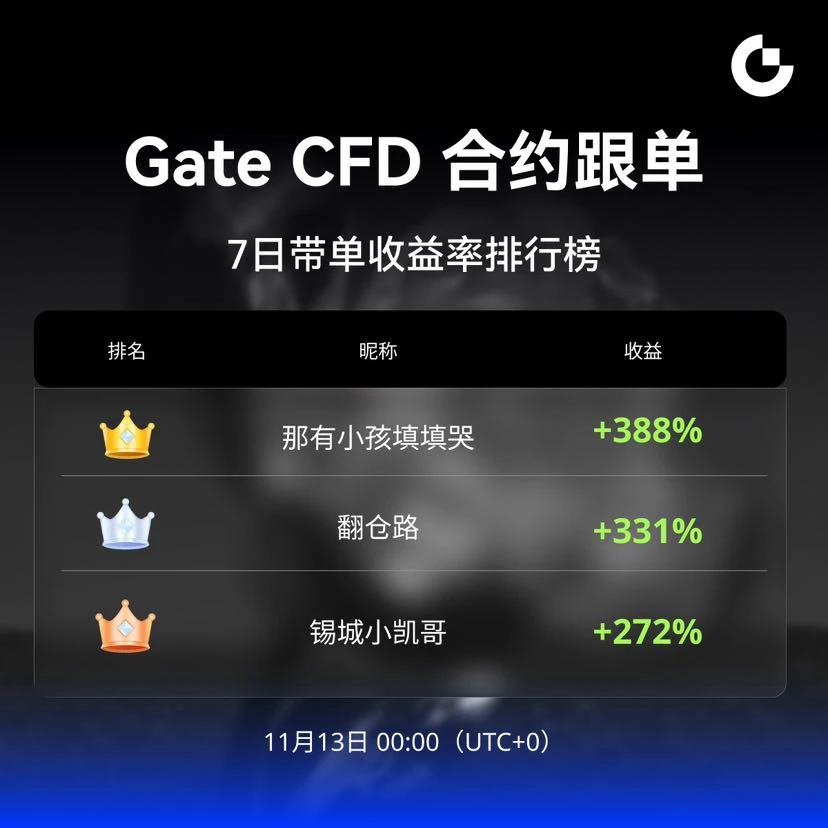
📈 Top traders, let the data speak!
7-Day Returns Leaderboard for CFD Contract Copy Traders
🥇 Na You Xiao Hai Tian Tian Ku: +388%
🥈 Fan Cang Lu: +331%
🥉 Xi Cheng Xiao Kai Ge: +272%
Their performance is proven; choosing the right one is key.
Follow proven traditional CFD strategies to easily participate in mainstream markets such as gold, forex, indices, and popular U.S. stocks, helping your funds grow more efficiently.
👉 Follow now:
https://www.gate.com/zh/copytrading/tradfi
#CFD#传统金融 #跟单 #收益
CopyTrading
📈 Top traders, let the data speak!
7-Day Returns Leaderboard for CFD Contract Copy Traders
🥇 Na You Xiao Hai Tian Tian Ku: +388%
🥈 Fan Cang Lu: +331%
🥉 Xi Cheng Xiao Kai Ge: +272%
Their performance is proven; choosing the right one is key.
Follow proven traditional CFD strategies to easily participate in mainstream markets such as gold, forex, indices, and popular U.S. stocks, helping your funds grow more efficiently.
👉 Follow now:
https://www.gate.com/zh/copytrading/tradfi
#CFD#传统金融 #跟单 #收益
repost-content-media
XAU+0.38%
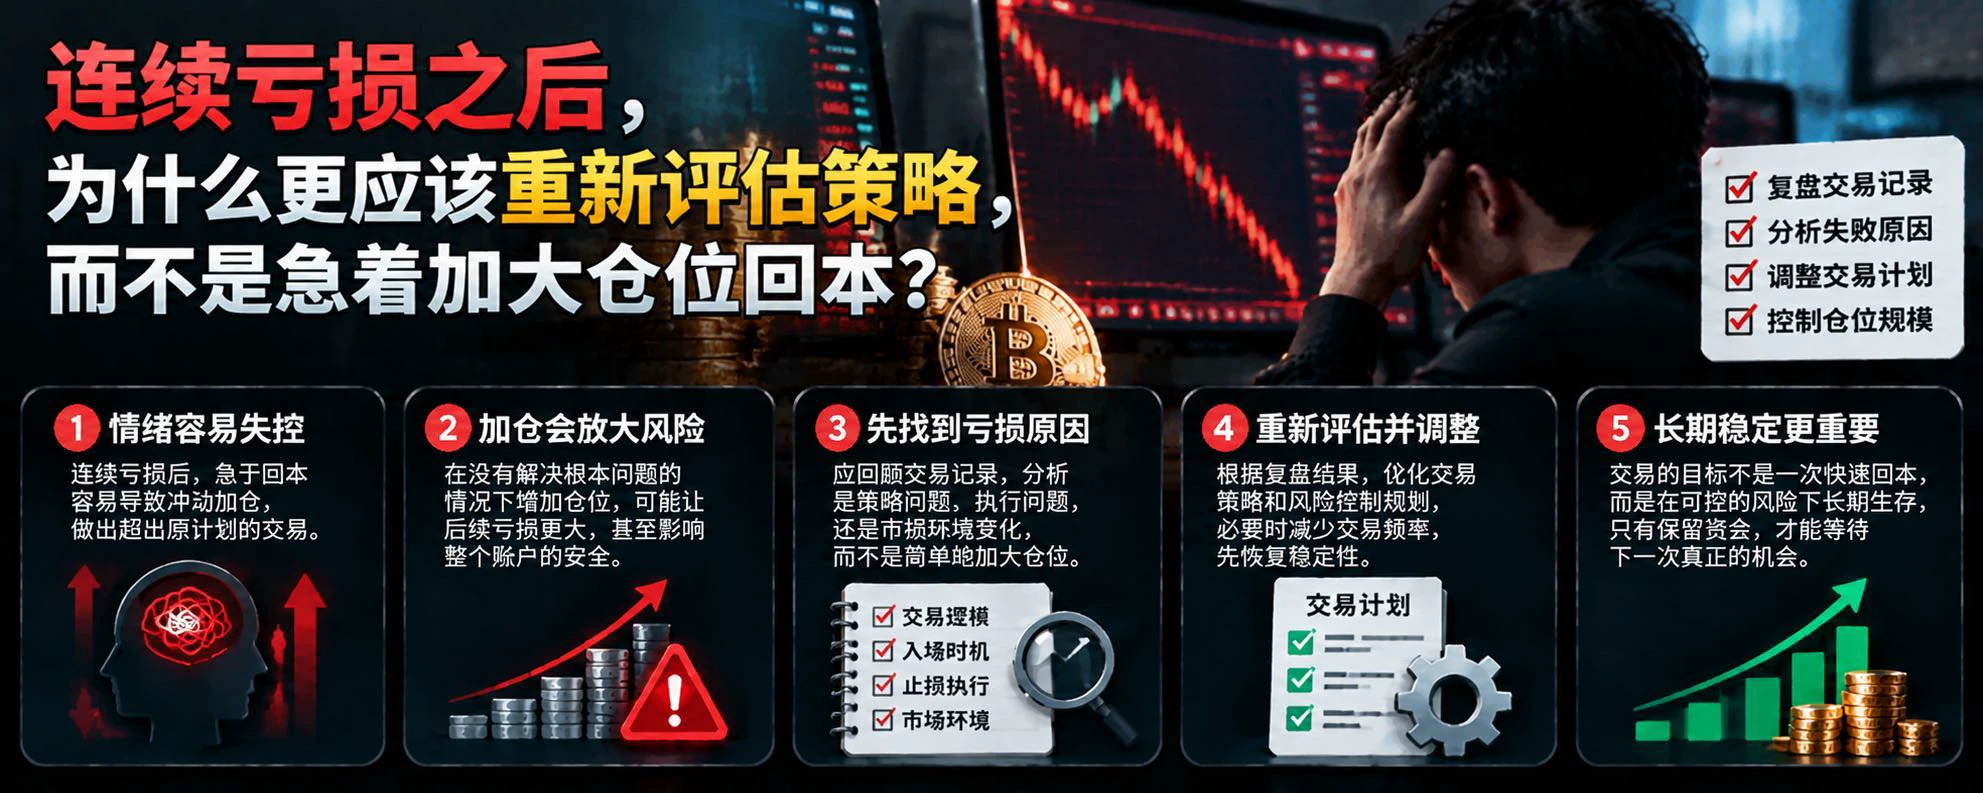
Why Is Position Sizing More Important Than Simply Lowering Leverage?

In cryptocurrency trading, when many people think about reducing risk, their first thought is to lower leverage. But a more important question is often overlooked: How large a position have you actually opened, and how much could this trade cost your account at most?

Leverage determines how capital is used, while position size directly affects how price movements impact profit and loss. Lowering leverage without controlling position size does not necessarily reduce risk effectively.

First, actual risk exposure is what trul
post-image
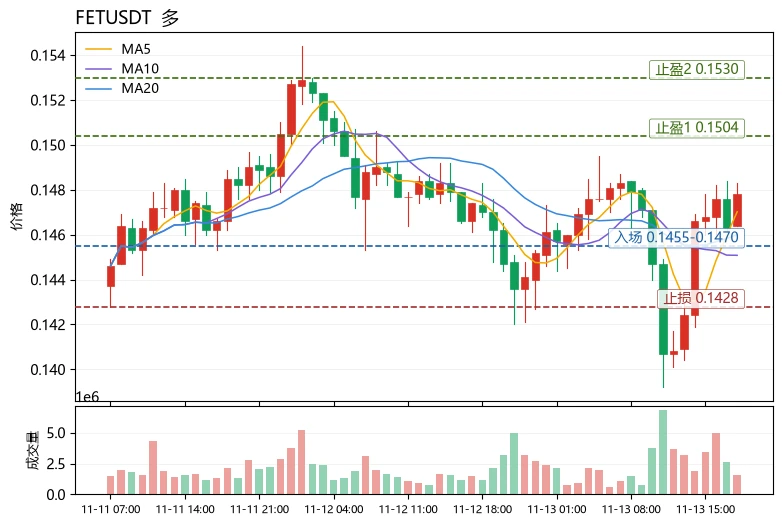
The extreme fear index is only 20, yet FET posted a positive gain and moved above MA5 and MA20. This divergence of “sentiment at rock bottom, structure holding firm” is the most unusual detail in today’s market. Compared with peers in the same sector: POL rose 1.70%, but its MACD histogram has turned bearish and its +0.0036% funding rate signals crowded longs; PEPE rose 2.96% on $82.8M in volume, with an RSI of just 47.6 and an 8.85% range, making it a high-volatility sentiment-driven trade. $FET had the smallest gain (+0.48%), but MA5=0.14702 is above MA20=0.14601, the MACD histogram remains
post-image
FET-1.52%
PEPE+0.97%
What exactly is the difference between limit orders and market orders? Many people get it wrong from the start

In cryptocurrency trading, placing an order may look like simply clicking buy or sell, but different order types affect how trades are executed, price control, and execution risk. Understanding limit and market orders is an important step toward building trading discipline.

First, limit orders: prioritize price control.

A limit order lets you specify the highest price you’re willing to pay to buy or the lowest price you’re willing to accept to sell. For example, if Bitcoin is curre
post-image
BTC-0.67%
$0G is building bullish momentum, gradually recovering toward the $0.160 resistance level! A confirmed breakout could open the door to further gains. Entry: $0.1570 – $0.1590 Target: $0.1610 / $0.1640 / $0.1670 Stop-loss: $0.1540
post-image
0G-3.73%
market update on gate
live-cover
LIVE4,464
$BTC $SPCX Day 3 of simulated copy trading with Aoying, and today's returns hit a new high of 40%. Currently holding a BTC long position and a Big Rocket short position
post-image
BTC-0.65%
SPCX+0.20%
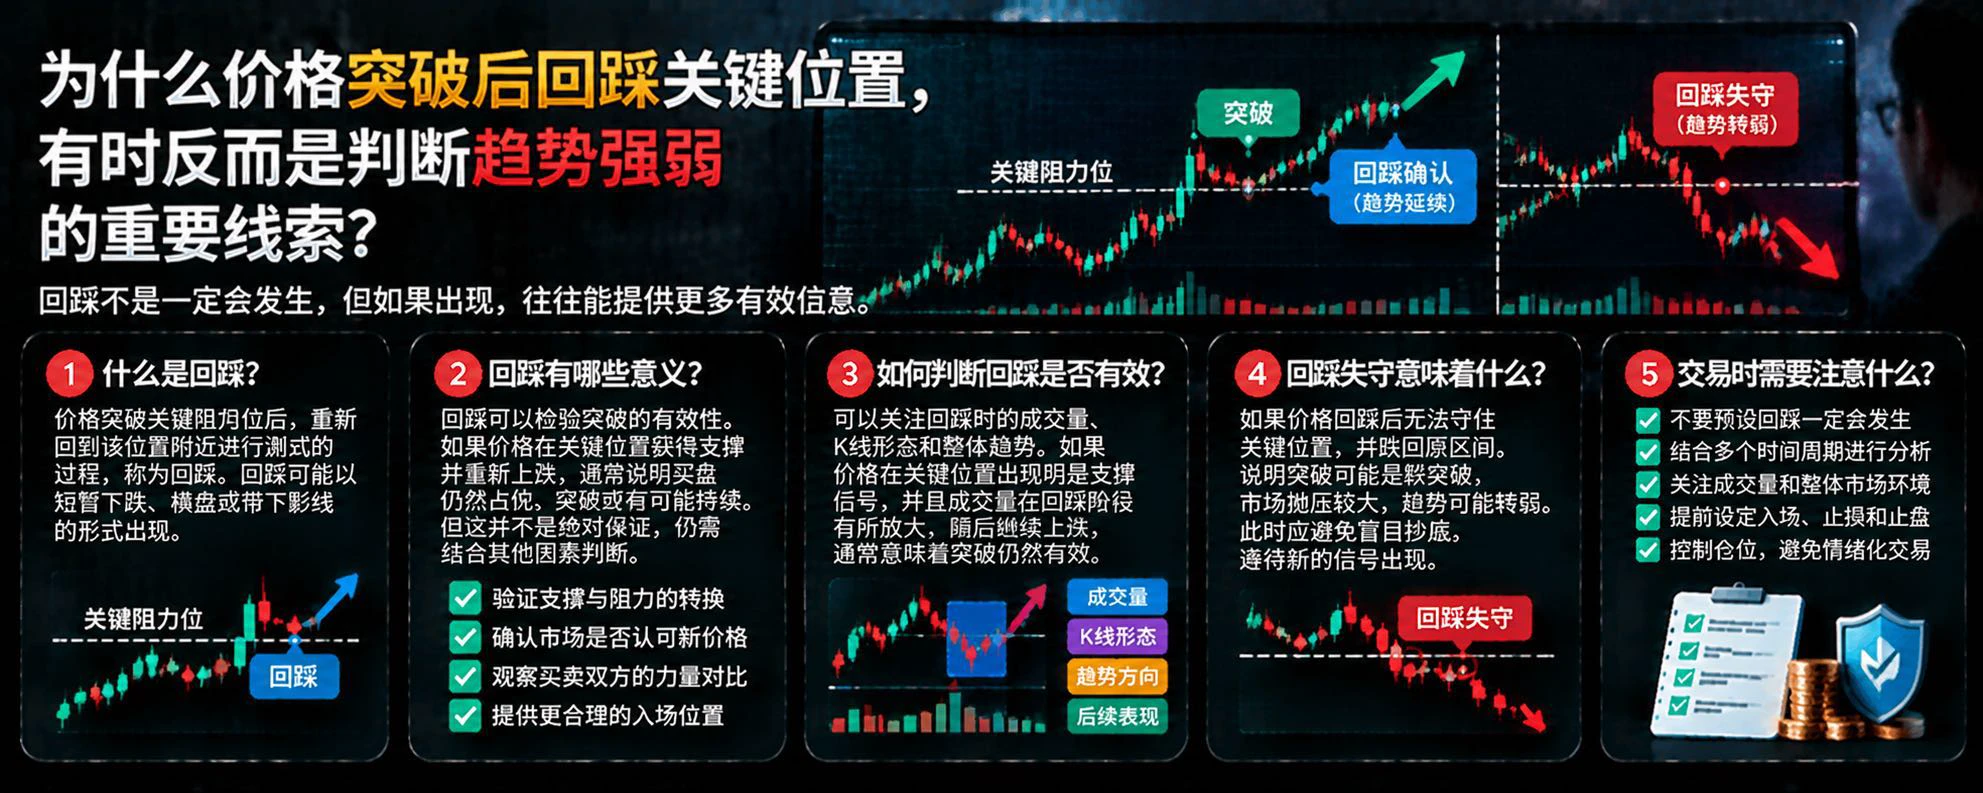
This move has been pretty strong, with a clear increase in volume. The breakout is confirmed; now just waiting for a pullback confirmation before pushing higher. Short-term traders can watch for long opportunities $DODOX .
Trading plan: Entry zone 0.027994 - 0.028624, targets at 0.0305 / 0.0323, stop at 0.02659
One reminder: If the 0.0285 support fails and open interest starts to shrink noticeably, the market could reverse in an instant. Don’t get carried away and go all-in; size your position according to your account.
Risk warning: The above is only my personal opinion and does not constitu
post-image
DODOX
DODOXDODOX
Pump.Fun
MC:$3.17KHolders:86
6.67%
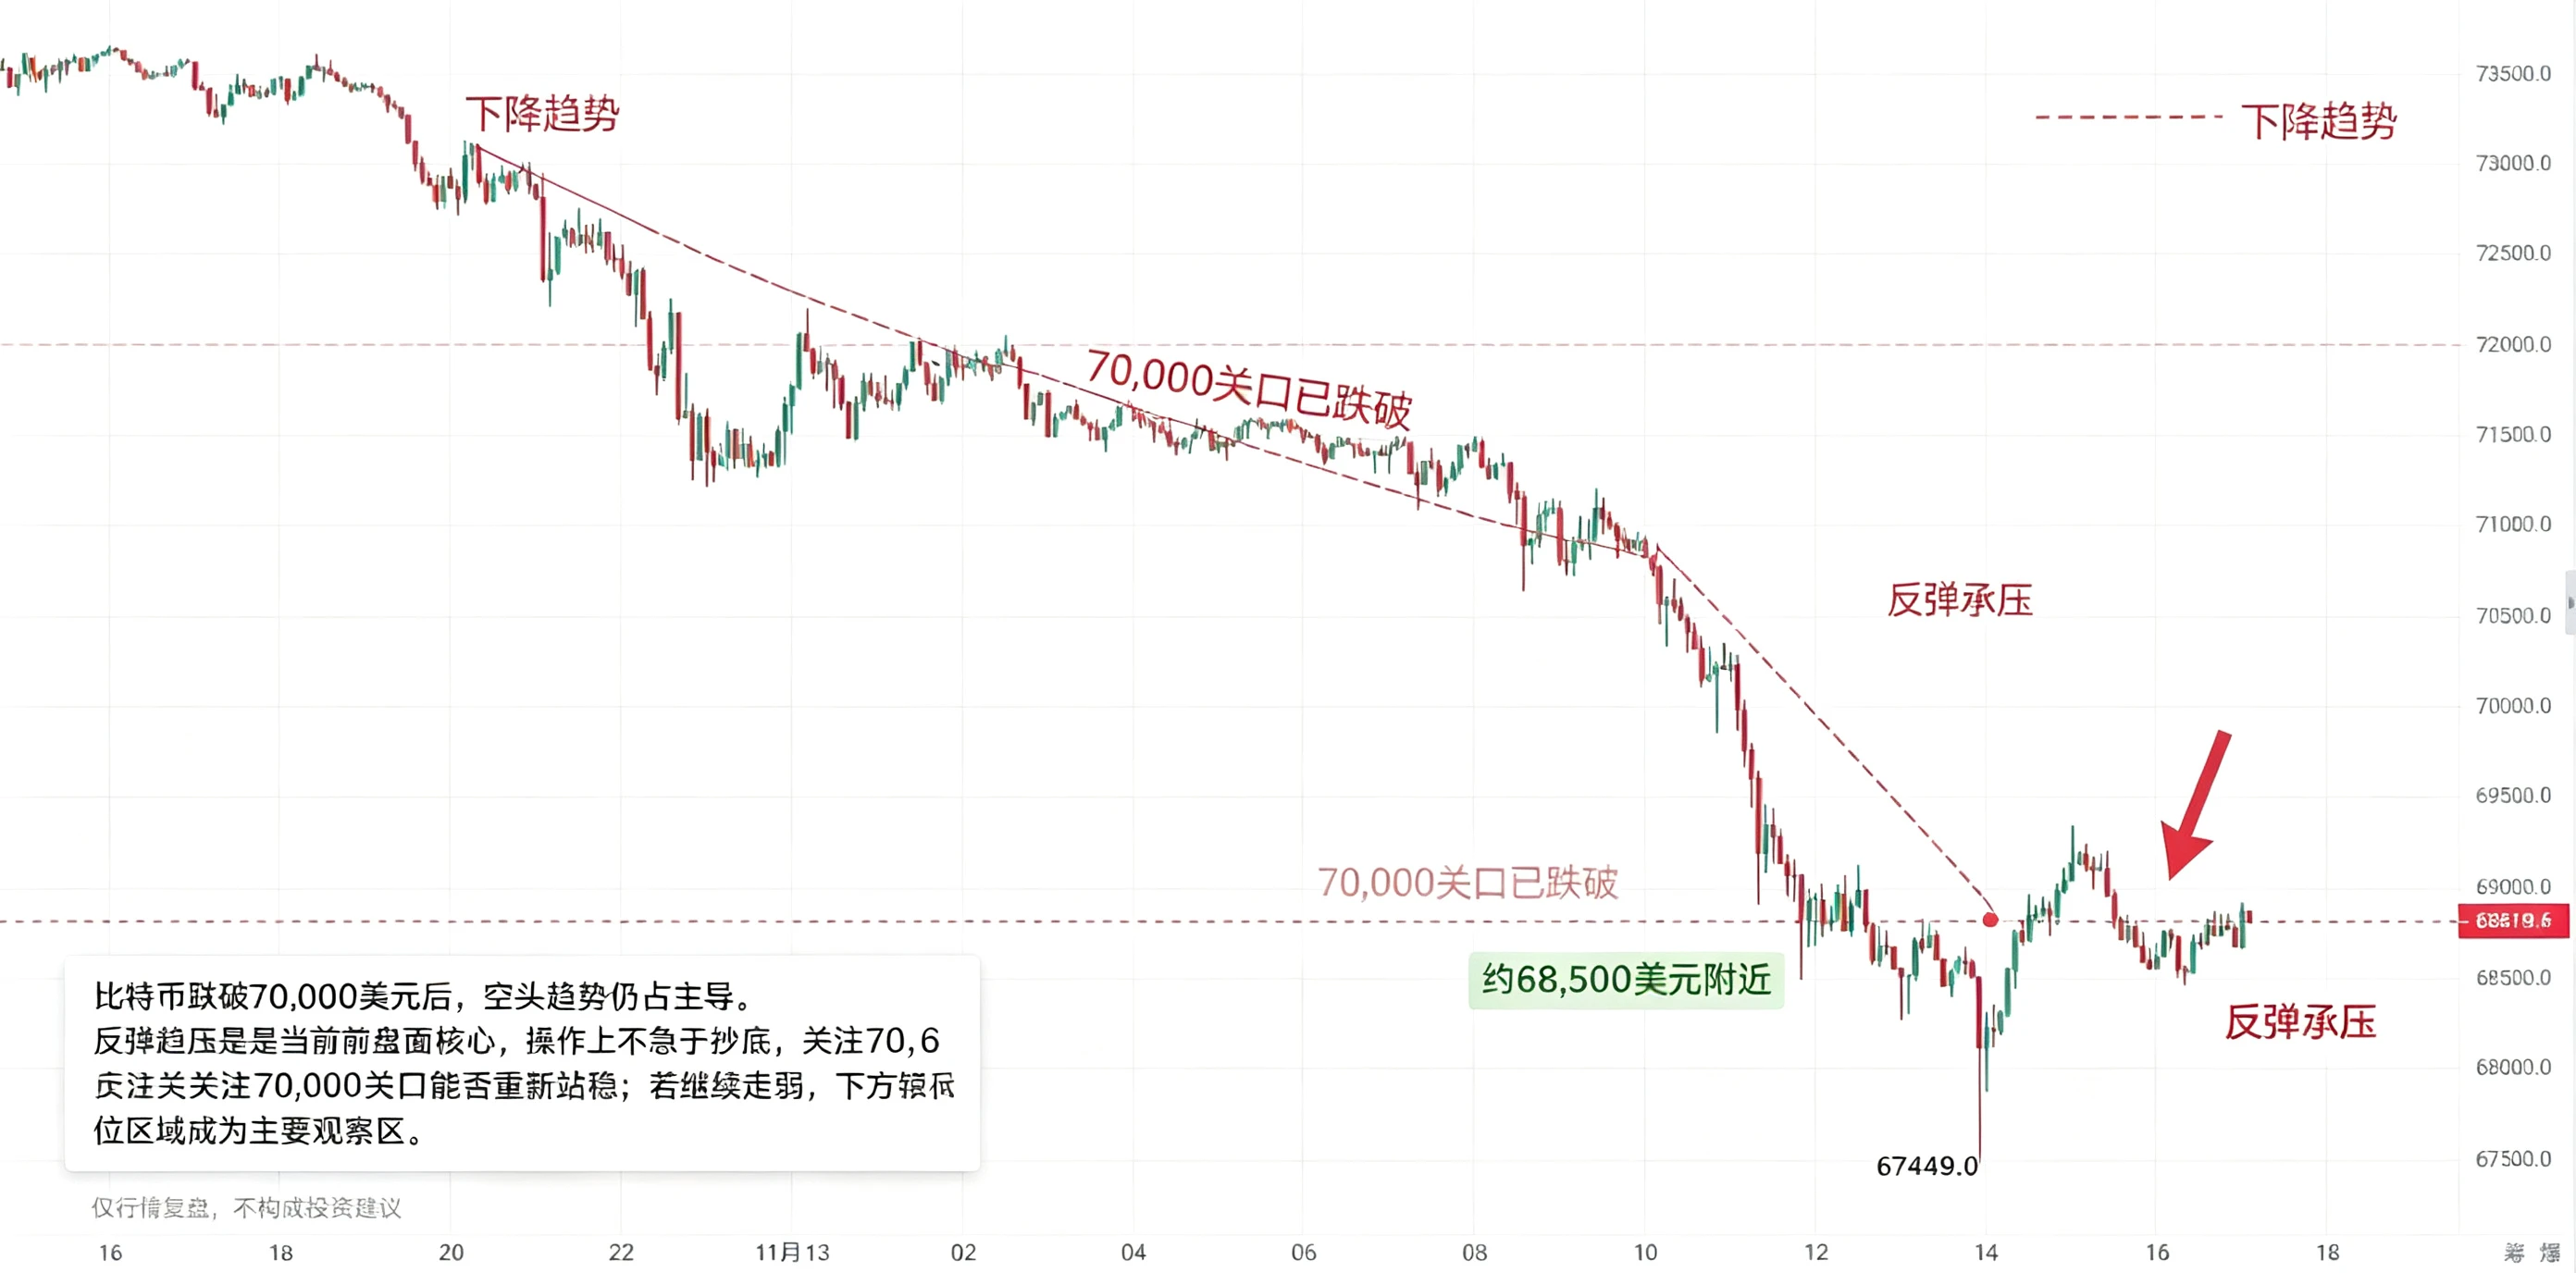
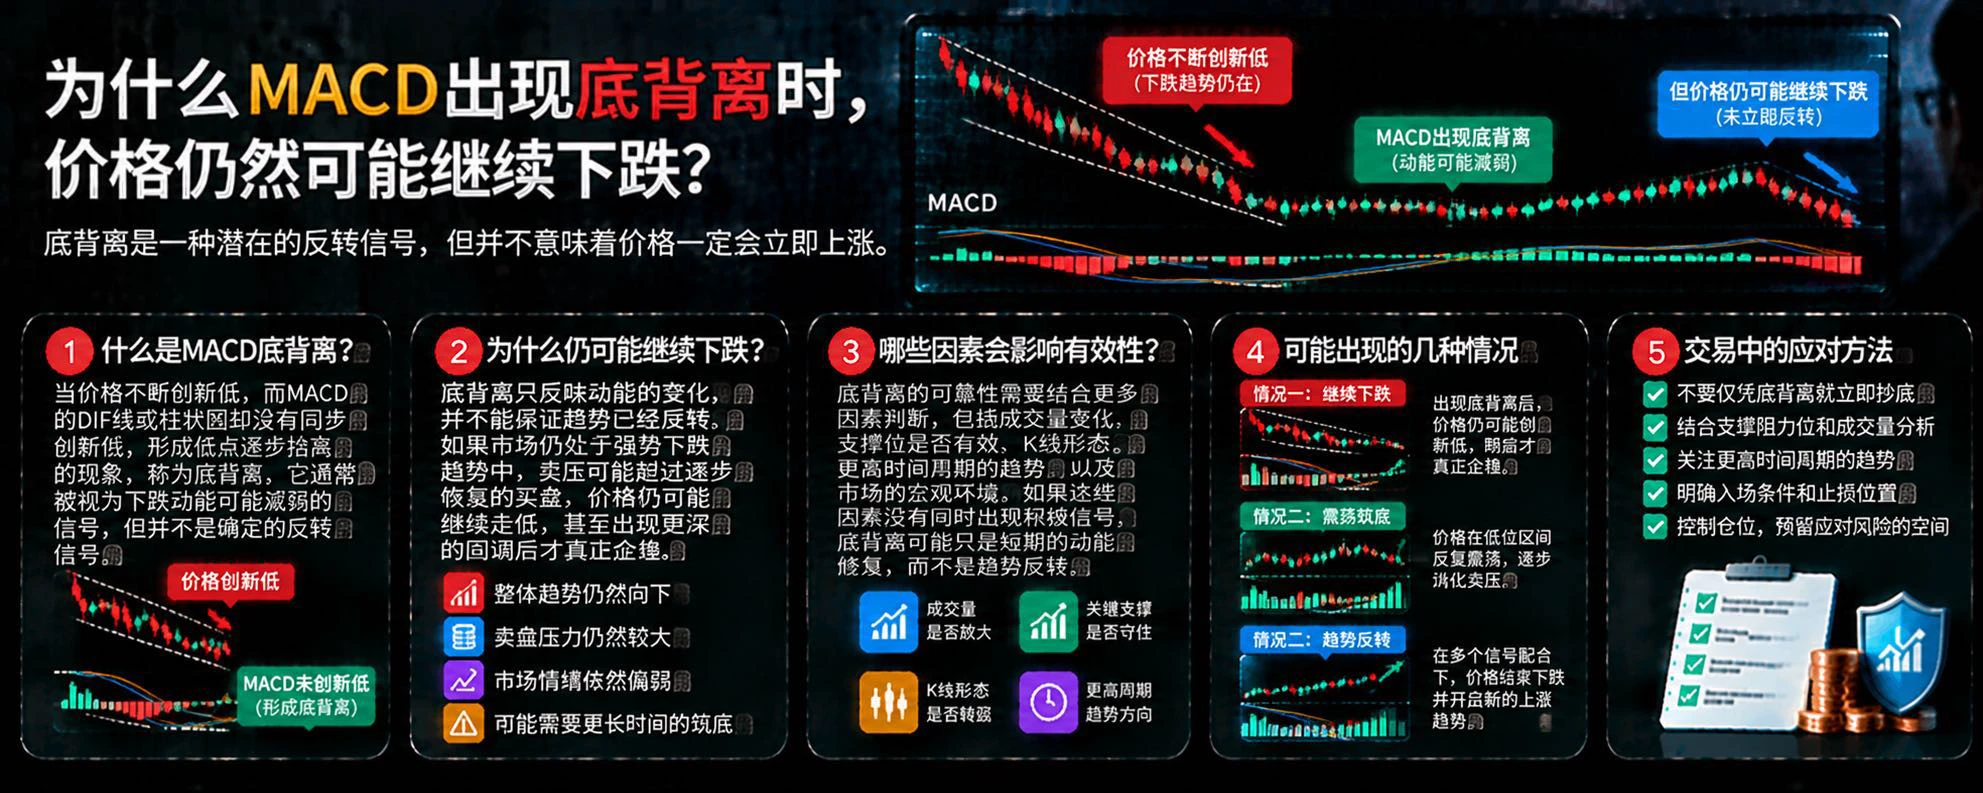
Watch whether Bitcoin can reclaim and hold the 70,000 level; if weakness continues, the lower price zone remains the key area to monitor.

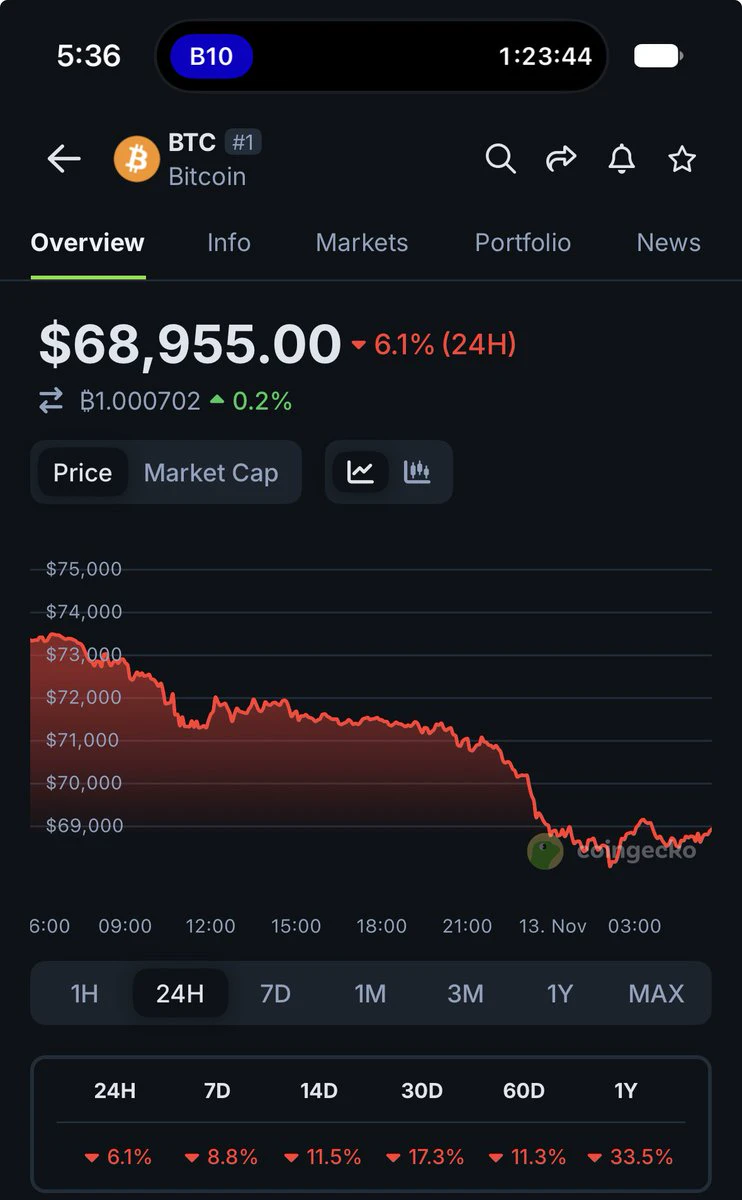
Bitcoin has continued to weaken from its highs, falling to a new recent low of 67449 before a slight rebound. It is currently moving sideways near the lows around 68800.
The broader trend remains dominated by bears. This decline has been driven by macro factors such as inflation and expectations of high interest rates. The current rebound is a recovery after the sell-off, not a reversal.
With heavy resistance overhead, prioritize looking to short rallies un
post-image
BTC-0.67%
market prices updates
live-cover
LIVE1,901
$AKE Fuck, what the hell, why are the top two on the leaderboard pulling so hard today? I only went short with 2,000u, thinking I’d make enough for dinner tonight, and I still lost 1,000u. $AKE
post-image
AKE+6.07%
  • 1
$ERA Down 20% in a day—is 0.0777 a rock-solid bottom? It’s like a fire sale at the market before closing: it looks cheap, but it could be even cheaper tomorrow. The current price is 0.0788, with 24-hour trading volume of $99.4 million. The intense turnover shows bulls and bears are battling it out around 0.078. Technically, it has plunged nearly 23% from 0.1009 to 0.0777. It’s oversold in the short term, but there are no signs of stabilization. If on-chain volume keeps surging on the way down, panic selling isn’t over yet. My approach: don’t catch a falling knife. Wait for volume to contract a
ERA+24.21%
  • 2
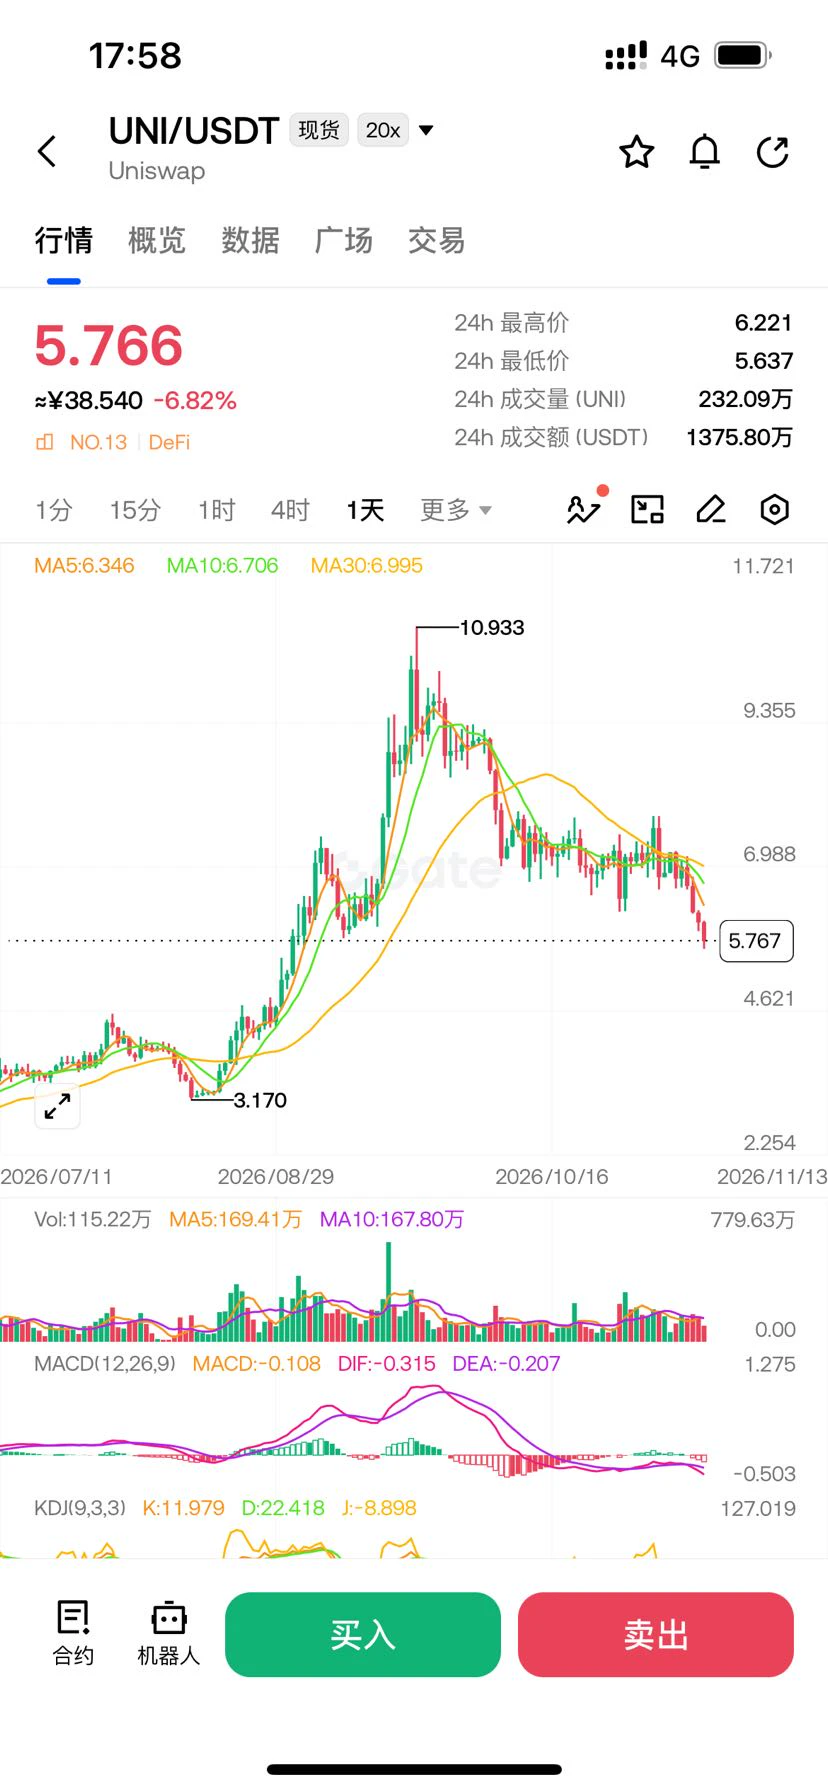
$UNI This morning, I stared at its trading value in disbelief—59 million, with volume at 1.6 times its usual level, while the price kept plunging below 6. At the time, I said it looked like a large player was unloading.

I kept watching in the afternoon. It was down more than 5%, with 17% gone over 7 days. This isn't the work of retail traders; they can't sell off with this kind of consistency.

What really caught my attention wasn't the drop, but that it was still on the “biggest losers” list—when something stays near the top of that list for a while, someone always wants to try catching the
post-image
UNI+3.05%
In cryptocurrency trading, many people watch BTC candlestick charts every day but don't know how to tell whether the market is currently in an uptrend or a downtrend. In fact, there is a very common technical indicator that can help us see the market's direction more clearly: the Moving Average, or MA.

So, what do MA20, MA50, and MA200 represent?

First, the MA20 short-term moving average. It reflects recent price movements and is relatively sensitive to short-term market conditions. When BTC trades consistently above the MA20 and the average slopes upward, it usually indicates relative short
post-image
BTC-0.67%
Load More

Join 40 M users in our growing community

⚡️ Join 40 M users in the crypto craze discussion

💬 Engage with your favorite top creators

👍 See what interests you

Trending Topics

JensenHuangResigns

514.6K Views8.1K Discussing

Jensen Huang has resigned as NVIDIA CEO and stepped down from the board. CFO Colette Kress will serve as interim CEO while NVIDIA considers internal and external successors. $NVDA fell more than 10% in premarket trading following the announcement. With one of AI’s most influential leaders stepping aside, markets are now reassessing NVIDIA’s leadership stability, AI strategy, and long-term valuation.

GateIPOAccessAnthropic

279.6K Views2.6K Discussing

Dr.HanOxfordUnionSpeech

144.5K Views452 Discussing

View More