

Square
Following
Hot
News
Notifications
Profile
Share your thoughts
placeholder
Article
🐋 WHALE WATCH : Bitmine generated $121.4M in staking and validation revenue 97% of its total. It also posted a $6.31B net loss.
The gap is $ETH . A 44% price drop in the fiscal year turned the balance sheet into a paper catastrophe. The business earned. The asset destroyed it.
post-image
BMNR+6.41%
ETH-1.26%
market update
live-cover
LIVE1,898
Trenches
Max
M
bade
b
Max
5qaP...pump
Market Cap
$.
Change
.
24h Vol
$.
Holders
.
mihao
m
bade
b
mihao
4Cxj...pump
Market Cap
$.
Change
.
24h Vol
$.
Holders
.
AGT
A
bade
b
AGT
0x5d...e274
Market Cap
$.
Change
.
24h Vol
$.
Holders
.
DacityCoin
D
bade
b
DacityCoin
DKYc...pump
Market Cap
$.
Change
.
24h Vol
$.
Holders
.
Max
M
bade
b
Max
HPSp...h53z
Market Cap
$.
Change
.
24h Vol
$.
Holders
.
MSCI’s exclusion of MicroStrategy (MSTR) is now official, but the impact on capital flows has yet to materialize, and its underlying business model is facing a “Davis double whammy.”

Short term (before the end of November): There is clear, unavoidable selling pressure. About $2.8 billion in passive funds must be fully liquidated before the market closes on November 30—a “Sword of Damocles” hanging overhead.

Medium term (over the next few months): The financing flywheel is facing obstacles. Pressure on the share price will dramatically increase the cost of issuing new shares to buy Bitcoin. M
post-image
MSCI+0.71%
MSTR+1.10%
BTC-0.67%
  • 3
Why Can a Strategy Perform Well in a Trending Market but Suffer Consecutive Losses in a Range-Bound Market?

Have you noticed this phenomenon?

When the market rises steadily, a strategy may seem to generate accurate signals and consistent profits. But when prices start moving sideways and fluctuating up and down, the same strategy may hit stop-losses repeatedly.

Why can the results be completely different when the trading rules haven’t changed?

The answer may be that a strategy’s edge often depends on specific market conditions rather than working in every market.

I. What’s the Difference
post-image
Bitcoin ETFs continue to see outflows. What signal is the market sending?

Recently, the Bitcoin market has shown a concerning trend: U.S. spot Bitcoin ETFs are experiencing a significant wave of net outflows. This is about more than price volatility; it also reflects some investors reassessing risk.

According to public data as of November 11, 2026, U.S. spot Bitcoin ETFs have seen cumulative net outflows of about $1.61 billion this month. On November 5, net outflows totaled about $430.2 million in a single day, followed by $411.9 million in net outflows on November 6. Outflows narrowed over
post-image
BTC+1.22%
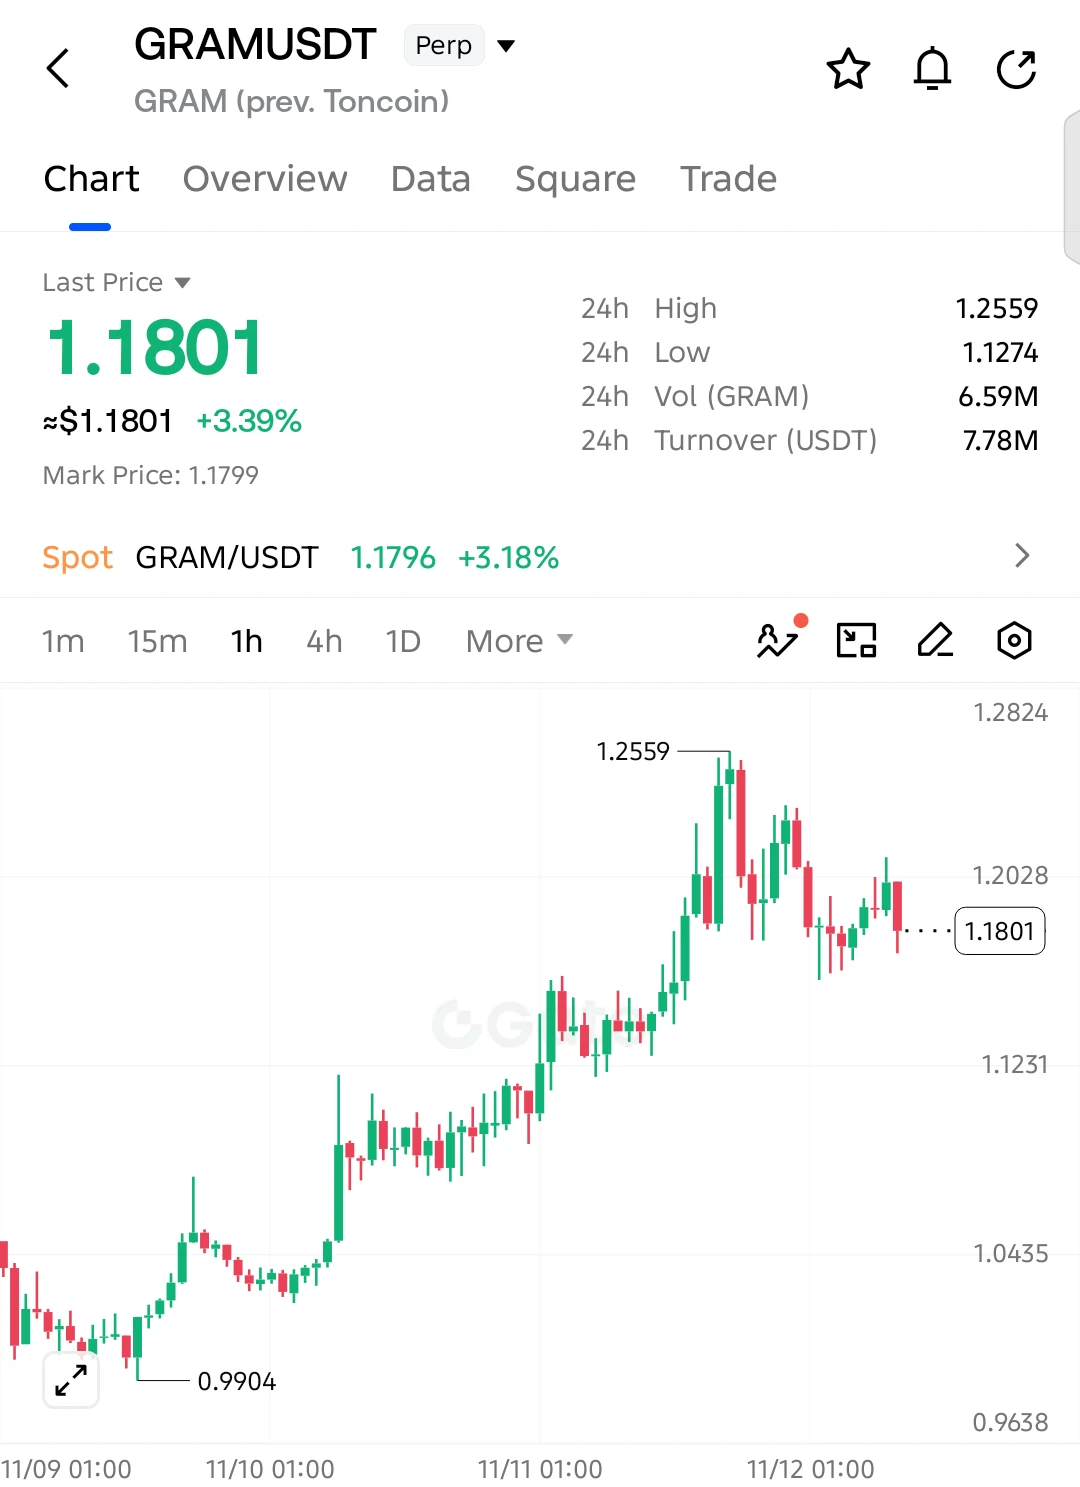
$GRAM LONG SETUP — BULLS PREPARING FOR ANOTHER PUSH!

Entry: 1.1801
SL: 1.1450

TP1: 1.2050
TP2: 1.2300
TP3: 1.2559

$GRAM remains up 3.39%, with buyers maintaining a broader bullish structure despite the recent pullback. Price is consolidating above the 1.15 support area, keeping another recovery possible. A strong move above 1.2050 could bring the previous high back into focus.

Invalidation: A sustained break below 1.1450 weakens the bullish setup.
post-image
GRAM-0.97%
  • 2
#Gate直通IPO第三期Anthropic Jump in big—could the AI sector create another fortune? Anthropic’s IPO valuation is targeting $1.4 trillion. Can 100 USDT get you in?

The AI world is truly buzzing lately! Anthropic, the company behind Claude, is officially moving forward with its IPO, with a reference fully diluted valuation of up to $1.4 trillion and an indicative offering price of $70–78 per share. Those numbers make you exclaim: AI hasn’t taken over the world yet, but its valuation has already taken over our wallets! 😂
Gate is now launching its third IPO subscription, accepting USDT with a minimum
post-image
BTC-0.65%
SPCX-2.32%
$JCT Halved in a day, down 25% in 24 hours, plunging straight from 0.0085 to 0.0045, with 427 million in trading volume—this isn’t a pullback; it’s a scramble for the exits.
First, the market action. $JCT opened today near 0.006. After 10 a.m., it sold off in successive waves on rising volume, with every rebound pushed back down by even larger sell orders—a classic cascade of profit-taking and stop-losses hitting together. The 24-hour low was 0.0044, and it’s now hovering at 0.0045, right near the floor. Trading value of 427 million shows extremely heavy turnover. A lot of panic selling has al
  • 8
  • 1
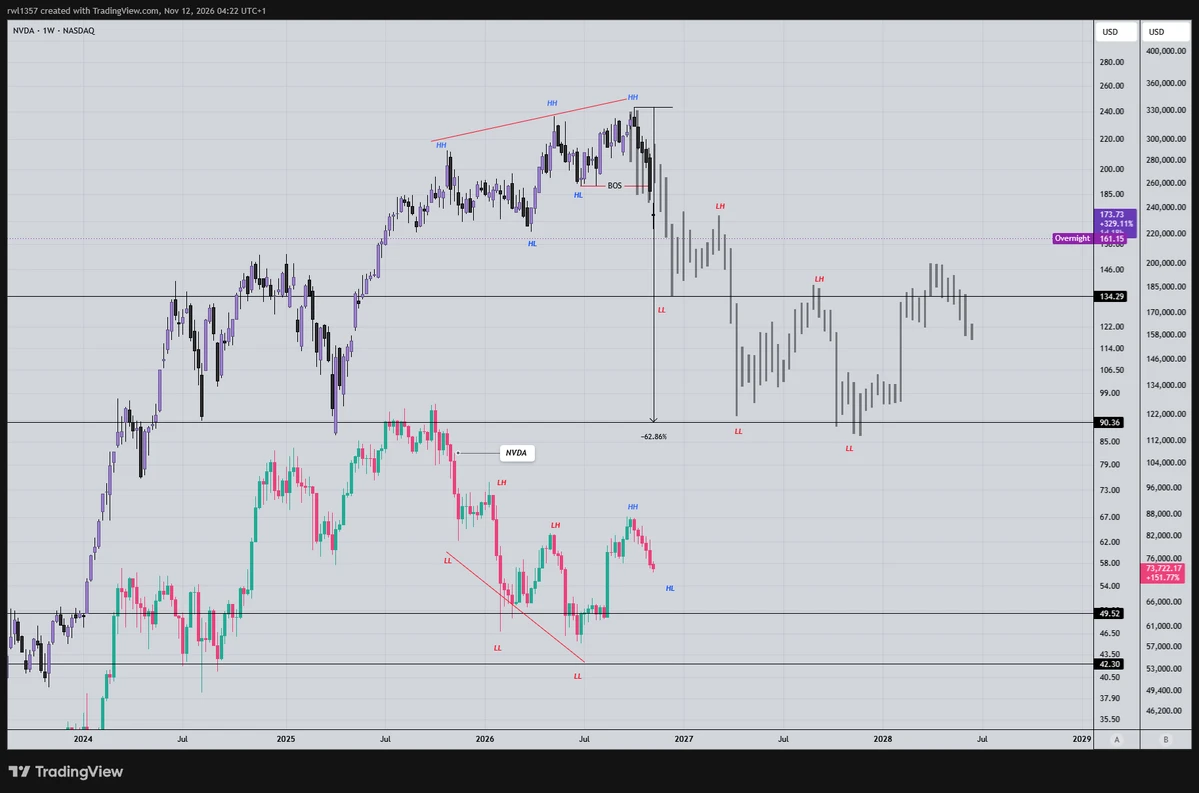
Let’s be fair, nothing is random and if you think this NVDA shenanigan was real, you’re a bum. Everything was already meant to be this way, but they needed a narrative to justify the selling. It’s the same every time an asset breaks structure they need a narrative to justify it.
As we know, crypto will always predict the future of any asset above it on the risk curve, because crypto dumps first, starting with altcoins, then Bitcoin, and eventually the domino effect moves forward into the stock market, the metals market, the bond market, and so on, until everything gets a reset and a new cycle
post-image
NVDA+2.99%
BTC-0.67%
AI is changing how companies make money! Could the most profitable companies of the future be non-tech companies?

When people talked about AI in the past, they first thought of chip giants, model developers, and major technology platforms.
But as commercialization advances, AI's value may gradually spread to traditional industries.
A manufacturing company using AI to optimize its supply chain may reduce inventory and waste; a retailer analyzing consumer behavior with AI may improve sales conversion rates; a logistics company using an intelligent dispatch system may lower transportation costs.
AMD+7.27%
  • 13
How to Set Reasonable Stop-Loss and Take-Profit Levels in BTC Trading?

In BTC futures trading, many people spend a lot of time looking for the best entry point but overlook two more important questions: Where should you exit if your market view is wrong? And if the market moves as expected, where should you lock in profits?

In fact, the entry marks the start of a trade, while the stop-loss and take-profit determine its final outcome.

First, stop-loss levels should be based on clear reasoning. Don’t arbitrarily set a fixed loss amount; instead, determine your stop-loss based on key support a
post-image
BTC-0.65%
AI commercialization is entering its second half! The next wave of wealth opportunities may lie in these three keywords!

The AI industry is shifting from a technology race to commercial competition. In the past, the market focused on how powerful models were; now, it is starting to focus on whether companies can keep making money.
If you're looking for areas worth watching in the next phase, keep an eye on three keywords.
The first is computing power. As AI models and applications continue to develop, training and inference still require computing resources, but investors should also pay atte
SPCX-2.32%
  • 13
Does a price breakout above resistance mean a rally is about to begin?

In crypto trading, many people have experienced this:

The price finally breaks through a key resistance level, and trading volume also increases. Traders think a rally is about to begin and chase the move, only for the price to suddenly reverse and fall back into its previous range.

This is the “false breakout” often discussed in trading.

What really needs to be judged is not just whether the price has broken out, but whether the market can continue to accept higher prices afterward.

I. What is a false breakout?

A fal
post-image
【SKYAI】Long · Open/Entry Entry Market #SKYAI triangle breakout, moving upward in a choppy trend along the trendline; enter long with a small position at market
post-image
SKYAI-7.58%
Why can a strategy perform very well in trending markets but suffer consecutive losses in choppy markets?

Have you noticed a phenomenon?

When the market keeps rising, a strategy seems to generate accurate signals and steady profits; but when prices start moving sideways and fluctuating up and down, the same strategy may hit stop-losses in a row.

Why do the results change completely when the trading rules have not changed?

The answer may lie in this: a strategy's edge often depends on a specific market environment, rather than working in all market conditions.

I. What exactly is the differ
post-image
Why can a trading strategy’s returns look stable while hiding significant risks?

A trading strategy earns a little each day, records multiple consecutive wins, and rarely loses.

At first glance, this may seem like a very stable strategy.

But if the market suddenly reverses, the profits accumulated earlier may quickly disappear, or losses may even far exceed expectations.

Why does this happen?

Because stable returns do not mean low risk, and a high win rate does not guarantee long-term profitability.

To determine whether a strategy is reliable, you need to look at the risk structure behin
post-image
Telegram also hides security traps! SlowMist warns that the new message-embedding feature in apps ca
live-cover
LIVE1,851
11.12 Thursday Midday Market Analysis
The downtrend has yet to reverse. ETH's most obvious issue is not whether it can stage a short-term rebound, but that rebounds have consistently failed to change the broader weak structure.
On the 4-hour chart, after peaking near 2449 and pulling back, ETH has continued to form lower highs and lower lows, with a low near 2003. Although the price has climbed back to 2055, it remains in a downtrend overall.
After previously rebounding to 2103.6, ETH faced selling pressure again on the 4-hour chart, indicating clear supply pressure around 2100. The rebound fa
post-image
ETH-1.23%
BTC-0.67%
Why can a strategy perform very well in a trending market but suffer consecutive losses in a range-bound market?

Have you noticed a pattern?

When the market keeps rising, a strategy may seem to generate accurate signals and steady profits. But when prices start moving sideways and fluctuating up and down, the same strategy may hit stop-losses repeatedly.

Why do the results change completely when the trading rules have not changed?

The answer may be that a strategy’s edge often depends on specific market conditions rather than working in every market environment.

I. What exactly is the dif
post-image
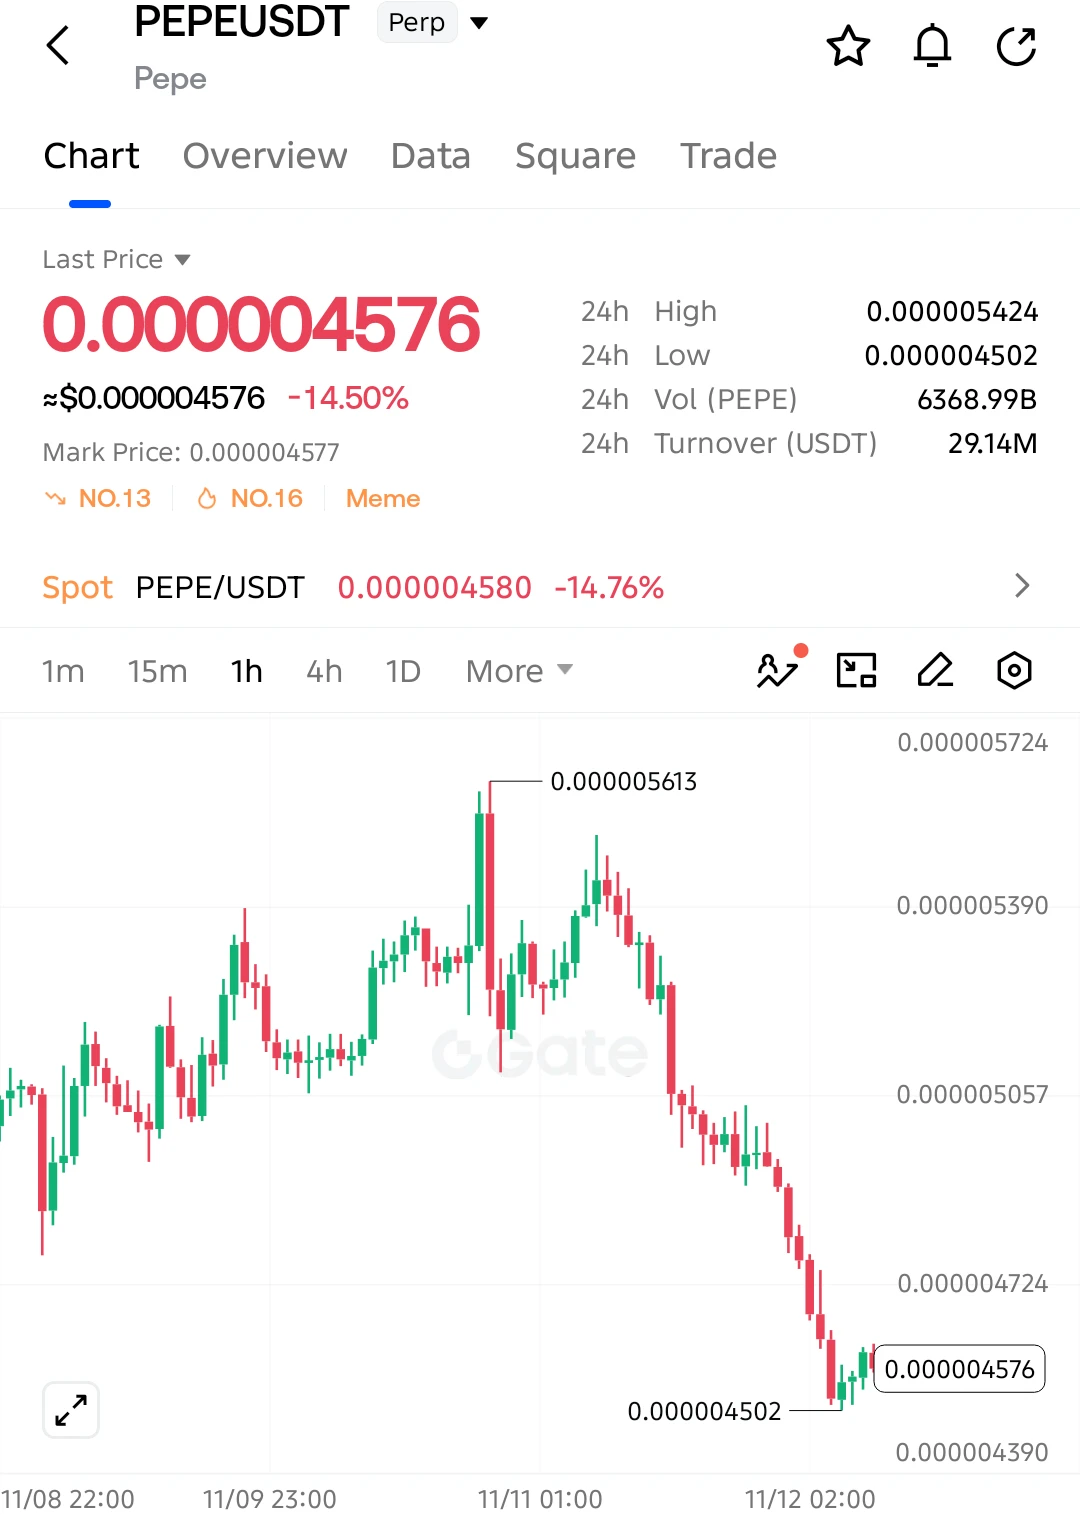
$PEPE SHORT SETUP — BEARS IN FULL CONTROL!

Entry: 0.000004576
SL: 0.000004850

TP1: 0.000004500
TP2: 0.000004300
TP3: 0.000004100

$PEPE has dropped 14.50%, with heavy selling pressure pushing price toward fresh lows. The chart shows a clear bearish structure, and the latest bounce remains weak. If sellers break 0.000004502, another wave of downside could follow.

Invalidation: A sustained recovery above 0.000004850 weakens the bearish setup.
post-image
PEPE+0.97%
  • 4
  • 2
Load More

Join 40 M users in our growing community

⚡️ Join 40 M users in the crypto craze discussion

💬 Engage with your favorite top creators

👍 See what interests you

Trending Topics

GateIPOAccessAnthropic

247.65k Views2.31k Discussing

Gate IPO Access Phase 3 features Anthropic (ANT), with USDT subscription interest starting from 100 USDT. Successful allocations will be delivered as real shares to Gate Stock Accounts. Indicative price: $70–$78/share Subscription: Nov 12–17 (UTC+8) Allocation is not guaranteed. Please manage risk accordingly.

USJoblessClaimsTonight

165.72k Views32.81k Discussing

JensenHuangCouldFaceRemoval

219.19k Views2.42k Discussing

View More