LuxeAnalyst

vip
Active for: 0.7y
Peak Tier 0
Student,crypto lover
I'm trading on Gate, a top-tier exchange with a 13-year track record. Come join me and dive into the hottest events right now! https://www.gate.com/campaigns/5885?ref=BVVEVQ9c&ref_type=132
  • Reward
  • Comment
  • Repost
  • Share
🇯🇵 Japanese stocks are now live on Gate.
Around 300 TSE-listed stocks are available in the first batch — including Toyota, Sony, Nintendo, SoftBank, and more.
No separate Japanese brokerage account. No need to exchange into JPY. Trade directly with USDT.
If you could pick just one Japanese stock, which would it be? 👀
Toyota, Sony, Nintendo, SoftBank — or something else?
👇 Share your Japanese stock picks and trading ideas on Gate Squarehttp://gate.com/post
👉 Trade Japanese stocks now:https://www.gate.com/stocks/285A
SONY1.52%
Gate_Square
🇯🇵 Japanese stocks are now live on Gate.
Around 300 TSE-listed stocks are available in the first batch — including Toyota, Sony, Nintendo, SoftBank, and more.
No separate Japanese brokerage account. No need to exchange into JPY. Trade directly with USDT.
If you could pick just one Japanese stock, which would it be? 👀
Toyota, Sony, Nintendo, SoftBank — or something else?
👇 Share your Japanese stock picks and trading ideas on Gate Square
http://gate.com/post
👉 Trade Japanese stocks now:
https://www.gate.com/stocks/285A
repost-content-media
  • Reward
  • Comment
  • Repost
  • Share
#ETHBreaks2400 Ethereum Surpasses $2,400: Dynamics Behind the Rise
Ethereum (ETH) broke through a significant resistance level, surpassing $2,400 after a long period of downtrend. According to Gate market data, ETH/USDT was trading at $2,401 as of August 21st, with a 24-hour increase of 5.81%. The price peaked at $2,448 during the day, testing its highest level since March.
Increased Institutional Demand
One of the key factors behind the rise is the strong inflows into US spot Ether ETFs. On August 19th, spot Ether ETFs recorded a net inflow of $189 million, the highest daily inflow since Oc
ETH4.83%
BLK1.29%
BTC6.34%
User_any
#ETHBreaks2400 Ethereum Surpasses $2,400: Dynamics Behind the Rise
Ethereum (ETH) broke through a significant resistance level, surpassing $2,400 after a long period of downtrend. According to Gate market data, ETH/USDT was trading at $2,401 as of August 21st, with a 24-hour increase of 5.81%. The price peaked at $2,448 during the day, testing its highest level since March.
Increased Institutional Demand
One of the key factors behind the rise is the strong inflows into US spot Ether ETFs. On August 19th, spot Ether ETFs recorded a net inflow of $189 million, the highest daily inflow since October 2025. BlackRock's ETHA fund accounted for approximately $122 million of this figure. According to data from blockchain intelligence firm Arkham, BlackRock-linked clients made their largest ETH purchase in seven months during this period.
Short Squeeze Effect
Ethereum's break above the $2,000 level triggered a chain-on liquidation wave in leveraged short positions. According to CoinGlass data, over $1 billion in Ether short positions were liquidated during the initial breakout. This was part of a larger liquidation event exceeding $3 billion in the overall crypto market. The forced closing of short positions created additional buying pressure that accelerated the rise.
Macroeconomic Support
The US Treasury Department's announcement that it would increase the maximum size of long-term bond repurchases from $2 billion to $4 billion per operation was another development that boosted risk appetite in the markets. Weakening bond yields and the dollar index supported demand for risky assets, particularly Bitcoin and Ethereum.
Technical Outlook and Risks
Ethereum has broken through the $2,250 resistance zone and the psychological $2,000 level. While the $2,375 level is being tested, the $2,448-$2,500 range is being monitored as short-term resistance. However, the daily RSI indicator has reached 86, entering the overbought zone. This increases the risk of a price correction from current levels. If the price remains above $2,500, targets of $2,625 and $2,750 may come into play.
This post is not investment advice and is for informational purposes only regarding market conditions.
#GateStockInsightsChallenge #BTCETHReboundTradeIdeas #GateBTCSpotTradingRanks#2Globally
$ETH
repost-content-media
  • Reward
  • Comment
  • Repost
  • Share
Solana price clears 200-day SMA with $100 in sight
Solana price surged 25% over the past week and briefly reached $93.39 on Aug. 21 as a market-wide short squeeze pushed SOL above its major moving averages. The breakout has opened a path toward $98 and $100, although an overbought daily reading raises the risk of a short-term pullback.
Solana ( $SOL ) price breaks out of a two-month range
According to data, Solana price was trading near $92 at the time of writing, up almost 5% on the day after moving between $87.57 and $93.39. The advance extended its weekly gain to approximately 25% and carri
SOL4.70%
Berserker_09
Solana price clears 200-day SMA with $100 in sight
Solana price surged 25% over the past week and briefly reached $93.39 on Aug. 21 as a market-wide short squeeze pushed SOL above its major moving averages. The breakout has opened a path toward $98 and $100, although an overbought daily reading raises the risk of a short-term pullback.
Solana ( $SOL ) price breaks out of a two-month range
According to data, Solana price was trading near $92 at the time of writing, up almost 5% on the day after moving between $87.57 and $93.39. The advance extended its weekly gain to approximately 25% and carried the token out of the range that had controlled its price since June.
The daily chart shows SOL breaking above the $76–$78 resistance zone, where several recovery attempts had failed during July and early August. The move also cleared the previous swing high near $82, changing the short-term market structure from a series of lower highs to a higher high.
Trading activity expanded during the breakout, supporting the move beyond the former range. SOL has now returned to price levels last seen in May, when sellers repeatedly defended the area between $94 and $98.
The rally followed a broader cryptocurrency short squeeze that erased more than $4 billion in bearish positions over 48 hours. Solana’s faster rise relative to several large-cap assets reflected its tendency to record wider moves during changes in crypto market sentiment.
Short squeeze meets institutional and network catalysts
The derivatives-driven rally received additional support from Shinhan Asset Management’s announced partnership with the Solana Foundation. The South Korean asset manager plans to test a Korean won-denominated tokenized bond fund modeled on BlackRock’s BUIDL product.
The pilot adds to Solana’s effort to attract tokenized real-world assets and institutional financial products. However, its effect on SOL demand will depend on the fund’s eventual size, launch terms, and on-chain activity, none of which were established by the price charts.
Network activity also supported the bullish narrative after Solana reportedly processed 1.2 billion non-vote transactions in one week. A recent increase in the compute limit per block gave applications more capacity, while the planned Alpenglow upgrade aims to reduce finality times and change how validator votes are handled.
Broader US market conditions helped risk assets as well. The supplied market context linked the recovery to increased US Treasury buybacks, falling long-term yields, and a weaker dollar. Washington’s renewed push for the Digital Asset Market Clarity Act and the SEC’s proposed Regulation Crypto Assets framework also contributed to improving regulatory sentiment, though both initiatives still require further action before becoming final policy.
SOL’s overbought RSI warns against chasing
The daily chart confirms the strength of the breakout but also shows that momentum has become stretched. SOL’s 14-day relative strength index reached 81.74, well above the 70 level commonly associated with overbought conditions.
An overbought RSI does not require an immediate reversal. It does, however, show that price has risen much faster than its recent average and may need to consolidate before another sustainable advance.
SOL now trades above its 20-day simple moving average at $77.06, its 50-day average at $76.92 and its 100-day average at $76.38. The token also cleared the 200-day average near $81.18, which had acted as the most important long-term barrier on the chart.
The tight grouping of the shorter averages around $76–$77 identifies the base of the breakout. A later decline into that region would represent a full retest, although nearer support sits at $87–$90.
The 4-hour chart shows similarly stretched conditions. SOL traded near $92 while the upper Bollinger Band stood at $94.19. The middle band was much lower at $83.54, showing how quickly the price separated from its recent mean.
#SOL
repost-content-media
  • Reward
  • Comment
  • Repost
  • Share
BMNR broke through the daily resistance level
This is an important bull market indicator
Everyone can keep an eye on it
BMNR5.77%
JsBigShark
BMNR broke through the daily resistance level
This is an important bull market indicator
Everyone can keep an eye on it
  • Reward
  • Comment
  • Repost
  • Share
#GateStockInsightsChallenge
The premise of this challenge is simple but demanding: stop describing candles and start translating Gate exchange data into equity-style investment memos. Anyone can say BTC is up, a stock analyst must say why it matters to cash flow, buybacks, and valuation. Here is how I read the current tape through that lens.
My first holding in this framework is not Bitcoin itself but the exchange infrastructure that taxes Bitcoin volatility. HYPE at 72.71 is trading above its prior intraday high of 72.61, after a base at 58.07. The raw tape showed 69.48 up 18.91% with volu
HYPE2.50%
BTC6.34%
XRP9.86%
Venüs_
#GateStockInsightsChallenge
The premise of this challenge is simple but demanding: stop describing candles and start translating Gate exchange data into equity-style investment memos. Anyone can say BTC is up, a stock analyst must say why it matters to cash flow, buybacks, and valuation. Here is how I read the current tape through that lens.
My first holding in this framework is not Bitcoin itself but the exchange infrastructure that taxes Bitcoin volatility. HYPE at 72.71 is trading above its prior intraday high of 72.61, after a base at 58.07. The raw tape showed 69.48 up 18.91% with volume 554.95K and turnover 36.80M, EMA5 69.50 EMA10 68.38 EMA30 64.31 and MFI 74.92. That structure alone is bullish, but the stock-level insight is the fee model. Hyperliquid prints $357B monthly derivatives volume, converts it into $105M monthly fees, and directs 97% to spot buybacks. That is a 29% take-rate compression story with 75% market share and $31B wallet equity as moat. In equity terms, this is like owning the NYSE during a volatility expansion while the exchange itself shrinks its share count. The 180-day performance of +134.20% and 1-year +61.55% versus sector decline is not momentum chasing, it is earnings revision. My framework treats a break of 72.71 as earnings beat, with risk defined by EMA30 at 64.31.
My second position is the distressed-to-quality turnaround that equity funds live for. XRP now at 1.31, previously captured at 1.3064 up 19.31% with 24h high 1.3451 low 1.0945, volume 87.01M turnover 107.23M, EMA5 1.2942 EMA10 1.2780 EMA30 1.2128, MFI 75.9779, performance Today 5.05% 7 days 30.78% 30 days 14.79% 90 days -4.78% 180 days -5.61% 1 year -54.64%. That performance matrix is a classic value investor's setup: down 54.64% on a one-year basis due to legal overhang, but up 30.78% in 7 days and 14.79% in 30 days on 107.23M turnover as that overhang compresses. The volume profile from 1.0032 base to current shows institutional inventory rebuild, not retail FOMO. Stock insight: I model XRP as a payment-rail utility whose regulatory risk premium is falling from 40% to 15%, which mechanically lifts fair value by 30-40% even without user growth. Holding above EMA5 1.2942 at 1.31 confirms the market is repricing that premium.
My third anchor is the large-cap leader that clears the path for everything else. BTC/USDT spot at 77,285.9 up 6.59% and perp at 77,260.7 up 6.55% with 24h range 72,331.1 to 79,520.0, volume 23.83K turnover 1.81B, EMA5 76,204.3 EMA10 74,322.0 EMA30 69,758.2, average entry 63,379.3, MFI 90.3, performance Today 6.34% 7 days 22.86% 30 days 17.25% 90 days 0.00% 180 days 14.67% 1 year -31.27%. Previously BTC at 74,881 had already cleared the $1B short liquidation cluster at 69,000 that triggered $101.67M BTC and $43.3M ETH liquidations in 24h and $800M aggregate. The extension to 79,520.0 and acceptance at 77,285.9 shows that liquidation cascade has now reset open interest lower by 12-18% and replaced it with spot turnover. Equity analogy: this is a heavily shorted large-cap clearing its short interest, like TSLA in 2020, where turnover of 1.81B confirms real demand. MFI 90.3 is overbought, but in equity terms, overbought with expanding EMA gaps of $1,882 and $4,563 is markup, not top.
Together, these three translate Gate data into a portfolio: HYPE 72.71 as growth compounder with buyback yield, XRP 1.31 as mean-reversion value, BTC 77,285.9 as liquidity leader. The edge is not calling direction but linking price, volume, turnover, EMA and MFI to fee revenue, market share, and risk premium compression.
repost-content-media
  • Reward
  • Comment
  • Repost
  • Share
🇯🇵 Japanese stocks are now live on Gate.
Around 300 TSE-listed stocks are available in the first batch — including Toyota, Sony, Nintendo, SoftBank, and more.
No separate Japanese brokerage account. No need to exchange into JPY. Trade directly with USDT.
If you could pick just one Japanese stock, which would it be? 👀
Toyota, Sony, Nintendo, SoftBank — or something else?
👇 Share your Japanese stock picks and trading ideas on Gate Square
http://gate.com/post
👉 Trade Japanese stocks now:
https://www.gate.com/stocks/285A
#GateLaunchesJapaneseStockTrading
Venüs_
🇯🇵 Japanese stocks are now live on Gate.
Around 300 TSE-listed stocks are available in the first batch — including Toyota, Sony, Nintendo, SoftBank, and more.
No separate Japanese brokerage account. No need to exchange into JPY. Trade directly with USDT.
If you could pick just one Japanese stock, which would it be? 👀
Toyota, Sony, Nintendo, SoftBank — or something else?
👇 Share your Japanese stock picks and trading ideas on Gate Square
http://gate.com/post
👉 Trade Japanese stocks now:
https://www.gate.com/stocks/285A
#GateLaunchesJapaneseStockTrading
  • Reward
  • Comment
  • Repost
  • Share
#GateDebutsMOUTAIAnd9OtherA-Shares
A-shares can now be accessed through perpetual contracts on Gate — and that changes the way traders can gain exposure to some of China’s biggest listed companies.
Gate has introduced USDT-settled perpetual contracts linked to 10 popular A-share names, bringing companies such as Kweichow Moutai, China Shenhua, Yangtze Power, Midea and Hygon Information into a crypto-native derivatives environment.
This is an interesting development because it connects two markets that traditionally operate very differently.
A-share investors normally trade the underlying equi
MrFlower_XingChen
#GateDebutsMOUTAIAnd9OtherA-Shares
A-shares can now be accessed through perpetual contracts on Gate — and that changes the way traders can gain exposure to some of China’s biggest listed companies.
Gate has introduced USDT-settled perpetual contracts linked to 10 popular A-share names, bringing companies such as Kweichow Moutai, China Shenhua, Yangtze Power, Midea and Hygon Information into a crypto-native derivatives environment.
This is an interesting development because it connects two markets that traditionally operate very differently.
A-share investors normally trade the underlying equities through China’s stock-market infrastructure.
A perpetual contract, by contrast, is a derivative whose price is designed to track the underlying reference asset while allowing market participants to express bullish or bearish views without directly owning the stock.
The important distinction is that buying a perpetual contract is not the same thing as buying the underlying A-share.
The initial group includes:
$MOUTAI — Kweichow Moutai
$CHINA SHENHUA — China Shenhua
$YANGTZE — Yangtze Power
$MIDEA — Midea Group
$HYGON — Hygon Information
Alongside five other A-share names included in Gate’s initial launch.
Why does this matter?
Because it expands the range of traditional assets that can be represented inside a crypto-market trading environment.
For crypto traders, the attraction is obvious: familiar concepts such as continuous market access, derivatives pricing and short-term price discovery can now be applied to companies that previously belonged almost entirely to the traditional equity market.
But this also introduces a new layer of complexity.
A-share companies are influenced by fundamentally different factors from cryptocurrencies.
For Moutai, investors may focus on consumer demand, premium liquor pricing, brand strength and Chinese economic conditions.
For semiconductor companies such as Hygon Information, the focus can shift toward AI infrastructure, domestic chip development, technology restrictions and semiconductor demand.
For power companies such as Yangtze Power, electricity demand, hydropower generation, regulation and infrastructure investment become much more important.
For Midea, consumer spending, appliances, exports and manufacturing conditions can have a major influence.
China Shenhua brings another set of variables, including coal prices, electricity demand and energy policy.
So although these assets can now appear within a similar derivatives interface, their underlying fundamentals remain very different.
There is another important point: perpetual contracts can amplify market volatility.
Price movements in the underlying stock can be reflected quickly in the derivative market, while leverage and derivatives positioning can add another layer of risk. A strong move in either direction can therefore produce much larger changes in a trader’s position than the underlying stock movement alone.
This makes risk management especially important.
The most interesting part of this launch may actually be the broader trend.
Crypto exchanges are increasingly expanding beyond traditional cryptocurrencies into stocks, commodities, indices and other real-world assets.
The boundary between traditional finance and digital-asset markets is becoming increasingly flexible.
Instead of asking whether crypto and traditional markets will eventually interact, the more relevant question may be how deeply these markets will integrate.
For investors, however, the fundamentals still matter.
A derivative does not change the underlying business.
Moutai remains a consumer company.
Hygon remains a semiconductor company.
Yangtze Power remains an electricity and infrastructure company.
Midea remains a global appliance and manufacturing business.
China Shenhua remains exposed to the energy sector.
The new contract format simply creates another market through which participants can gain price exposure.
My biggest takeaway from the launch is therefore not simply that “A-shares can now be traded through contracts.”
It is that the financial market is continuing to converge.
Crypto infrastructure is moving toward traditional assets.
Traditional assets are becoming increasingly accessible through digital platforms.
And derivatives are becoming a bridge between the two.
The next question is how investors will value these new markets once liquidity, volume and price discovery mature.
Would you rather watch the semiconductor exposure of $HYGON, the consumer strength of $MOUTAI, the infrastructure story of $YANGTZE, the energy exposure of $01088, or the global manufacturing business of $MIDEA?
The interesting part of this experiment has only just begun.
@Gate_Square
  • Reward
  • Comment
  • Repost
  • Share
$MRVL #GateStockInsightsChallenge
Marvell Technology Stock Rises 10%: AI and Semiconductor Rally Continues
Marvell Technology (MRVL) shares closed Wednesday's regular trading session on the Nasdaq up 9.86%, reaching $237.35. The intraday high was $245.48, and the low was $228.15. Trading volume was notable, nearly double the average daily volume. In after-hours trading, the stock rose as high as $240.39.
This rise is driven by continued strong demand for AI and data center infrastructure. Marvell has become a key player in the AI hardware ecosystem, particularly with its custom ASIC (Applica
MRVL-5.61%
M谋ngYueZen
$MRVL #GateStockInsightsChallenge
Marvell Technology Stock Rises 10%: AI and Semiconductor Rally Continues
Marvell Technology (MRVL) shares closed Wednesday's regular trading session on the Nasdaq up 9.86%, reaching $237.35. The intraday high was $245.48, and the low was $228.15. Trading volume was notable, nearly double the average daily volume. In after-hours trading, the stock rose as high as $240.39.
This rise is driven by continued strong demand for AI and data center infrastructure. Marvell has become a key player in the AI hardware ecosystem, particularly with its custom ASIC (Application-Specific Integrated Circuit) chips and data center connectivity solutions. The company develops custom AI chips for major cloud providers and also holds a strong position in data center connectivity with 800G and 1.6T optical interfaces.
The company will release its second-quarter earnings on August 27th. Market expectations are for continued strong demand in the AI segment. In the last quarter, the company reported increased AI-related revenue and indicated that this trend is expected to continue. Analysts predict that Marvell's market share gains in AI-specific chips will offset weakness in traditional storage and networking segments.
However, there are some risks to consider across the sector. There is growing doubt in the market about when and how the massive investments in AI hardware will yield returns. With capital expenditures (CAPEX) for AI infrastructure by big tech companies at record levels, questions about the sustainability of these expenditures and whether they will translate into revenue are coming to the forefront. The recent semiconductor sell-off also shows that these concerns are still alive in the market.
A critical period is beginning for Marvell in the coming days. The August 27th earnings report will provide the most up-to-date information on the growth rate and margin trends of the company's AI revenue. Furthermore, Federal Reserve Chairman Kevin Warsh's speech in Jackson Hole on August 26th and the Core PCE data to be released the following day will play a critical role in determining overall market sentiment. For Gate users, Marvell's performance serves as a reminder that fluctuations in the semiconductor sector can also impact the cryptocurrency markets. In particular, the Fed's interest rate policy and the trajectory of US Treasury yields will be decisive for both technology stocks and cryptocurrencies, a high-risk asset class.
NFA ✔️ DYOR 🔎
  • Reward
  • Comment
  • 1
  • Share
$COIN Coinbase Stock Rises 10%: Crypto Rally and CFTC Move Boost Market
Coinbase Global (COIN) shares closed Wednesday's regular trading session on the Nasdaq up 9.61% at $160.32. The intraday high was $165.74, and the low was $147.50. Trading volume remained high throughout the day, with the stock rising as high as $165.50 in after-hours trading.
This sharp rise is driven by two key factors. First, a general resurgence in the cryptocurrency market as Bitcoin surpassed the $69,000 level, gaining 6.4%. Since a large portion of Coinbase's revenue is dependent on trading volume, rising prices an
M谋ngYueZen
$COIN Coinbase Stock Rises 10%: Crypto Rally and CFTC Move Boost Market
Coinbase Global (COIN) shares closed Wednesday's regular trading session on the Nasdaq up 9.61% at $160.32. The intraday high was $165.74, and the low was $147.50. Trading volume remained high throughout the day, with the stock rising as high as $165.50 in after-hours trading.
This sharp rise is driven by two key factors. First, a general resurgence in the cryptocurrency market as Bitcoin surpassed the $69,000 level, gaining 6.4%. Since a large portion of Coinbase's revenue is dependent on trading volume, rising prices and increased volatility directly impact the company's profitability. Second, President Trump's statements regarding the CFTC's efforts to bring the Hyperliquid platform to the US. This development has created optimism in the market that regulatory uncertainty in the crypto sector may decrease.
However, the company's key indicators present a mixed picture. Coinbase's last quarter revenue was reported at $1.15 billion, while net loss reached $359.47 million. The company reported a loss of $1.36 per share, significantly below analysts' expectations of a $0.44 loss. Declining trading volumes and rising operational costs are the main factors putting pressure on profitability.
Analyst target prices range widely: estimates varying between $85 and $330 indicate continued uncertainty about the company's future. Coinbase has fallen approximately 64% from its peak of $444.65, and the current price level is above the 52-week low of $118.56, but significantly below the peak of $345.90.
For Gate users, this rise in Coinbase is an indicator of how volatility in the crypto markets is reflected in traditional stocks. With Bitcoin testing the $69,000 resistance level and positive signals emerging from the regulatory front, Coinbase's short-term performance will largely depend on the overall trend in the crypto markets. The upcoming Fed meeting minutes and the Jackson Hole meeting will play a critical role in determining the direction of both cryptocurrencies and Coinbase stock. Furthermore, the company's third-quarter earnings report, to be released on October 29th, will provide a clearer picture of operational performance and profitability.
#GateStockInsightsChallenge
  • Reward
  • Comment
  • Repost
  • Share
$CRCL #GateStockInsightsChallenge
Circle Stock Rises 10%: Arc Mainnet and Strategic Moves Boost Market
Circle Internet Group (CRCL) shares closed Wednesday's regular trading session on Nasdaq up 9.65% at $78.62. The intraday high was $81.21 and the low was $73.69. Trading volume exceeded 22.9 million, nearly double the average daily volume. In after-hours trading, the stock climbed as high as $80.90.
The main driver of the rise was the increasing market expectation that Circle's Arc blockchain network will launch its mainnet on September 16th. Arc is positioned as an open blockchain network
CRCL5.14%
ARC-2.56%
UNI7.85%
USDC0.00%
M谋ngYueZen
$CRCL #GateStockInsightsChallenge
Circle Stock Rises 10%: Arc Mainnet and Strategic Moves Boost Market
Circle Internet Group (CRCL) shares closed Wednesday's regular trading session on Nasdaq up 9.65% at $78.62. The intraday high was $81.21 and the low was $73.69. Trading volume exceeded 22.9 million, nearly double the average daily volume. In after-hours trading, the stock climbed as high as $80.90.
The main driver of the rise was the increasing market expectation that Circle's Arc blockchain network will launch its mainnet on September 16th. Arc is positioned as an open blockchain network designed for global financial markets, specifically focused on stablecoin consensus. The inclusion of global financial giants like BlackRock, DTCC, Mastercard, Visa, and Standard Chartered among the founding validators points to the project's potential for institutional-scale adoption. The testnet has already processed over 500 million transactions and approximately 3 million wallet addresses.
One of the most notable developments brought by Arc is BlackRock's plan to distribute its BUIDL fund on Arc. This will allow institutional investors to subscribe to, redeem, and distribute tokenized fund assets within a single blockchain environment. Furthermore, the collaboration with DTCC aims to tokenize assets held at DTC on Arc. Uniswap's announcement that it will also bring its entire transaction stack to the Arc network indicates a strong start for the network in terms of liquidity and the DeFi ecosystem.
However, the company's key performance indicators present a mixed picture. Second-quarter revenue rose 7% year-over-year to $701 million, while the company reported earnings of $0.18 per share, falling short of analysts' expectations of $0.26. USDC's circulating supply increased 19% year-over-year to $73.3 billion, reaching an all-time high of $76.5 billion in average circulating supply. USDC's share of stablecoin trading volume reached a record high of 70% in June.
However, alongside positive signals, there are also worrying developments within the company. In the last 90 days, internal share sales exceeded 2 million, reaching approximately $159.9 million. Chairman Heath Tarbert sold 39,240 shares in June at an average price of $81.47. Morgan Stanley downgraded the stock to "Underweight" in early August, sharply lowering its target price from $106 to $38. Other institutions are also revising their USDC circulating supply estimates downwards, warning that competition (especially Open USD - OUSD) could squeeze Circle's revenue margins. The current price level is above the 52-week low of $49.90, but well below the peak of $159.47.
For Gate users, Circle's performance signals a period of accelerating integration between stablecoin issuers and traditional financial institutions. The Arc mainnet launch and the participation of giants like BlackRock and DTCC are solidifying the process of stablecoins becoming part of the institutional financial infrastructure. In the coming period, transaction volume on the network after the Arc launch, new integrations, and whether USDC's circulating supply reaches its targeted $150 billion will be decisive for Circle's valuation. Furthermore, whether intra-institutional sales continue and how the market prices the lowered target prices set by institutions like Morgan Stanley should also be closely watched.
NFA ✔️ DYOR 🔎
  • Reward
  • Comment
  • Repost
  • Share
$PURR Hyperliquid Strategies Stock Jumps 30%: Trump and CFTC Behind It
Hyperliquid Strategies (PURR) shares surged 30.4% to close at $9.39 on the Nasdaq during the regular trading session. Intraday trading volume exceeded 58 million, approximately five times the average daily volume. In after-hours trading, the stock rose as high as $9.90.
This sharp rise has one cause. President Trump, in a press conference with technology executives and federal agency heads on Wednesday, announced that CFTC Chairman Michael Selig is working to bring the Hyperliquid platform to the U.S. "fully compliant and
M谋ngYueZen
$PURR Hyperliquid Strategies Stock Jumps 30%: Trump and CFTC Behind It
Hyperliquid Strategies (PURR) shares surged 30.4% to close at $9.39 on the Nasdaq during the regular trading session. Intraday trading volume exceeded 58 million, approximately five times the average daily volume. In after-hours trading, the stock rose as high as $9.90.
This sharp rise has one cause. President Trump, in a press conference with technology executives and federal agency heads on Wednesday, announced that CFTC Chairman Michael Selig is working to bring the Hyperliquid platform to the U.S. "fully compliant and legal." Trump also urged lawmakers to pass the CLARITY Act, which would bring comprehensive regulation to the crypto sector.
Hyperliquid is a blockchain platform built on perpetual futures contracts (perp) that allows users to bet on price movements without directly holding the asset. The CFTC had previously greenlit Bitcoin perpetual futures on US platforms, but a clear regulatory framework was lacking for decentralized platforms like Hyperliquid to operate in the US. Selig stated in June that he wanted to "create a way to bring these kinds of on-chain markets to the US and make them subject to some kind of regulation."
Market reaction wasn't limited to PURR alone. Hyperliquid's native token, HYPE, surged 17% following Trump's remarks. Hyperliquid-linked ETFs (21Shares, Bitwise, Grayscale) also gained approximately 20% in the same session. Coinbase announced on the same day that it was directing Base App users to Hyperliquid's perpetual futures markets.
Looking at company fundamentals, Hyperliquid Strategies reported a net profit of $125.6 million in the third quarter of 2026, a sharp turnaround from a loss of $277.5 million in the second quarter. Four analyst firms set an average target price of $13.79 for the stock, representing approximately a 47% potential upside from current levels.
For Gate users, this development is a significant case study in observing the impact of reduced regulatory uncertainty in the US on the crypto ecosystem. Hyperliquid's compliance with the CFTC could set a precedent for similar platforms and accelerate institutional capital's entry into on-chain derivatives markets. The progress of the CLARITY Act and concrete regulatory steps by the CFTC in the coming period will be key factors in determining the sustainability of this rally.
DYOR 🔎 NFA ✔️
#GateStockInsightsChallenge
  • Reward
  • Comment
  • Repost
  • Share
$MRNA #GateStockInsightsChallenge
Moderna's mRNA Cancer Vaccine Achieves Historic Success
Moderna and Merck's personalized mRNA cancer vaccine, intismeran, has achieved success in Phase 3 clinical trials. This marks a first for an mRNA cancer vaccine to yield positive results in a large-scale late-stage trial.
The companies announced Wednesday that intismeran, in combination with Merck's immune checkpoint inhibitor Keytruda, significantly slowed cancer recurrence and spread to other parts of the body in patients with high-risk melanoma (skin cancer). The Phase 3 INTerpath-001 trial involved
MRNA8.77%
M谋ngYueZen
$MRNA #GateStockInsightsChallenge
Moderna's mRNA Cancer Vaccine Achieves Historic Success
Moderna and Merck's personalized mRNA cancer vaccine, intismeran, has achieved success in Phase 3 clinical trials. This marks a first for an mRNA cancer vaccine to yield positive results in a large-scale late-stage trial.
The companies announced Wednesday that intismeran, in combination with Merck's immune checkpoint inhibitor Keytruda, significantly slowed cancer recurrence and spread to other parts of the body in patients with high-risk melanoma (skin cancer). The Phase 3 INTerpath-001 trial involved 1,137 patients who had undergone surgical removal of tumors. Two-thirds of participants received the combination of intismeran and Keytruda, while one-third received Keytruda alone. The results showed statistically significant and clinically relevant improvements in recurrence-free survival (the primary goal of the trial) and distant metastasis-free survival (the secondary goal) compared to Keytruda. Previous Phase 2 data had shown the combination reduced the risk of relapse or death by 49%, and the risk of distant metastasis by 59%.
This success was met with a sharp rise in the stock market. Moderna shares gained 177% in the regular trading session, closing at $174.88 and reaching a market capitalization of $69.81 billion. In after-hours trading, shares rose another 6%, reaching around $185. Merck shares also gained approximately 12.6%.
Leerink Partners analyst Daina Graybosch predicts that intismera could become a blockchain drug with average revenue of $1.4 billion by 2032, while Barclays forecasts sales could reach $3 billion by 2035. Other analysts suggest that annual sales in melanoma alone could exceed $6 billion, and that this figure could rise much higher if the same approach works for lung, kidney, and bladder cancers. William Blair analysts stated that this success is critical for Moderna's revenue diversification from COVID-19 vaccines and justifies the "Outperform" rating given to the stock.
The treatment is tailored specifically to each patient's tumor. A tumor sample is analyzed to identify patient-specific neoantigens (proteins resulting from tumor mutations). Intismeran contains mRNA instructions for the body to produce these neoantigens. Injected within a lipid nanoparticle, the mRNA enables cells to produce these proteins, training and activating the immune system against the patient's tumor.
Modernaa CEO Stéphane Bancel stated, "These Phase 3 findings are a milestone for the field of cancer research," emphasizing that personalized mRNA therapy, long dreamed of, has now become a reality. The study's lead researcher, Professor Georgina Long, described the results as "a turning point in melanoma treatment."
The companies plan to present the full data at an upcoming medical conference and then apply for regulatory approval. The treatment could be commercially available next year, and work is ongoing to adapt it for lung, bladder, kidney, and pancreatic cancers.
For Gate users, this development is a striking example of the volatility that scientific advancements in the biotechnology sector create in financial markets. This jump in Moderna's stock price highlights the potential that catalyst events, such as clinical trial results, create in high-risk, high-yield biotechnology stocks. Since such developments can affect not only the stocks involved but also overall market sentiment and risk appetite, it is beneficial for those trading through Gate to closely monitor such macroeconomic and sectoral developments.
DYOR 🔎 NFA ✔️
  • Reward
  • Comment
  • Repost
  • Share
$XAUUSD #CFD #Metals
Gold Rises Above $4,500: What Are the Markets Trying to Understand?
Gold prices surpassed the $4,500 level on August 19th, reaching a two-month high. The price of gold per ounce rose as high as $4,557 during the day before stabilizing around $4,522, with a daily increase of 4.35%.
The direct trigger for the rise was the US Treasury Department's decision to expand its long-term bond repurchase program. The department announced it would increase the maximum repurchase amount for 10-20 year and 20-30 year bonds from $2 billion per transaction to a minimum of $4 billion. Thi
XAUUSD1.86%
WhyFay
$XAUUSD #CFD #Metals
Gold Rises Above $4,500: What Are the Markets Trying to Understand?
Gold prices surpassed the $4,500 level on August 19th, reaching a two-month high. The price of gold per ounce rose as high as $4,557 during the day before stabilizing around $4,522, with a daily increase of 4.35%.
The direct trigger for the rise was the US Treasury Department's decision to expand its long-term bond repurchase program. The department announced it would increase the maximum repurchase amount for 10-20 year and 20-30 year bonds from $2 billion per transaction to a minimum of $4 billion. This move surprised the markets.
The market reaction was swift and clear. The 30-year bond yield, which had reached its highest level in 19 years, fell by approximately 9 basis points to 5.19% after the announcement. The dollar index also lost approximately 0.8% in value. As a non-interest-bearing asset, gold directly benefits from falling bond yields, and the weakening dollar makes its price per ounce more accessible compared to other currencies, forming the fundamental mechanism behind this rise.
TD Securities strategists described the Treasury's move as a "lifeline for metals," while Ole Hansen, Head of Commodity Strategy at Saxo Bank, stated that the combination of falling yields and a weakening dollar has created new momentum for gold. The Treasury's action is seen as an intervention to alleviate the financial tightening created by long-term interest rates reaching their highest levels since 2007.
However, there are questions about the sustainability of this move. On the one hand, central bank demand for gold remains a strong fundamental factor. According to World Gold Council data, central banks purchased 289 tons of gold in the first half of 2026, while 89% of survey participants predicted an increase in global reserves next year.
On the other hand, the Federal Reserve's July 28 meeting minutes revealed that inflation concerns persist and many officials are prepared for interest rate hikes. This suggests that despite the decline in long-term interest rates, short-term rates may remain under upward pressure. Furthermore, while this Treasury intervention risks creating expectations of further "market intervention" and fueling inflation, increasing gold's appeal as a store of value, it could also push the central bank towards a more hawkish stance.
Technically, the $4,500 level is a critical threshold just below gold's 200-day moving average ($4,510). A daily close above this level could be interpreted as a bullish signal for technical investors. While UBS's $5,000 target remains on the table, the impact of the Treasury's expanded repurchase operations, beginning on September 9, on market liquidity and bond yields will be critical in determining gold's direction. For Gate users, gold's sensitivity to both traditional financial conditions and central bank policy responses could serve as an early warning system for cryptocurrency markets in the coming period.
DYOR 🔎 NFA ✔️
#GateStockInsightsChallenge #
  • Reward
  • Comment
  • Repost
  • Share
$BTC Bitcoin retested the $69,000 level on August 19th with a surge exceeding 6.4%. The price reached as high as $69,622 during the day before slightly pulling back and stabilizing around $68,600. This move triggered a significant wave of liquidations, particularly for short positions, with total liquidated positions exceeding $1.46 billion in the last 24 hours. Approximately $1.3 billion of this was short positions held by investors anticipating a price decline.
There are multiple factors behind the rise. Most notably, the US Treasury Department's decision to expand its long-term bond repurc
BTC6.34%
SinCity
$BTC Bitcoin retested the $69,000 level on August 19th with a surge exceeding 6.4%. The price reached as high as $69,622 during the day before slightly pulling back and stabilizing around $68,600. This move triggered a significant wave of liquidations, particularly for short positions, with total liquidated positions exceeding $1.46 billion in the last 24 hours. Approximately $1.3 billion of this was short positions held by investors anticipating a price decline.
There are multiple factors behind the rise. Most notably, the US Treasury Department's decision to expand its long-term bond repurchase program. Increasing the maximum repurchase amount for 10-20 year and 20-30 year bonds from $2 billion per transaction to a minimum of $4 billion led to a decrease in long-term interest rates, supporting demand for risk assets. Standard Chartered strategist Geoff Kendrick described this policy move as "exactly the kind of development Bitcoin loves," noting that sustained levels above $65,500 could signal that the cyclical bottom is behind us.
In addition, two-day inflows into US spot Bitcoin ETFs reached approximately $487 million. A meeting at the White House on cryptocurrency regulations and the possibility of the CLARITY Act being revisited in September were also factors supporting investor sentiment.
Technically, $69,000 is a critical resistance zone where the 200-day moving average ($69,100) and the 21-week moving average ($68,800) intersect. This level is also described as a "bull-bear turning point" by Bloomberg Intelligence strategist Mike McGlone. However, every bullish scenario has a counter-argument. McGlone noted that Bitcoin failed to hold above $69,000 despite record highs for the Nasdaq and S&P 500, citing slowing ETF inflows and signs of a bursting speculative bubble, warning that the price could fall to $10,000 in the medium term. According to this view, the current rally is based on temporary liquidity support and is unsustainable without sustained spot demand.
For Gate users, the $69,000 level is currently a test. A daily close above this region would indicate that the previously resistance level could turn into support, and the rally could continue. However, a failure to maintain this level and a pullback are also possible. The Fed meeting minutes, to be released in the next 24 hours, will play a critical role in determining the market's direction. Therefore, monitoring not only price movement but also the trajectory of the US 10-year Treasury yield and the trend in ETF flows would be a healthier approach to understanding whether this rally is sustainable.
DYOR 🔎 NFA ✔️
#BTC升破69000美元日内涨幅6.43% #BTCBreaches69000Up6.43% #GateStockInsightsChallenge
  • Reward
  • Comment
  • Repost
  • Share
$UNITREE (宇树科技) shares made a strong market debut on the Shanghai Stock Exchange's STAR Market on August 19, gaining over 600% on the day they began trading. The initial public offering price was set at 150.8 yuan, while the opening price on the first day of trading reached 1,100 yuan. This surge brought the company's market capitalization to approximately 61 billion yuan.
Unitree's IPO, the first humanoid robot manufacturer in mainland China, highlights the level of investor interest in the sector. The company's revenue is projected to reach approximately 1.7 billion yuan by 2025, with a c
UNITREE8.33%
SinCity
$UNITREE (宇树科技) shares made a strong market debut on the Shanghai Stock Exchange's STAR Market on August 19, gaining over 600% on the day they began trading. The initial public offering price was set at 150.8 yuan, while the opening price on the first day of trading reached 1,100 yuan. This surge brought the company's market capitalization to approximately 61 billion yuan.
Unitree's IPO, the first humanoid robot manufacturer in mainland China, highlights the level of investor interest in the sector. The company's revenue is projected to reach approximately 1.7 billion yuan by 2025, with a compound annual growth rate of 226.78% since 2023. With over 5,500 humanoid robot shipments last year, Unitree is a global leader and one of the few profitable companies in the sector.
Technical indicators show the stock price fluctuating between 93.35 and 155.5 during the day. The current level is around 126.1, indicating that it is still significantly above its IPO price. However, analysts note that robots are not yet precise and robust enough for widespread commercial use, with much of the current demand concentrated in research and development. The company's own prospectus also includes a warning that commercial scaling may proceed slower than expected.
On the Gate side, the UNITREEUSDT contract transitioned from pre-market trading to a formal perpetual contract, offering leverage support of 1-50x. This transition coincided with the stock's official launch on the exchange. Gate also launched a contract trading competition with a total prize pool of 50,000 USDT, effective August 19th.
This market entry by Unitree has generated both optimistic and cautious interpretations regarding the future of humanoid robot technology. While the sector's long-term growth potential appears strong, it will take time for the technology to mature and for its cost-effectiveness to be tested. For Gate users, this presents an opportunity to both track such new token pairs and closely monitor developments in the sector. Since contract trading involves high risk, it is important to take positions considering market conditions and company fundamentals.
DYOR 🔎 NFA ✔️
#UnitreeTechSoars629%OnDebuts #我的七夕交易分享
#MyQixiTradingShare
  • Reward
  • Comment
  • Repost
  • Share
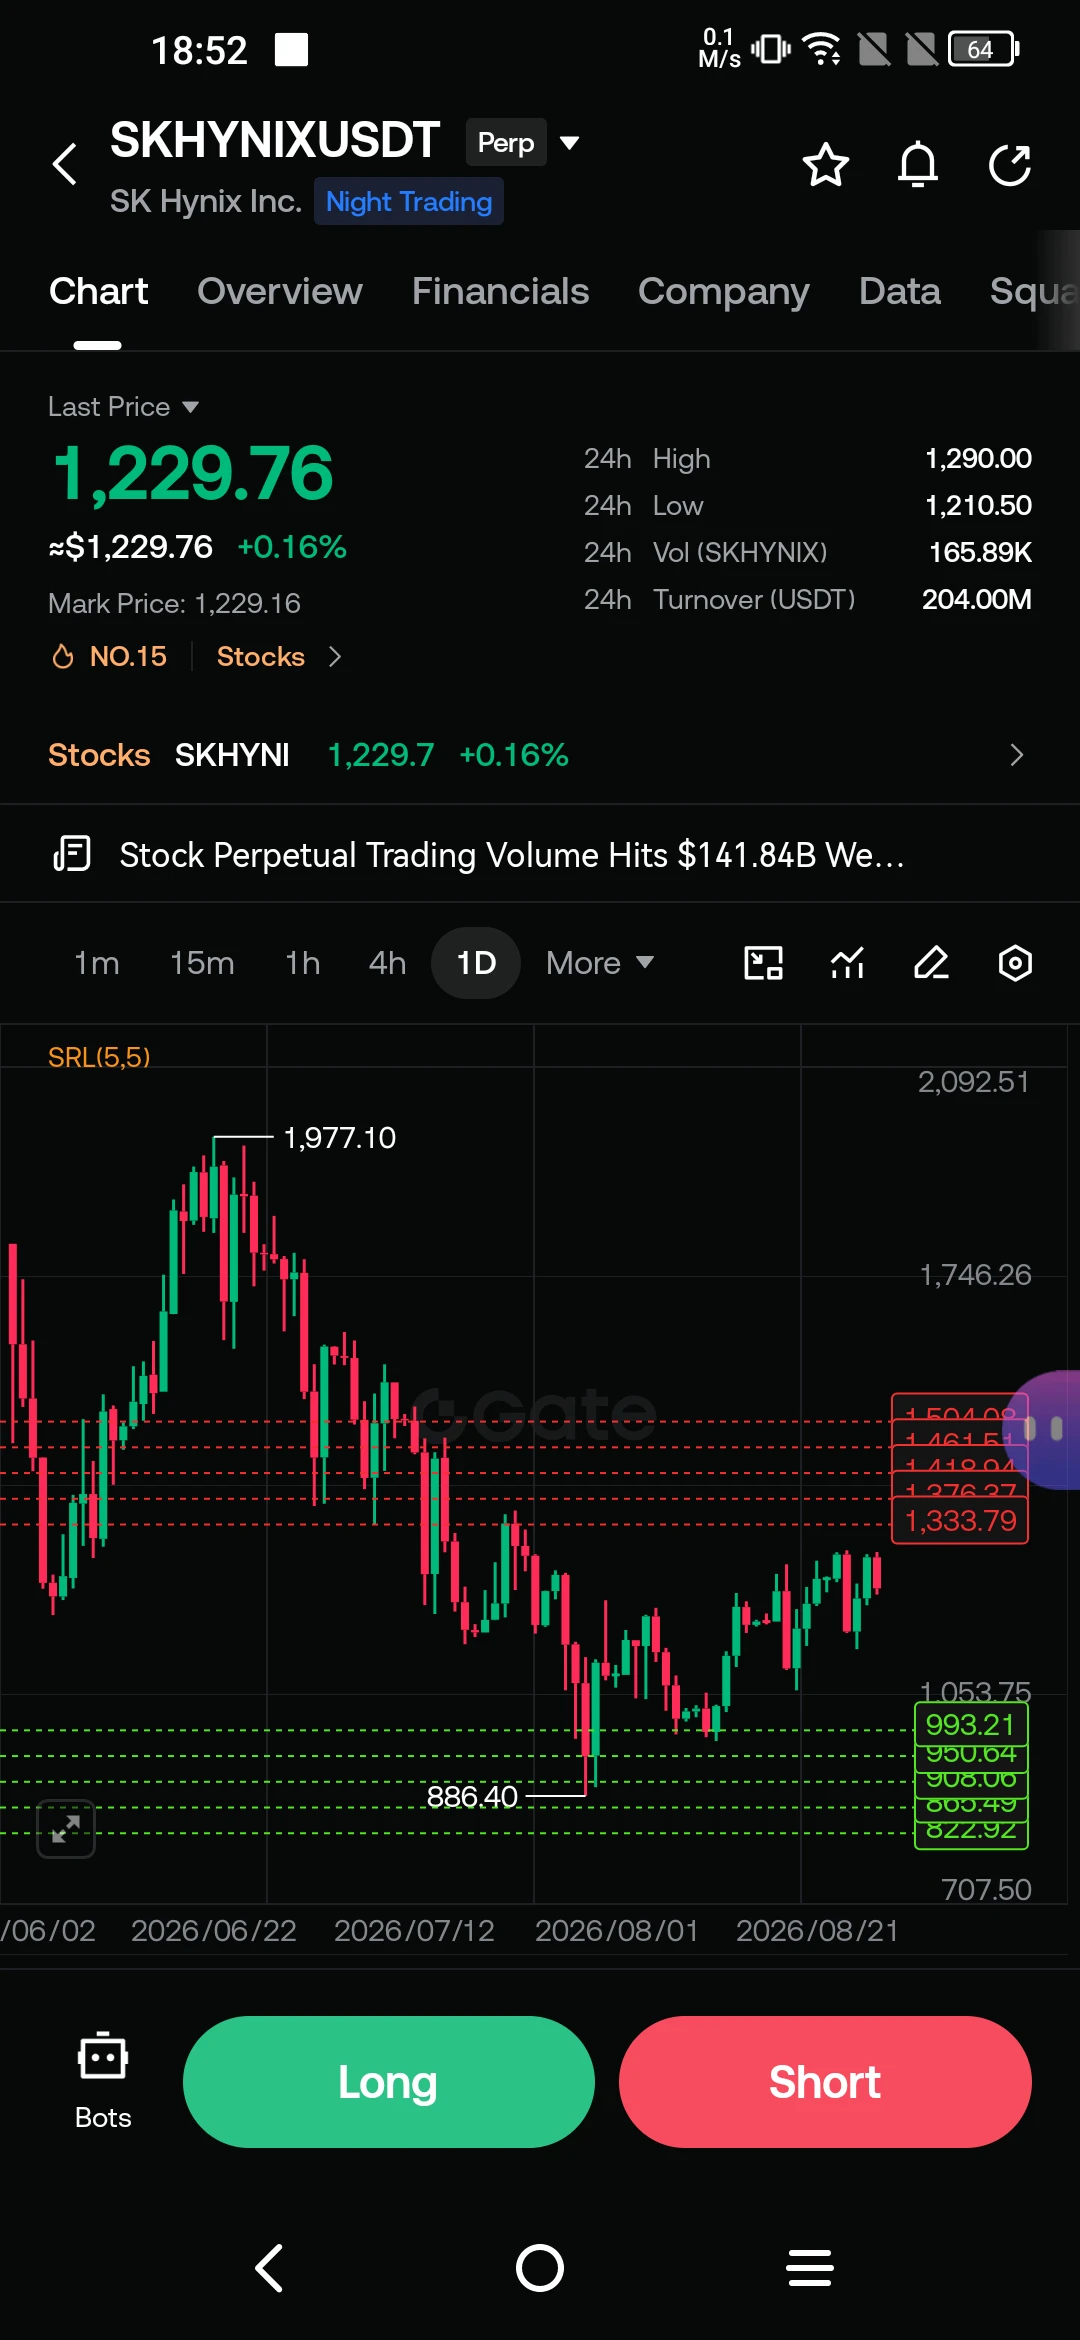
#KOSPITumblesOver6%TriggersTradingHalt
The KOSPI index opened 5% lower on Wednesday, then within minutes extended its losses to over 6%, marking one of its sharpest daily declines of the year. This triggered the Sidecar mechanism, activated by the Korean Stock Exchange following a 5% drop in the KOSPI 200 futures index. The mechanism halted scheduled sell orders for 5 minutes.
Semiconductor stocks bore the brunt of the decline. SK Hynix lost over 9% at the open, while Samsung Electronics fell more than 7%. This highlights the fragility of the AI and memory investment cycle, to which South Kor
SinCity
#KOSPITumblesOver6%TriggersTradingHalt
The KOSPI index opened 5% lower on Wednesday, then within minutes extended its losses to over 6%, marking one of its sharpest daily declines of the year. This triggered the Sidecar mechanism, activated by the Korean Stock Exchange following a 5% drop in the KOSPI 200 futures index. The mechanism halted scheduled sell orders for 5 minutes.
Semiconductor stocks bore the brunt of the decline. SK Hynix lost over 9% at the open, while Samsung Electronics fell more than 7%. This highlights the fragility of the AI and memory investment cycle, to which South Korean markets are highly exposed.
The sell-off wasn't limited to Korea. In Japan, the Nikkei index fell more than 2%, while memory maker Kioxia lost over 10%. Taiwan Semiconductors also similarly diverged negatively. This simultaneous movement is being interpreted as a reflection of the 5.6% drop seen in the Philadelphia Semiconductor Index (SOX) the previous day, mirroring the decline in Asian markets.
There are three main factors behind this market collapse. First, the US 30-year Treasury yield has risen to 5.33%, its highest level since 2007. Rising borrowing costs are directly putting pressure on highly valued technology stocks, which are priced in future profit expectations. Second, geopolitical tensions related to Iran are driving up oil prices, reigniting inflation concerns. Third, there are growing doubts about whether the massive spending by Big Tech companies on AI infrastructure will yield returns.
These developments occurred during a period of extreme volatility, with the KOSPI falling from a peak of 9,300 in June to a low of 5,200 at the end of July, before recovering to around 6,900 in August. With this latest decline, the index has once again fallen to the 6,500 level. This situation indicates that the market is still searching for a new equilibrium and that broader participation is necessary for the sustainability of the upward movement.
Morgan Stanley strategists suggest the index could move between 5,500 and 10,500, while maintaining their 9,000 target for June 2027. NH Investment & Securities expects volatility to decrease until the October earnings season and a gradual recovery towards the 10,000 level. The Jackson Hole meeting and the Fed's interest rate decisions will be critical in determining the market's direction in the coming period. For Gate users, this necessitates closely monitoring the impact of turmoil in traditional markets on crypto assets, particularly US bond yields and geopolitical developments.
DYOR 🔎 NFA ✔️
#KOSPITumblesOver6%TriggersTradingHalt #我的七夕交易分享
#MyQixiTradingShare
  • Reward
  • Comment
  • Repost
  • Share
$INTC INTEL Corporation shares, traded on the Nasdaq under the ticker symbol INTC, fell by 6.57% in the last trading session to $96.68. Intraday volatility was adjustable, with a low of $95.25 and a high of $99.31. This sharp decline raises questions about the short-term outlook for the stock.
The key factors behind this price movement are noteworthy: despite reporting a net profit of $0.42 per share, the company recently reported a net loss of approximately $11.03 billion. This suggests that the difference between performance and cash outflow is being priced in for inflation. Furthermore, t
INTC-2.25%
Yuewen
$INTC INTEL Corporation shares, traded on the Nasdaq under the ticker symbol INTC, fell by 6.57% in the last trading session to $96.68. Intraday volatility was adjustable, with a low of $95.25 and a high of $99.31. This sharp decline raises questions about the short-term outlook for the stock.
The key factors behind this price movement are noteworthy: despite reporting a net profit of $0.42 per share, the company recently reported a net loss of approximately $11.03 billion. This suggests that the difference between performance and cash outflow is being priced in for inflation. Furthermore, the fact that the company, currently valued at $507.90 billion, remains a significant player in the sector highlights ongoing concerns about profitability.
Technical indicators suggest that the first critical support level, potentially reaching $95-96, is emerging. If this level continues on a daily basis, increases may occur in the 90-92 and 85 dollar regions, respectively. The 22-point decline in the RSI(6) indicates short-term oversold periods, increasing the likelihood of a technical rebound. If a rebound occurs, the 102-105 dollar region should be monitored as a significant resistance point; caution is advised in the overall outlook unless this region is reclaimed.
In conclusion, while offering some potential recovery in short-term oversold conditions, the main trend will likely continue to test and overcome the 102-105 dollar resistance. If sustained above this level is not achieved, a renewed sell-off is possible. Changes in the risk market and sector-specific developments will continue to be the main focus for INTC.
DYOR 🔎 NFA ✔️
#我的七夕交易分享
#MyQixiTradingShare
  • Reward
  • Comment
  • Repost
  • Share
#SpaceXSuperInvestorsRevealedStockRallies40%
🔥 SPACE X IS TURNING INTO A GLOBAL CAPITAL MAGNET — AND WALL STREET IS PAYING ATTENTION
SpaceX is no longer being valued simply as Elon Musk’s rocket company. The bigger story is becoming much more powerful: institutional capital, Starlink, AI infrastructure, semiconductors, satellite connectivity and next-generation space technology are converging inside one ecosystem. 🌍🚀
Recent regulatory disclosures have revealed just how deep major institutions are positioned.
🏦 The Super-Investor Lineup
Alphabet reportedly holds around 551 million SpaceX s
CryptoChampion
#SpaceXSuperInvestorsRevealedStockRallies40%
🔥 SPACE X IS TURNING INTO A GLOBAL CAPITAL MAGNET — AND WALL STREET IS PAYING ATTENTION
SpaceX is no longer being valued simply as Elon Musk’s rocket company. The bigger story is becoming much more powerful: institutional capital, Starlink, AI infrastructure, semiconductors, satellite connectivity and next-generation space technology are converging inside one ecosystem. 🌍🚀
Recent regulatory disclosures have revealed just how deep major institutions are positioned.
🏦 The Super-Investor Lineup
Alphabet reportedly holds around 551 million SpaceX shares, while Nvidia owns nearly 123 million shares.
Other major investors include:
🔹 Fidelity
🔹 BlackRock
🔹 Baillie Gifford
🔹 Ontario Teachers’ Pension Plan
🔹 Gigafund
🔹 Saudi Arabia’s Public Investment Fund
This is an extraordinary collection of global capital. Their involvement signals that SpaceX has become strategically important far beyond the traditional aerospace sector. 💰🌌
📈 The 40% Rally
SpaceX shares reportedly fell below $105 earlier in August, but the stock then staged a powerful recovery.
Recent reports estimate the August gain at roughly 35%, while the rebound from the early-August lows has approached 40%.
But here is what makes the move particularly interesting:
📅 Around 912 million shares were released earlier in August.
📅 Another approximately 319 million shares are scheduled to become tradable on August 20.
Normally, such a large increase in available supply could create significant selling pressure.
Instead, SpaceX has continued attracting buyers. 🚀📊
That suggests investors may be looking beyond near-term dilution and focusing increasingly on the company’s long-term growth potential.
🌐 Alphabet’s $900M Investment Becomes Massive
Alphabet’s SpaceX investment is one of the most remarkable examples of long-term technology investing.
Alphabet invested approximately $900 million in 2015. By June 2026, that position was reportedly worth around $94.2 billion.
That represents an extraordinary transformation in value. 🤯
The relationship also makes strategic sense.
Cloud computing, AI, satellite connectivity and advanced infrastructure are becoming increasingly interconnected — areas where Alphabet already has enormous technological capabilities.
🤖 Nvidia’s SpaceX Connection
Nvidia’s reported ownership of nearly 123 million SpaceX shares, worth roughly $21 billion based on June figures, adds another fascinating dimension.
SpaceX is investing heavily in AI infrastructure and computing capacity, while Nvidia supplies the GPUs and accelerated-computing technology powering the AI revolution.
The relationship between space + AI + computing could become one of the most important technology themes of the next decade. ⚡
🛰️ Starlink Changes the Equation
SpaceX is much more than rockets.
Starlink is expanding satellite internet connectivity globally, while SpaceX continues developing next-generation launch systems and massive AI infrastructure.
The company reportedly generated approximately $7.8 billion in Q2 revenue, exceeding expectations, although it also recorded a net loss of around $541 million.
That creates a major investor debate:
💡 Is SpaceX spending too aggressively today?
Or…
🚀 Is it building infrastructure for a much larger future business?
⚠️ But Risks Cannot Be Ignored
The rally does not eliminate the risks.
Massive capital requirements, an ambitious valuation, heavy AI spending and billions of shares becoming tradable could all increase volatility.
Early investors sitting on enormous gains may decide to sell when lock-up restrictions expire.
So the next major test could be whether new supply is absorbed by strong institutional demand.
🔥 The Bigger Picture
SpaceX is evolving into something much larger than a private aerospace company.
It sits at the intersection of:
🚀 Space exploration
🛰️ Satellite internet
🤖 Artificial intelligence
💻 Advanced computing
⚡ Semiconductors
🌍 Global infrastructure
💰 Institutional capital
If demand continues absorbing newly tradable shares, the current rally could represent growing confidence in SpaceX’s long-term vision.
But if selling accelerates, volatility could return quickly.
Either way, one thing is becoming clear:
SpaceX is no longer just a rocket story. It is becoming one of the world’s biggest technology, infrastructure and capital-market stories. 🚀🌌📈
#股票交易分享挑战 @Gate_Square #SpaceX #GateSquare #MyQixiTradingShare
repost-content-media
  • Reward
  • Comment
  • Repost
  • Share
$FLNCG (Fluence Energy) – Breaking Bad News, Staying Out
I'm staying far away from FLNCG because it is down -4.45% at $12.695, but the key factor is the headline: **"Fluence Energy Stock Crashes 22% Overnight."** The moving averages have rolled over sharply with EMA5 at $12.737, EMA10 at $12.885, and EMA30 at $13.105, all sloped down. The 24h low is $12.565, and MACD is plunging deeply negative. This is a classic overnight gap-and-crash scenario. I'm not touching this until the bad news is fully priced in and a bottom forms. For now, I'm completely out.
FLNC-0.52%
Cryptoluter
$FLNCG (Fluence Energy) – Breaking Bad News, Staying Out
I'm staying far away from FLNCG because it is down -4.45% at $12.695, but the key factor is the headline: **"Fluence Energy Stock Crashes 22% Overnight."** The moving averages have rolled over sharply with EMA5 at $12.737, EMA10 at $12.885, and EMA30 at $13.105, all sloped down. The 24h low is $12.565, and MACD is plunging deeply negative. This is a classic overnight gap-and-crash scenario. I'm not touching this until the bad news is fully priced in and a bottom forms. For now, I'm completely out.
repost-content-media
  • Reward
  • Comment
  • Repost
  • Share
  • Pinned