




Square
Following
Hot
News
Notifications
Profile
Share your thoughts
placeholder
Article
The cempedak stall is open, but they haven’t started frying it yet.
post-image
Featured“Bitcoin’s Risk Has Not Been Eliminated; Watch Short-Term Liquidity. Is Storage Forming a Short-Term Bottom?”

Bitcoin recovered after yesterday’s decline, but has not moved out of the hourly converging range. In the short term today, watch the hourly equal highs at 75500 and whether liquidity at the top of the weekend consolidation range gets swept. If price moves up, watch for a pullback around 77200-77500. If ETH is not particularly strong, first watch whether 2190 pulls back.

On Bitcoin’s daily chart, yesterday’s price action did not change much. If it closes another bearish candle today,
BTC-0.67%
ETH-1.26%
SNDK+6.27%
Trenches
牛逼
牛
bade
b
牛逼
0x96...7777
Market Cap
$.
Change
.
24h Vol
$.
Holders
.
PIEVERSE
P
bade
b
PIEVERSE
0x0e...25a9
Market Cap
$.
Change
.
24h Vol
$.
Holders
.
STONK
S
bade
b
STONK
6GmA...UNgx
Market Cap
$.
Change
.
24h Vol
$.
Holders
.
ON
O
bade
b
ON
0x0e...1d48
Market Cap
$.
Change
.
24h Vol
$.
Holders
.
FLOAT
F
bade
b
FLOAT
Bv1a...BMmr
Market Cap
$.
Change
.
24h Vol
$.
Holders
.
The probability of a rate hike is 82.2%, and the hawkish signal is now in—yet prices haven’t fully dropped. That’s an arbitrage window. The MA20 is pressing down on the MA50, while the MA200 is still well above them. Whale addresses have been distributing. Don’t rush to buy the dip; wait for the moving averages to flatten out. What do you think?
post-image
I’ll be livestreaming at 9:30 tonight. I should be able to cover everything in about an hour.

I’ve been watching short dramas lately. *Armed Entry into the Song Dynasty* has racked up 12 billion views worldwide. It was made by more than 30 ordinary people from Xinxiang, Henan, including stay-at-home moms and taxi drivers.

I was curious what kind of drama was so popular. There are ten seasons in total, and I’ve watched four. I really have to admire it: the content is historically accurate, packed with references and deeply rooted in Chinese culture. Even I’m struggling to keep up.

The barrie
post-image
Nasdaq surges 2.7%! Tech stocks make a comeback—or did Wall Street stage another fakeout?

This tech stock rebound came quite suddenly.
The market had been worried that investment in AI data centers might slow, and tech stocks faced concentrated selling. The Nasdaq even suffered a brutal decline. Then, on November 9, the Nasdaq shot up 2.7%, as if the panic of the previous few days had all been a collective dream.
So, have tech stocks really won back investors’ favor?
I think there are two signals worth watching in this rebound.
First, investors haven’t completely abandoned the tech sector. AI
NAS100-0.07%
MU+6.42%
SPYX+0.01%
  • 1
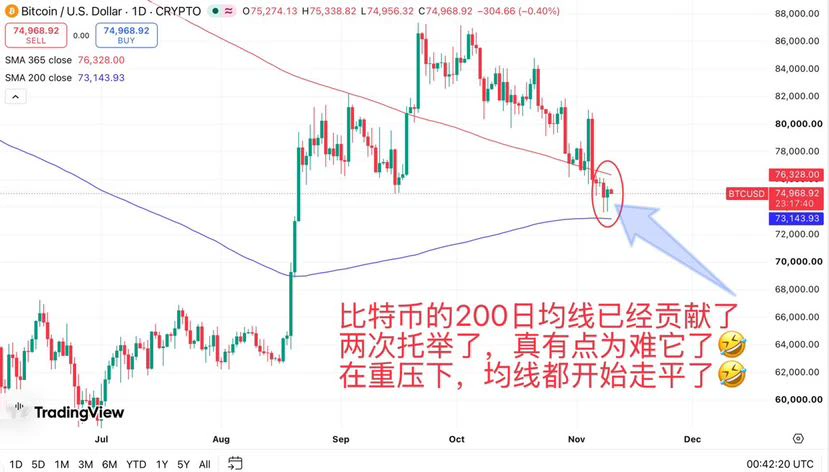
Bitcoin’s 200-day moving average has really been working hard lately! 🤣
$BTC ‌
It has already stepped in twice at critical moments to provide support, but BTC still let us down: after rebounding above $80k, it was slammed back to around $75k. The 200-day moving average is now around $73,144, while the 365-day moving average above it is around $76,328. With one average above and the other below, Bitcoin is caught in the middle, unable to move forward or back! 😂
#美国10月CPI即将公布
What worries me a bit more is that the 200-day moving average has started to flatten out, while the 365-day moving av
post-image
BTC-0.65%
Market sentiment is currently bearish (CMC Fear and Greed Index: 29/100). Key points:

Fear and Greed Index — a reading of 29 corresponds to “Fear.” It has not changed in the past 24 hours but has fallen from 35 last week, indicating that negative sentiment persists.
Diverging social media sentiment — a net score of 4.9/10 from CMC’s sentiment analysis algorithm indicates moderately bearish sentiment. Optimistic forecasts sharply contrast with warnings of a steep Bitcoin drop.
Market indicators call for caution — Bitcoin dominance rising to 60.35% and derivatives trading volume jumping 274% po
BTC-0.67%
#BTCFlashCrash THE 15-MINUTE LIQUIDATION ANOMALY: SYSTEMIC GRIND VS. THE ALGORITHMIC FLUSH
The digital asset ecosystem has just absorbed a high-velocity structural shock, altering the immediate trajectory of the macro crypto landscape. In a violent 15-minute window, Bitcoin ($BTC ) experienced a localized flash crash, slicing down to an absolute panic low of $73,510 before executing an immediate, aggressive V-shaped mean reversion.
The asset is currently trading at $74,898, pinned right against the upper boundary of its newly defined defensive cluster. This explosive price action was not driven
BTC-0.67%
  • 2
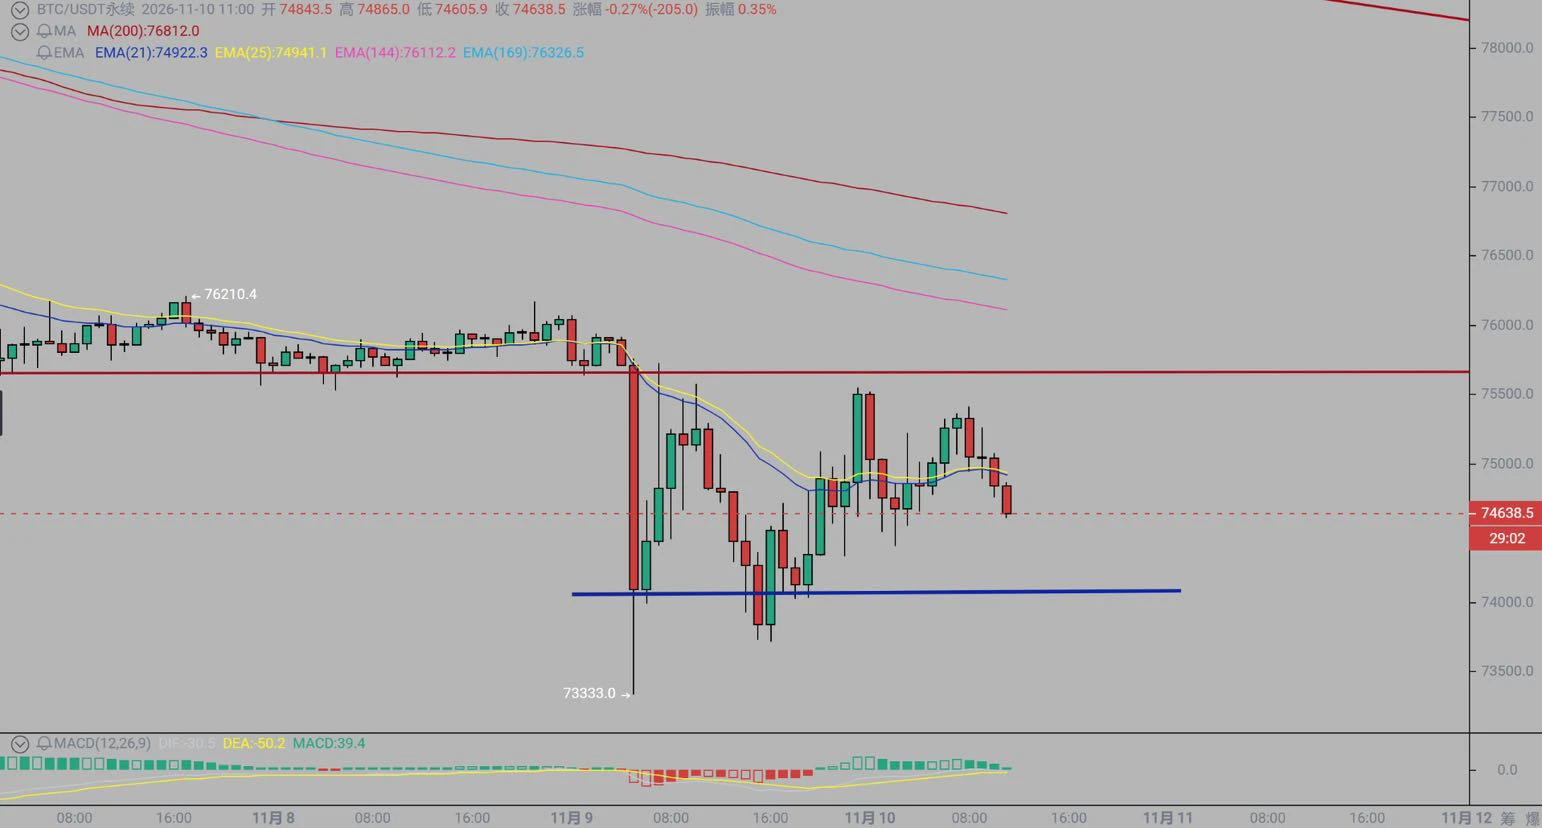
11.10🫓
BTC is ranging between 74000 and 75500 on the 1-hour timeframe. It is currently pulling back to test liquidity absorption around 73800–74300. This 1-hour support has been tested 3 times, with price recovering each time.

🚨Trading suggestions
Build a core long position at 73800–74300
Target: 75500; stop: 73400

Tonight’s CPI release is likely to be bearish. Crude oil prices remained high in October, adding inflationary pressure. Be disciplined with take-profits and stop-losses, and align your actions with your plan. If the market absorbs the bearish news before the open without breakin
post-image
FyPaymentMadeEasy
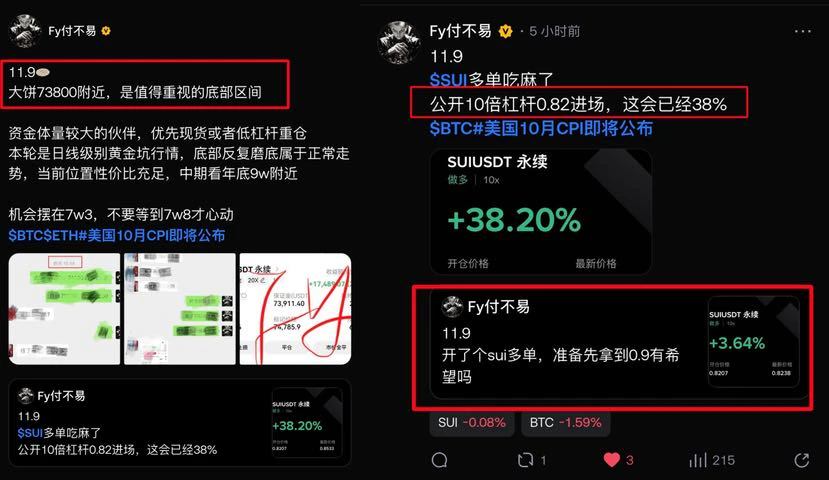
11.9
Today's Summary
$BTC Publicly called for a long entry on Bitcoin at 73800, chose not to exit at 75600, and will continue holding the swing position, targeting 78000

$SUI Likewise, publicly signaled a long position at the current price of 0.82. Opportunities are announced in real time; friends who keep up with the pace can capture the profits together

Choppy markets test your resolve the most. The mind is all there is; stick to your own trading system. When trading, you don't need to prove anything to anyone
repost-content-media
BTC-0.65%
ETH-1.23%
  • 1
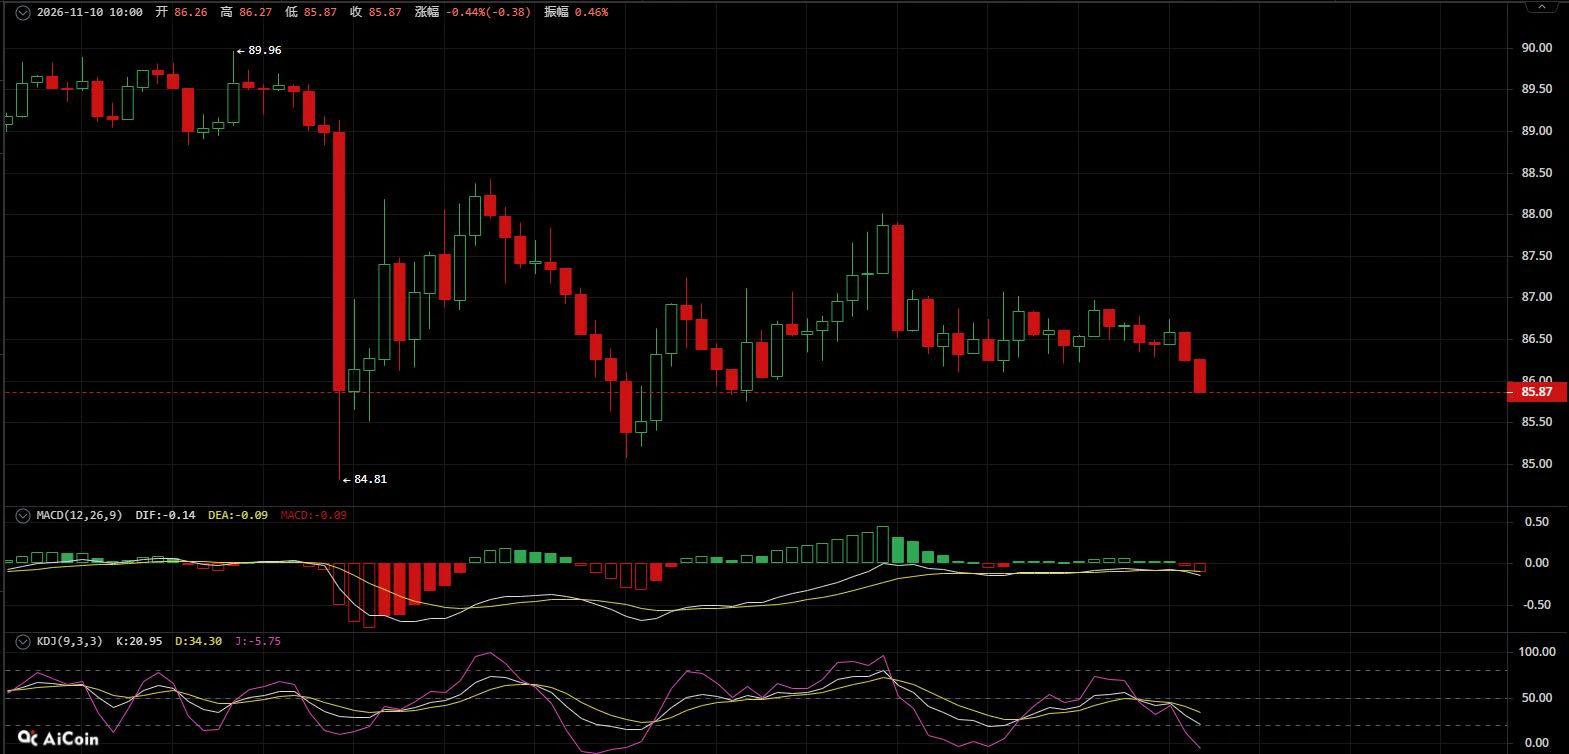
November 10 SOL's rebound momentum is gradually fading; favor trend-following shorts.
【Today's Plan】
Short entry zone: Position on a rebound to 87.0—87.5
Stop-loss: Above 88.3
Take-profit: Target 85.0—84.5

【Core Rationale】
After a high-volume drop to a low of 84.81 on the 30-minute chart, SOL entered a weak rebound, with the overall downtrend structure still intact. The MACD lines are below the zero line. After the red histogram bars continued to contract during the rebound, they turned green again, indicating that bullish momentum is gradually exhausted and bears have regained the upper han
post-image
SOL-0.77%
11.10 SOL Analysis

Analysis: Short near 87.2-88.0 on a rebound, with a stop at 88.6; first target 85.5, second target 84.7

On the 1H chart, the current price is 86.00. After plunging on heavy volume from a high of 89.98, the market dipped to a low of 84.66 before entering a low-level consolidation and recovery. Recent candlestick action shows rebounds near 87.8-88.0 being repeatedly rejected, with each rebound high lower than the last, indicating genuine selling pressure at that level. The yellow Supertrend resistance line is near 87.5, the cyan moving average is flattening near 86.8, and th
post-image
SOL-0.77%
Morning and BTC
live-cover
LIVE1,790
What Is Slippage? Why Might the Stop-Loss Price Differ from the Actual Execution Price?

In cryptocurrency trading, many people believe that setting a stop-loss will keep losses within a predetermined range. But in real markets, the stop-loss trigger price may differ from the final execution price. This difference is called slippage.

First, what is slippage?

Slippage is the difference between the expected execution price and the actual execution price. For a buy order, an actual execution price higher than expected may result in unfavorable slippage; for a sell order, an actual execution pri
The day your account doubles is when you’re most tempted to load up—that’s the most dangerous moment. Cathie Wood is once again calling Tesla “the biggest AI project on Earth.” The endgame narrative of $8–10 trillion in revenue sounds staggering, but she’s never focused on quarterly deliveries; she’s betting on where things will be ten years from now. If you believe in it, size your position carefully, and don’t get carried away at the highs. If you have anything to add, see you in the comments.
post-image
TSLA+5.53%
It’s almost 7 a.m. I was planning to get up early and slack off while taking a quick look at the charts and liquidation heatmap. Good grief, those bright yellow bands filling the screen woke me right up. This calm morning is full of landmines the market makers laid for us overnight!

$BTC is hovering around 75000, with price action thrashing wildly. Look closely at the heatmap: overhead, there’s a thick, glowing yellow line from 75500 to 76000, packed with fearless shorts. But look lower, and 73000 to 73500 is also a very thick line of defense for the longs. Once the morning session’s money c
BTC-0.65%
ETH-1.23%
SOL-0.74%
$XPL The short trade has been completed. After the 0.05250 support was decisively broken, selling pressure was confirmed. I entered a short in line with the trend, with momentum providing ideal support. This trade captured a 73% gain, booking $211.
Today I’ll be keeping a close eye on these two assets: $BTC and $INIT .
$XPL ’s upward momentum is clearly fading, and bearish sentiment is building. The price may be pushed back into the lower range, so my outlook remains bearish.
The trading plan is simple: entry range 0.05295 - 0.05321; first target 0.05050, second target 0.0484; stop-loss at 0
post-image
XPL-0.60%
BTC-0.67%
INIT-2.53%
AVAX’s 6.4% surge is just the beginning? The RWA sector is suddenly heating up, bringing new opportunities for Avalanche!

The term RWA has been gaining popularity in the crypto market lately.
RWA stands for the tokenization of real-world assets. Simply put, it means converting traditional financial assets such as stocks, bonds, and funds into on-chain assets using blockchain technology.
This time, Avalanche has come into the market spotlight for a new reason.
Ava Labs announced that a tokenized securities platform affiliated with the NYSE plans to use Avalanche as its core ledger technology f
SNDK+6.27%
  • 17
November 10 BTC/ETH Mi Shen Strategy

【Market News】
Important reminder: U.S. October CPI data will be released tonight at 21:30. Last Friday’s nonfarm payrolls came in well above expectations, but the market reaction was not significant. Instead, some events yesterday morning triggered a sharp market sell-off, followed by choppy sideways trading. The overnight session was similarly lackluster. The market is waiting for tonight’s CPI; this inflation data will largely set expectations for December rate hikes. As the overnight session approaches, the market may have a chance to break out of this
BTC-0.65%
Bitcoin surged and then pulled back, followed by a choppy decline. Recently, it has reached the weekly chart’s mid-band near the bottom. The key now is whether it breaks down below this level or finds a bottom, stabilizes, and rebounds.

The pre-market chart shows an overall choppy decline. I think the pullback is nearly over. I expect choppy consolidation and recovery in November, followed by a rally in December.

Given the current pullback momentum, I think the deeper the pullback, the stronger the rebound. So I’m bullish in the 74500-74000 area, with a target near 76500#美伊谈判出现新进展 $BTC
post-image
BTC-0.67%
Load More

Join 40 M users in our growing community

⚡️ Join 40 M users in the crypto craze discussion

💬 Engage with your favorite top creators

👍 See what interests you

Trending Topics

USCPIDataIncoming

48.32k Views2.17k Discussing

The U.S. October CPI report will be released on November 10 at 8:30 a.m. ET. September CPI came in at 3.7% year over year, and markets will be watching closely for signs that inflation is cooling, especially in core CPI. A softer-than-expected reading could strengthen rate-cut expectations, while hotter inflation may pressure risk assets through higher Treasury yields and a stronger dollar. How do you think this CPI print will move $BTC, U.S. stocks and gold?

USIranTalksShowNewProgress

5.03k Views1.23k Discussing

KoreanStocksJumpOver5%

569 Views4.81k Discussing

View More