Square
Following
Hot
News
Profile
Share your thoughts
placeholder
Article
BTC October 9 Market Analysis
1. The rise of wave 1 has most likely ended, and a wave 2 correction may come next. The larger bull-market cycle is not over, but major pullbacks can also occur within a bull market—even a correction to 72,000-75,000 is possible;
2. BTC in the 70,000s may have a chance to be seen again. In any case, it is now clear that key support has been breached. Consolidation is needed in the short term, and the probability of a direct V-shaped reversal is low. Personally, I believe the decline is not over yet, so do not go long for now; continue to focus on short positions d
post-image
BTC-0.71%
With the same one-day surge, why is $OGN ’s 85% more concerning—and more worth trading—than $RLC ’s 32%?
The answer lies in the structural differences in relative strength. $OGN is currently priced at 0.04242, with MA5=0.04421 having crossed above MA20=0.040797, confirming a bullish moving-average alignment. It is the only one of the three candidates whose price is above both moving averages and whose gain is the strongest. However, note that RSI=60.5 has not entered overbought territory, indicating that this rally has not yet been overextended; the real signal is the funding rate of -0.0217%,
post-image
OGN+89.76%
RLC+34.40%
Is this really a rebound? Isn't it CPR for my empty account? While $RLC looked limp during the intraday bottoming, funds were quietly entering. It was bottoming without breaking down, and I said one thing at the time: don't short, wait for the signal. The screen was so green it made people panic, but I instead wrote out my plan in even greater detail.
From 0.7663 to 0.8914, +161% is right there on the table. Feels good, brothers. The timing was spot-on, and all the waiting was worth it. This isn't hindsight commentary—the early alert is still fresh. Those who were on board know how relieving
post-image
RLC+33.07%
BNB-3.91%
XRP-1.80%
A few days ago, the hand that set the stop-loss trembled slightly; this morning, I realized that was unnecessary filial piety. A few days ago, I looked at $ZCAT before bed. The pullback held firm and buying pressure strengthened, so my long-entry idea was simple: hold as long as it doesn’t break; leave if it does.
The repeated intraday swings were the real test. Many people got shaken out, but I didn’t move because the structure was still intact, and so was the momentum. It was truly sluggish at first, but the breakout feels great.
Entered at 0.03917, reached 0.0485, and +242.24% in gains secu
post-image
ZCAT-4.65%
LAB-1.30%
BNB-3.91%
Starlink|BTC|October 9 Outlook
Direction: Attempt to go long, recovery on a rebound
Key position to watch: 81000–81500
Current price: Light-position attempt to go long.
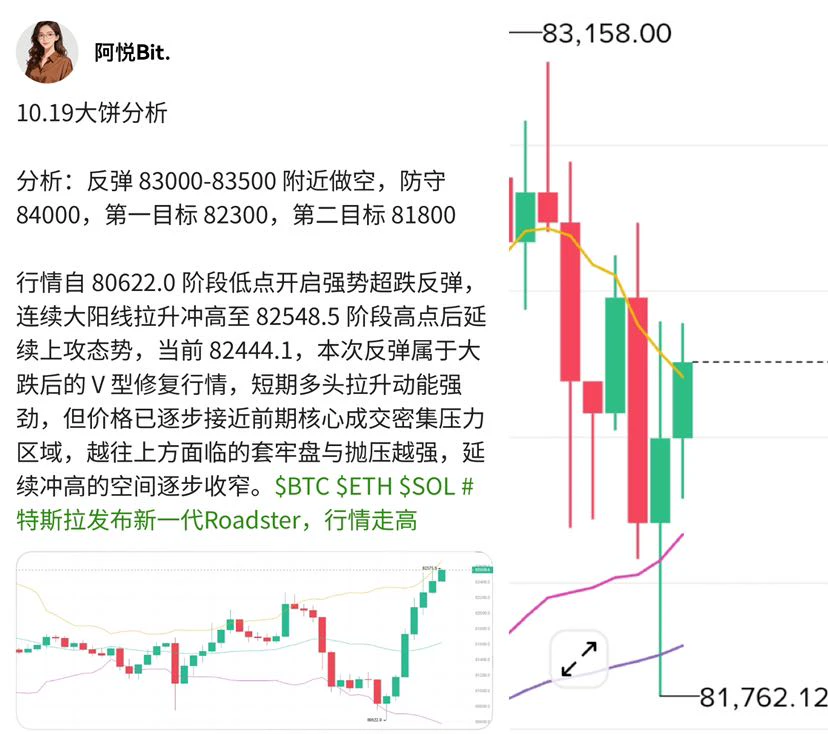
BTC fell all the way from around 86900, reaching a low of 80344, and has now seen a rebound, returning to around 81900.
After the consecutive decline, a rebound has finally begun. Next, first watch whether this recovery can continue, then see whether the market can gradually emerge from consolidation.
81000–81500 is the key area I am watching for entering long positions. At the current price, only a light-position long attempt
post-image
BTC-0.70%
ETH-3.00%
10.9 $BTC Morning Bitcoin outlook: Buy on pullbacks and look for a rebound recovery
Yesterday, Bitcoin mostly fluctuated repeatedly within the 83,000–82,000 range during the daytime session, with a clear tug-of-war between bulls and bears. After the jobless claims data was released in the evening, the market quickly weakened, breaking directly below the key 82,000 support level and falling all the way to around 80,300, as bearish sentiment was released in force. Lao Guo followed the plan and went short yesterday, successfully capturing an 1,800-point move with excellent timing.
Bitcoin is cur
post-image
BTC-0.70%
  • 1
There wasn’t much movement in the market today, but things were somewhat interesting on-chain. Bitcoin traded sideways around $60k, while altcoins saw more declines than gains, and market sentiment remained cautious. However, the stablecoin supply is still rising, indicating that funds haven’t left the market and are merely waiting on the sidelines for now. $BTC
post-image
BTC-0.71%
$ORCA Current price 2.492, down 14.42% over 24h, with a trading volume of 9.4M USDT, making it the only declining token among the three candidates; however, MA5=2.411 remains below MA20=2.47265, RSI 47.8 is neutral to weak, the MACD histogram at +0.01795 maintains bullish momentum, the price is near the Bollinger middle band within the 2.1652–2.7801 range, the amplitude over 30 candles is approximately 33.11%, and the funding rate of -0.0578% indicates a structure where shorts pay longs. Compared with $RLC
, which rose 38.09%, and $CTSI , which rose 17.71% over the same period, both have MA5
post-image
CTSI+16.39%
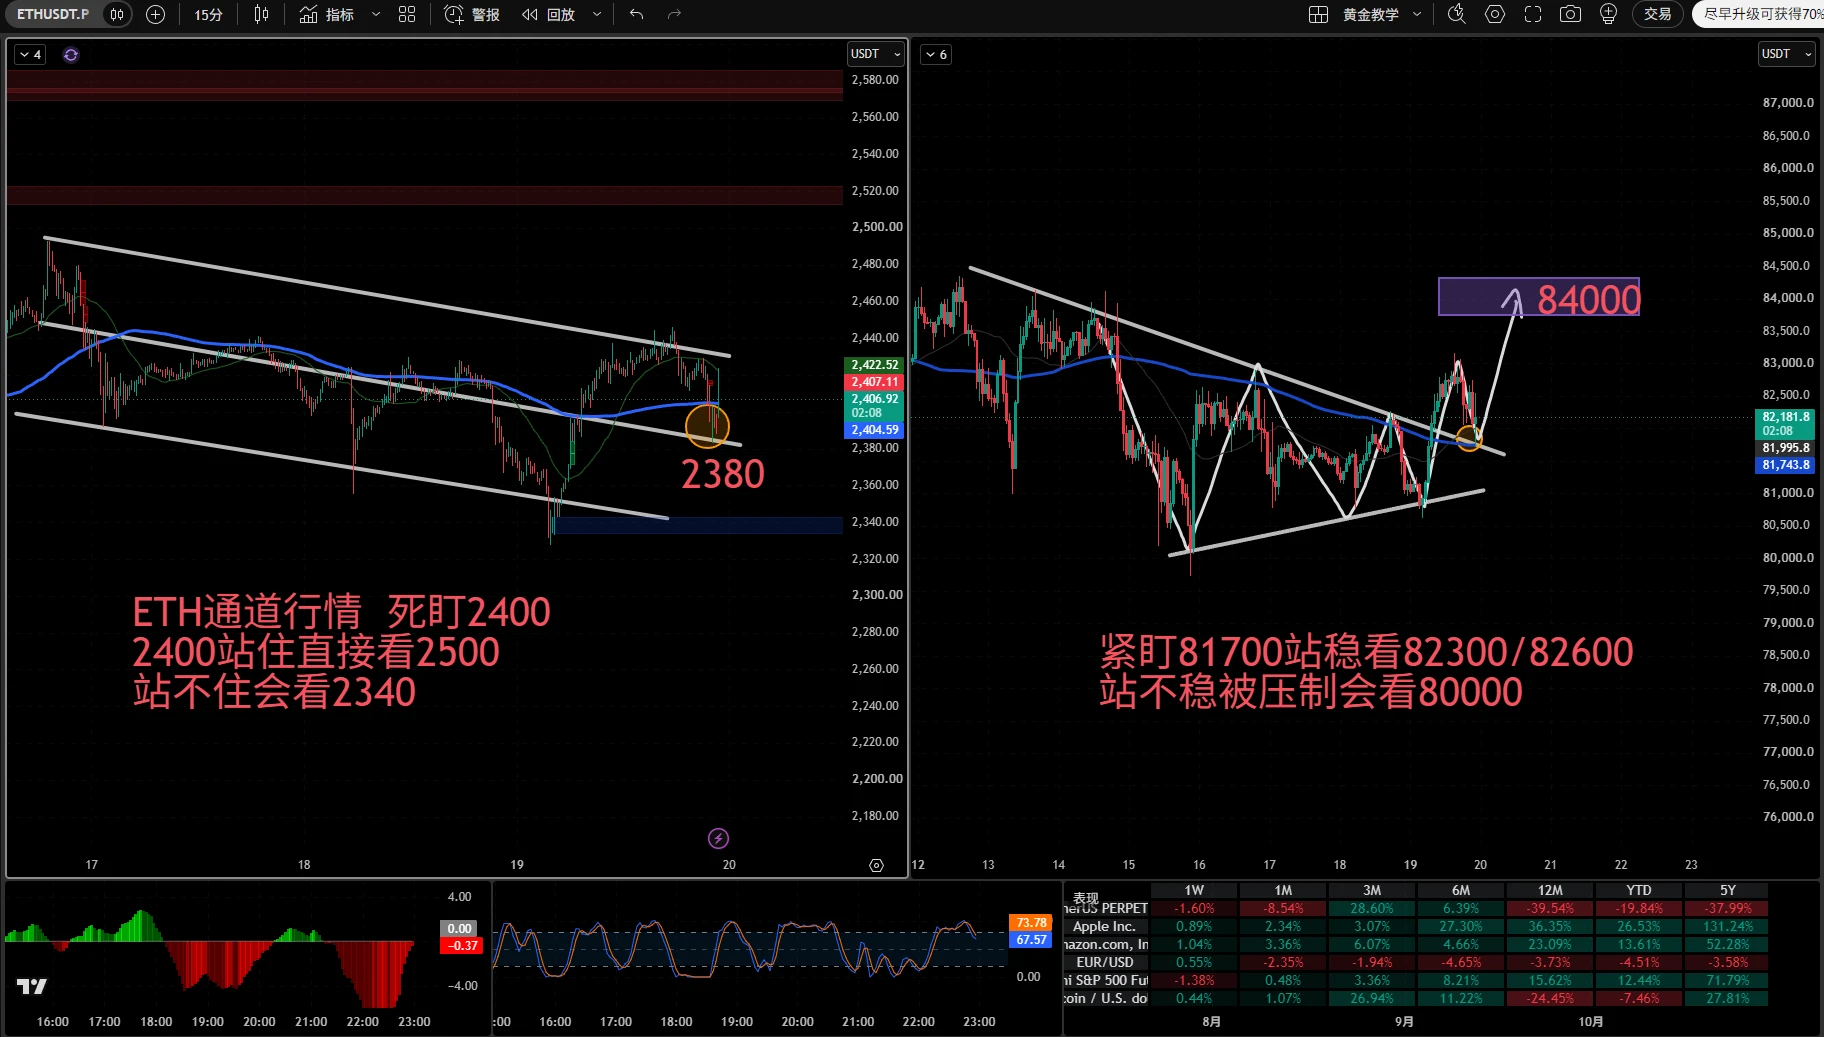
Ethereum’s 1-hour chart staged an oversold recovery rebound after plunging to a low of 2405, but this rebound is defined as a rally within a continuing decline, not a reversal into a bullish trend. In terms of indicators, the price has rebounded to below the Bollinger middle band, with a strong resistance zone forming near the middle band. This is the key test level for this rebound. Once the price reaches this area, selling pressure will be released intensively. On the indicator side, KDJ has risen into the overbought zone, with short-term bullish momentum severely depleted and insufficient s
post-image
ETH-3.00%
#XAU #黄金
The current price is around 4179, with a high-volume long bullish candle appearing on the chart. Short-term bulls are clearly gaining momentum, and the price has reclaimed the MA30 and MA60 moving averages, while approaching the previous high resistance zone at 4186.84. However, after the consecutive rise, blindly chasing longs is not advisable. Close attention should be paid to the validity of a breakout above the previous high and whether key support can hold on a pullback.
Two views:
1: If the price breaks above 4186.84 on high volume and holds above the 4170–4175 area during a sh
post-image
XAU+0.92%
#GateMoneyOfficiallyLaunches
Gate Money: One Gate, Everything Money — Bringing Crypto Closer to Everyday Life
Crypto becomes more useful when people can do more than buy, sell, and hold it. The real breakthrough comes when digital assets connect with the financial activities people already understand: receiving money, transferring funds, managing savings, exchanging currencies, and paying for everyday needs. Gate Money’s official launch is an important step in that direction, bringing a broader financial experience into the Gate ecosystem.
What makes this development exciting is the thinking
MARKET UPDATES
live-cover
LIVE1,037
The Fear & Greed Index is still at 59 in the greed zone, so many people assume altcoins should follow the rise—but this is a typical trading misconception. The Greed Index reflects the overall market’s sentiment temperature, not a buy signal for any individual coin. When BTC trades sideways at highs and funds concentrate in a few sectors, coins lacking narrative support may instead bleed against the trend. ADA is a current example.
$ADA Current price: 0.2332, down 9.44% over 24h, with a trading volume of 69.5M USDT. Technically, MA5=0.23322 has fallen below MA20=0.239145, forming a bearish mo
post-image
ADA-7.64%
NEAR-11.70%
Tong Ge’s 10.9 ETH strategy
Enter a short around $ETH 2480-2510, stop-loss at 2530, first target 2430, second target 2400.
Current price: 2480. The short entry at 2535 given last night dropped as low as 2403, so those who followed the setup enjoyed a comfortable profit. ETH fell from 2725 all the way down, dropping more than 300 points, with almost no decent rebound in between.
Now it has bounced from 2403 back to 2480, an 80-point rebound. It looks lively, but this is only a recovery after being oversold, not a trend reversal. It moves when BTC moves, but softens first when BTC pauses; it has
post-image
ETH-3.00%
Whenever the price of $PI falls, certain people immediately go crazy:
“Pi has nothing.”
“Pi lacks utility.”
“Pi is just a mining app.”
And so on… Does infrastructure disappear just because the price falls? 😂
Pi Sign-in is opening up to external parties.
PiVerify targets B2B identity verification.
Pi Node is opening up computing power.
SoloHost is bringing self-hosted apps into the Pi ecosystem.
OpenMind has already achieved a technical PoC with Pi Nodes.
CiDi Games is integrating Pi into games.
Pi SDK is expanding for developers.
The question truly worth debating now is:
“Will what Pi is bui
PI+0.38%
After retreating to the $81,000 level, Bitcoin recovered and settled around $82,000. The daily decline narrowed to 1.54%. However, the market remains focused on the $81,000 mark; this is precisely where buyers and sellers are squaring off.
The $81,000–$81,500 range is an area where buy orders have concentrated in recent days, with buyers increasing their positions there. Analysts identify the $81,119 level as support, while pointing to the $86,500–$86,750 range as resistance. In other words, $81,000 is not an arbitrary level; it is the floor that has held firm in recent weeks.
So, why did it d
post-image
User_any
#BTCPullsBackTo81000 Yo, so check it. Bitcoin slid under $82K for the first time in three weeks, and nah, it ain't one thing that did it. Three things hit at once, straight up.
First off, the Fed. Them September minutes dropped October 7, and all nineteen of 'em backed that quarter-point hike to 3.75–4.00%. Most said yeah, another one by year-end probably makes sense. But here's the thing — the market ain't buying it for October. Odds sitting at like 17% for October, but December? Around 70%. And that matters, 'cause when rates stay high, holding stuff that don't pay you nothing gets expensive. 10-year yield hanging near 5.3%, 30-year near 5.67%. That's decades-high type energy.
Second thing — Iran. Word is the White House told the Pentagon to get strike options ready, but nothing popping off before the midterms. Strait of Hormuz still a mess. Brent at $101.53, WTI at $89.39. Expensive oil means inflation ain't going nowhere, and that keeps the Fed chilling on the sidelines.
Third thing, and this the one that really hurt — leverage. Around $709 to $769 million in positions got liquidated in 24 hours. Longs took $647 to $685 million of that. Bitcoin longs alone, $172 million. Roughly 140,000 accounts got smoked. Open interest dropped 3.27% down to about $52.57 billion. That ain't people changing their minds — that's forced selling, plain and simple.
Institutional money? Mixed bag. US spot Bitcoin ETFs pulled in $118.86 million last session, total assets near $110.68 billion. But Ether ETFs? Lost $202 million same day. Them two ain't moving together no more.
Supply side — government wallets moved 12,267 BTC, 'bout $1.01 billion, to fresh addresses. No exchange deposit, so looks more like reshuffling than dumping.
Chart-wise, Bitcoin ran from $83,299 down to $80,397 before settling near $82,063. The $80,500 to $81,500 zone? That's where last month's highs sat, and that's what everybody watching. Hold there, we cool. Break it, and now we asking if the forced selling is done.
Next real test? October CPI and PPI. That's gonna tell us if inflation really cooling or if this pressure still building.
This ain't investment advice, just keeping it real.
$BTC ‌
BTC-0.71%
  • 4
  • 1
The short-term sudden volatility has directly undermined market confidence in reclaiming 80,000, but the market still strongly recognizes 76,000 and 78,000 as bottom support levels.
Current characteristics: Consensus on downside protection is extremely strong, expectations for the 80,000 threshold above have been impacted, and the market is experiencing rapid range-bound fluctuations. Expectations of a one-way deep decline are weak; once 80,000 is reclaimed and held, that level will offer greater trading value.
post-image
MU “Shakeout” or “Distribution”? The main players’ intentions have been fully exposed! Don’t let the illusion of a mere “technical correction” blind you. While everyone is panicking and cutting losses over OpenAI’s “negative news,” the truly smart money is secretly celebrating. The seemingly massive net outflows on the fund-flow chart, along with the fig leaf of large sell orders, are nothing more than the main players staging an extreme-panic short squeeze—they want to fool every timid short-term trader before swallowing the last juicy opportunity ahead of the December buyback window all by t
post-image
MU-3.17%
Load More

Join 40 M users in our growing community

⚡️ Join 40 M users in the crypto craze discussion

💬 Engage with your favorite top creators

👍 See what interests you

Trending Topics

Gate Money Officially Launches

3.48k Views12.91k Discussing

Gate officially launches Gate Money, a global integrated financial services app that brings digital assets, fiat, stocks, ETFs, gold, bank accounts, and payments into one Gate App. Users can manage assets, invest, send and receive funds, convert currencies, and make payments — all from a single account. Which use case are you most excited about? [👉 Learn more](https://www.gate.com/announcements/article/102094)

BTC Pulls Back to 81000

25.4k Views35.65k Discussing

AIStocksFallALABDropsOver9%

24.52k Views542 Discussing

View More