Square
Following
Hot
News
Profile
Share your thoughts
placeholder
Article
$ETH I said in my Sunday post that as long as ETH did not break through 25004, it could be shorted, but tonight it suddenly pushed just a little above 25005. I believe many people saw my post and opened shorts nearby.
You should all be in profit now—move your stop-loss to breakeven. If you like A Yang, give A Yang a follow.
post-image
ETH+1.02%
I broke down the token structure of $PAID ; 0.012918 is the concentrated trading pressure zone after the previous surge. Trapped holders above and short-term profit-takers are adding to the pressure, and buying support breaks down when the rebound reaches this level, leaving the bulls unable to push higher and forcing them into defense.
On the signal side, the price fell from 0.012918 to 0.004218, with a weak rebound and lower lows, indicating that selling pressure continues to be released. Sell orders dominate the order book, confirming weakening capital flows. 10x short return: +667.96%.
Ope
post-image
PAID+3.73%
ACE-0.05%
AKE-5.31%
It's official.
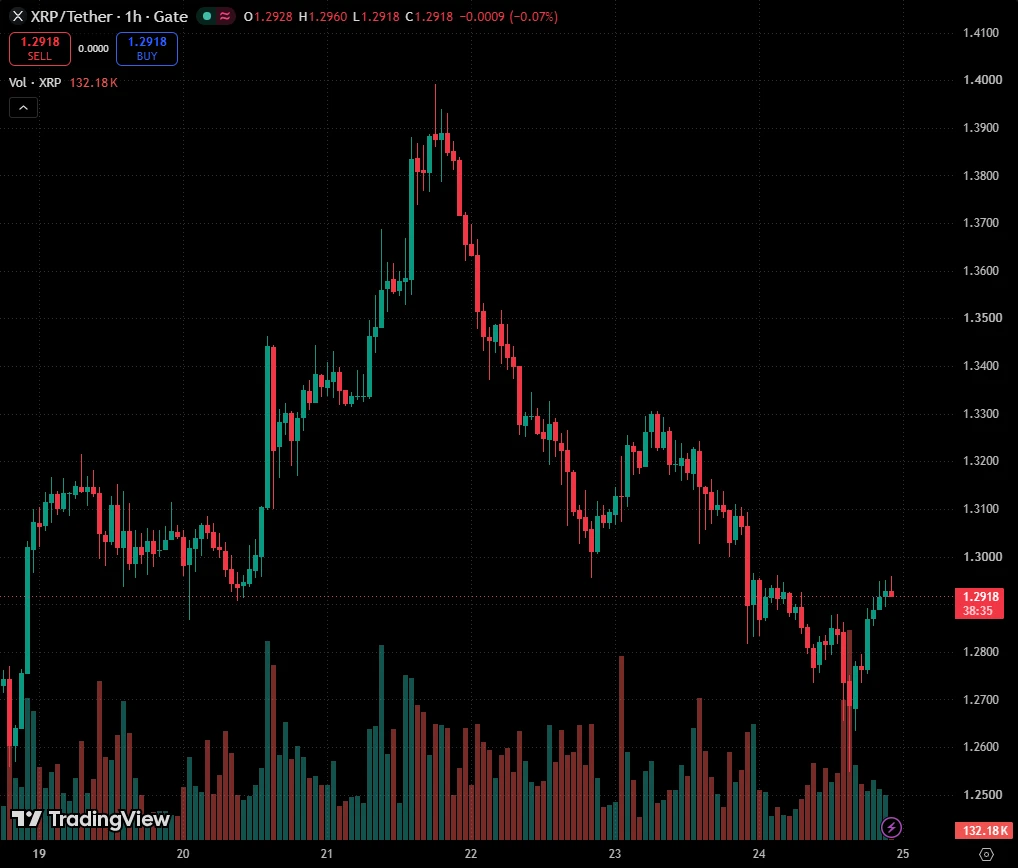
XRP Ledger patches a decade-old overflow bug in its payment engine that could have let an attacker mint about 18 trillion spendable XRP in a single transaction.
post-image
XRP+0.24%
Just watch and pay attention. The price will drop temporarily. I don't hold positions for too long here.
$BTC ‌
post-image
BTC+0.72%
  • 2
🚨 MEME SUPERCYCLE loading? 👀🔥
🐶
$DOGE
→ $4.20
🐕
$SHIB
→ $1
🐸
$PEPE
→ $0.69
🦊
$FLOKI
→ $2
💥
$BONK
→ $1
🌕
$LUNC
→ $1
🚀
$BABYDOGE
→ $10
If meme madness returns again…
crypto timelines may become absolute chaos 📈💀
post-image
MEME-0.31%
DOGE+0.96%
SHIB+0.38%
PEPE+2.96%
FLOKI+0.47%
Crypto Market Updates
live-cover
LIVE61
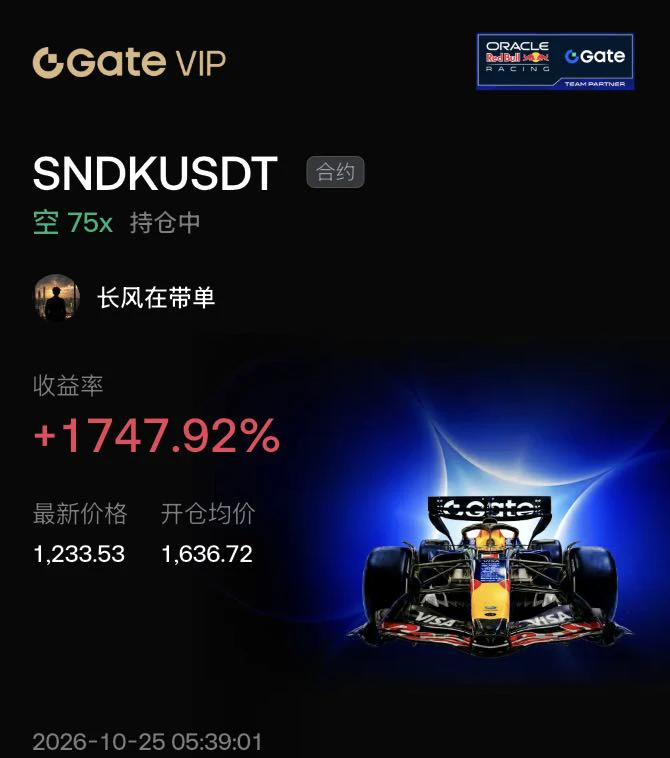
75x leverage flip to a short! $ZEC The short position directly pocketed a terrifying 829.76% unrealized profit! It opened at 1441.41 and crashed to 1272.85—this waterfall was insane!
The logic is simple: it rallied on the privacy narrative and AI concept, but the fundamentals simply cannot support such a high valuation. On top of that, the broader market traded sideways late at night, severely draining funds from altcoins. Seeing large sell orders and weakening longs around 1441, I immediately flipped short and rode the selling pressure to profit!
75x leverage leaves virtually no room for err
post-image
ZEC+3.98%
AKE-5.31%
  • 4
I remember how I used to struggle to open trades while I was still a newbie even when to follow simple futures trading calls was a problem for me.
This is why @tryquantio is important. As a newbie or someone who can't open trade manually, you can easily give a simple prompt to @tryquantio and your position is ready in a few clicks and seconds.
Earlier this morning, I got this trading call in a popular channel and I decided to follow the call without stress.
I opened the Quant AI chatbot and gave it a prompt that says: "Open an $ONDO long futures position with the USDC on my trading account. Yo
post-image
ONDO+1.94%
USDC+0.02%
Market update
live-cover
LIVE23
$FET The most dangerous misconception right now is equating “strong trend” directly with “it’s safe to keep chasing.” I’d rather lay out the opposing case first.
Bears see the risk after a break below 0.217, while bulls need to prove that buyers remain after a break above 0.2443. Current volume is 0.31x.
The current price is 0.2379, about 8.79% above the 1-hour support at 0.217 and about 2.69% below the resistance at 0.2443. The position determines which side is more urgent, with the next level to watch shifting to 0.2038.
It’s more reliable to let the boundaries provide the answer than to gue
post-image
FET+5.65%
Why does a 95% confidence score make SYMBOL impossible to ignore right now?

$TIA /USDT - LONG

Trade Plan:
Entry: 0.5795 – 0.5879
SL: 0.5435
TP1: 0.6139
TP2: 0.6340
TP3: 0.6641

Why this setup?
Why now? The daily trend is bullish and the 4h setup confirms momentum, while the 1h ATR of 0.016753 shows volatility is expanding enough to fuel a real move. The 15m RSI at 46.48 proves we are not overbought, leaving room for buyers to push price from the entry zone near 0.5837 toward TP1 at 0.6139 and then TP2 at 0.6340. This alignment of trend, volatility, and room to run sets up a clean long, bu
TIA+2.89%
Price action continues to consolidate in the zone between the last set of targets. 🎯
post-image
The price of sonic-3:native has already risen from 0.037 to around 0.067. It has surged sharply and is now close to its recent high.
What to do
Wait until it rises to the 0.067–0.070 range, then enter a short position.
First target: fall back to 0.063 (take some profit first)
Second target: fall to 0.058
Final target: fall to 0.055
Stop-loss: 0.077 (if it breaks above this price, it means the judgment was wrong—cut the loss and exit immediately)
Why be so careful
The upward momentum is still strong. Shorting now is essentially "betting against the trend that it will reverse," which is in
post-image
S+37.89%
SONIC-1.30%
$ALGO ALGO — Long-Term Setup
ALGOUSDT.P
— Long-Term Setup
Price is attempting a bullish reversal after an extended bearish trend.
Key levels to watch:
$0.1356–$0.1365 — Neckline breakout
$0.15–$0.18 — Intermediate targets
$0.20 — Major milestone
$0.2316–$0.24 — Long-term bullish target
The Adam & Eve pattern is promising, but confirmation is key. A daily breakout followed by a successful retest could strengthen the bullish case.
Until the weekly structure turns bullish, this remains a potential reversal — not a confirmed trend change.
Watching the neckline. Patience over prediction.
post-image
ALGO+6.59%
10.10-10.11 Weekend ETH Strategy Review
$ETH currently hit a high of 2552, with the candle body breaking above 2550, surpassing the third take-profit level but not reaching the fourth. Following Achen’s weekend strategy, profits have already been substantial!
It has now retraced to around 2540. The Bollinger Bands are opening upward, with the middle band supporting at 2515 and medium-term support at 2500. The current price is hugging the upper Bollinger Band, so the likelihood of a pullback is somewhat higher than for BTC. For now, simply wait for a signal while the price moves sideways.
Trad
AChenBit
10.10-10.11 Weekend ETH public trading plan
Prioritize executing $ETH long strategy
  Entry range: Light long near 2480 on a pullback; add near 2470
  Stop-loss defense: near 2460 (set according to position size; execute planB⬇️ after breaking below)
Take-profit levels
  First take-profit: near 2500 (touching the upper Bollinger Band)
  Second take-profit: near 2520 (resistance at the short-period high)
Third take-profit: near 2540 (medium-period high-volume trading zone)
Long-term target: near 2560 (establishing a long-term position in the pullback trend)
Trading factors: The narrowing Bollinger Bands indicate that after the sharp drop, the market has entered a narrow-range consolidation phase. Weekend volatility is limited, and weekend trading volume is contracting. For the range-bound market, first watch the first and second take-profit levels, then dynamically observe and analyze the trend on Sunday evening. After determining the overall trend for next week, watch the third take-profit level and the long-term target.
planB
If the entry range is not reached, the stop-loss at 2460 is broken, or the price breaks above 2520, execute the short strategy
Entry range: Wait for a high-level short above 2520 on a pullback; add near 2530
  Stop-loss defense: 2540 (unified stop-loss)
Take-profit levels
  First take-profit: near 2500
  Second take-profit: near 2480 (lower-band support)
Third take-profit: below 2460
Long-term target: below 2430
#Gate亮相TOKEN2049
#Ledger事件损失近9000万
#GateWCTCS9全球交易赛
repost-content-media
ETH+1.02%
Employees hate Mondays.
We don’t.
post-image
#BTCPullsBackTo81000
BTCPullsBackTo81000 — Bitcoin Price Analysis and Market Outlook
Bitcoin’s pullback toward the $81,000 level has brought renewed attention to market sentiment, short-term volatility, and the next potential price movement. After a strong period of price action, a correction can create uncertainty among traders, but it can also provide an opportunity to evaluate market structure and identify important support and resistance zones.
Bitcoin at $81,000: What Is Happening?
The $81,000 level is an important psychological price zone for market participants. When Bitcoin moves towa
BTC+0.71%
The centralization controversy is raging, yet $NEAR is still up 7.4% in 24h
The argument over “whether stolen funds should be blocked” is raging, while $NEAR only moved from 5.712 to 5.698—barely budging. The project team responded: no one can unilaterally halt execution.
Controversy aside, my direction is clear: I’m bullish on $NEAR . The current price is 5.702, up 7.4% in 24h, with an intraday range of 5.17 to 5.9. The pullback caused by the controversy is a dip-buying opportunity.
First, the daily RSI is 61.4, strong but not overbought, with the short-term moving averages in a bullish ali
post-image
NEAR+5.88%
10.10–10.11 Weekend zec Silk Road Recap
$ZEC currently peaked at 1299, still just 1 point short of reaching the fourth target. But no matter—the third target was 1290, and those who caught this Silk Road wave are now absolutely rolling in profits! Easily keeping 🫴zec under control—the strictest father of zec, 🤩🤩🤩
It has now pulled back to around 1270. The Bollinger Bands are opening upward, with short-term support at 1250 and mid-term support at 1230. Its momentum is extremely strong, but after a rapid surge, selling pressure was released and the short-term rise became overextended. It wi
AChenBit
10.10-10.11 Weekend ZEC strategy
Priority execution $ZEC long strategy
  Entry range: lightly go long on a pullback near 1210, add near 1200
  Stop-loss defense: near 1190 (set according to position size; execute planB if it breaks below)
Take-profit levels
  First take-profit: near 1230 (touching the upper Bollinger Band)
  Second take-profit: near 1250 (short-term high resistance)
Third take-profit: near 1290 (medium-term high-volume trading zone)
Long-term target: near 1300 (form a long-term position layout following the pullback trend)
Operational factors: The Bollinger Bands are gradually narrowing. After the sharp drop, the market has entered range-bound consolidation and recovery, with the short-term long-short battle relatively balanced. The red bars are extending slightly, and short-term bullish momentum has a slight advantage, but the indicator's upward momentum is limited, without a strong golden cross accompanied by a surge in volume. The rebound is a recovery after being oversold, rather than a strong one-way bullish trend. For the range-bound movement, first watch the first and second take-profit levels. Observe and analyze the trend dynamically on Sunday evening, then assess the third take-profit level and long-term target after determining next week's overall trend.
planB
If the entry range is not reached, the stop-loss at 1190 is broken, or the price breaks above 1250, execute the short strategy
Entry range: wait for a pullback to the high level above 1250 to go short, add near 1270
  Stop-loss defense: 1290 (uniform stop-loss)
Take-profit levels
  First take-profit: near 1230
  Second take-profit: near 1200 (lower-band support)
Third take-profit: below 1170
Long-term target: below 1140
#Gate亮相TOKEN2049
#Ledger事件损失近9000万
#GateWCTCS9全球交易赛
repost-content-media
ZEC+3.98%
$ZEC Can you dump Zec to 750
post-image
ZEC+3.99%
Load More

Join 40 M users in our growing community

⚡️ Join 40 M users in the crypto craze discussion

💬 Engage with your favorite top creators

👍 See what interests you

Trending Topics

GateAtTOKEN2049

41.35k Views21.85k Discussing

Gate brought a series of major events to TOKEN2049 Singapore! From the official launch of Gate Money to the F1 Red Bull driver meet-and-greet and the Gate Gala, we witnessed a new chapter of "One Gate, Borderless Finance." Which moment from TOKEN2049 stood out most to you?

LedgerLossesNear90Million

39.52k Views300 Discussing

GateWCTCS9GlobalTradingCompetition

34.6k Views5.16k Discussing

View More