
Square
Following
Hot
News
Notifications
Profile
Share your thoughts
placeholder
Article
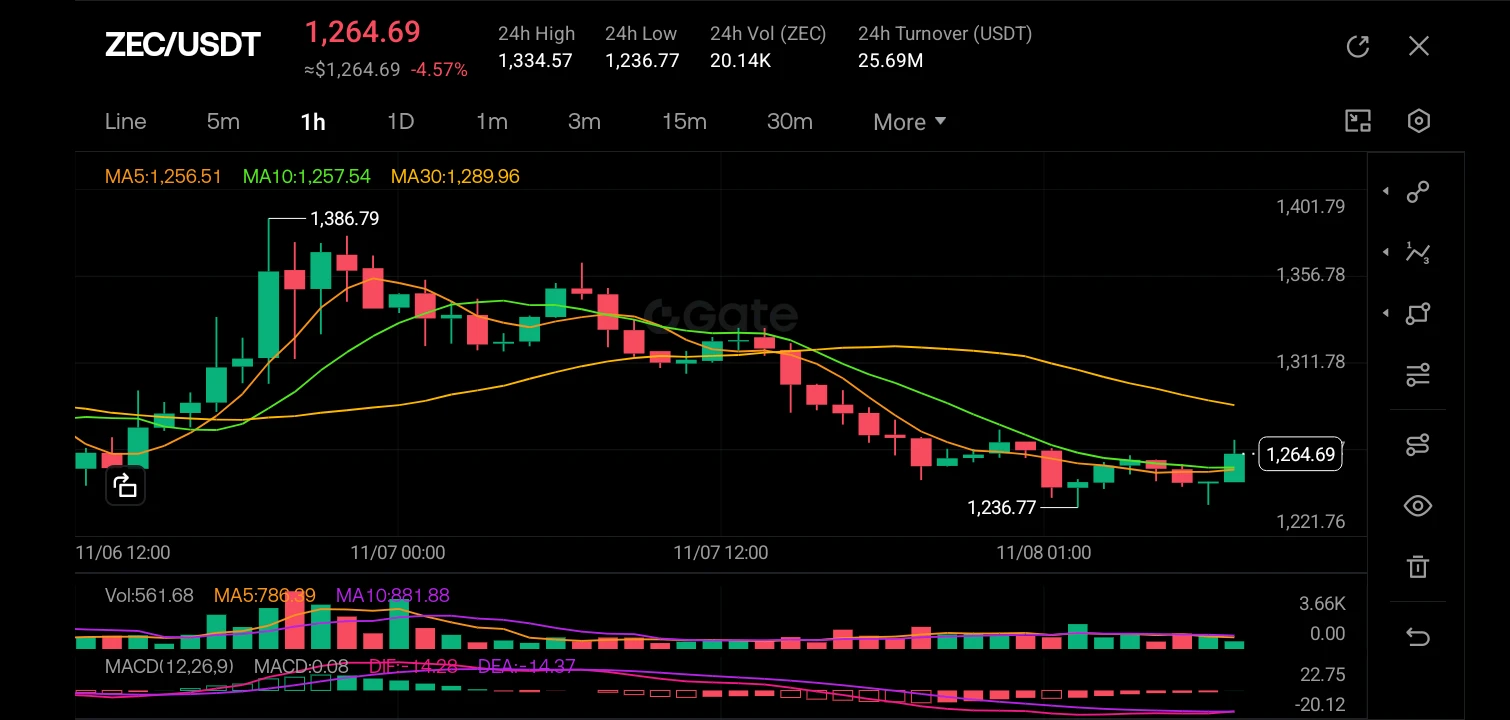
$ZEC ‌
The 1-hour chart reveals a definitive shift in market structure from a bullish uptrend to a corrective phase; after peaking at 1,386.79, the price action has formed a series of lower highs and lower lows, currently consolidating near the 1,264 level. The asset is trading below the yellow MA30 (1,289.96) which acts as dynamic resistance, while the shorter-term MA5 and MA10 have flattened out, indicating a momentary pause in the downtrend. The MACD histogram is hovering just below the zero line with a slight bullish convergence (golden cross forming), suggesting that the selling momentum
post-image
ZEC+1.16%
  • 3
🚨WARNING! ELIZABETH WARREN TO ATTACK CRYPTO AGAIN WITH NEW SENATE BANKING POWER!
WATCH ▶️
#crypto #cryptonews #bitcoin #senate #congress #clarityact #stablecoins #banks #thinkingcrypto
post-image
BTC-0.67%
Trenches
ZIG
Z
bade
b
ZIG
0x8c...1145
Market Cap
$.
Change
.
24h Vol
$.
Holders
.
STONK
S
bade
b
STONK
6GmA...UNgx
Market Cap
$.
Change
.
24h Vol
$.
Holders
.
IDOL
I
bade
b
IDOL
0x3b...ab07
Market Cap
$.
Change
.
24h Vol
$.
Holders
.
MAGGIE
M
bade
b
MAGGIE
8rHo...PmZV
Market Cap
$.
Change
.
24h Vol
$.
Holders
.
FLOAT
F
bade
b
FLOAT
Bv1a...BMmr
Market Cap
$.
Change
.
24h Vol
$.
Holders
.
[New Streamer] 🔹 High prices continue to erode purchasing power, and US consumer confidence remains
live-cover
LIVE1,142
US spot Bitcoin ETFs saw net outflows of about $1.28 billion this week, the largest weekly outflow since late June and the second consecutive week of withdrawals. As of Friday, the 12 funds had recorded cumulative net outflows of about $914.1 million this year. Before this week began, they still had about $368 million in year-to-date net inflows, all of which was wiped out in just one week. Another roughly $411.9 million flowed out on Friday alone, with BlackRock's IBIT accounting for about $403 million of withdrawals. $BTC The current price is around 75950, with a 24-hour high of 76251 and a
post-image
BTC-0.67%
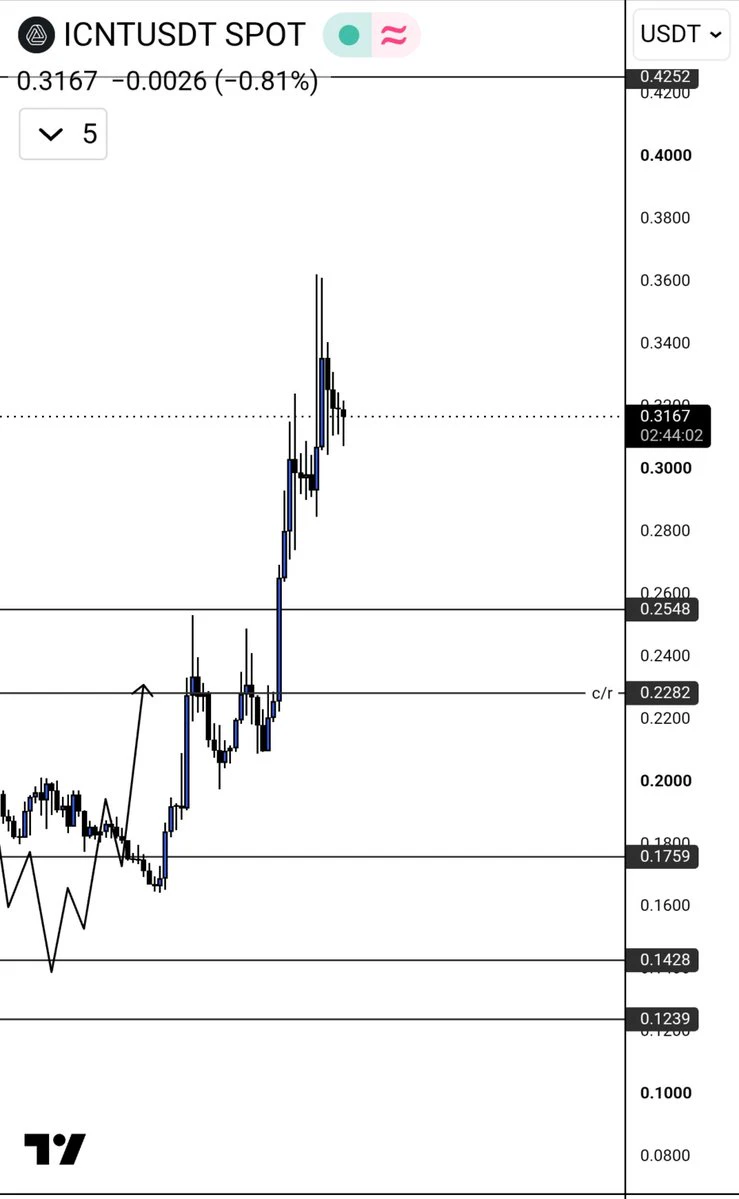
#Icnt $Icnt 0.42$ is pending Tp
post-image
ICNT-10.32%
  • 1
  • 1
Nasdaq plunges 5.52%, Bitcoin falls below $76k! Is this bull market clocking out early?

Yesterday we were hoping for a rally; today we're worried our accounts will be wiped out. Financial markets sometimes move faster than food delivery drivers!
On November 5, U.S. stocks saw significant selling pressure, with the Nasdaq falling 5.52%, the S&P 500 dropping 4.36%, and the Dow Jones falling 3.44%. Bitcoin couldn't escape the sell-off either, dropping about 6% and briefly falling below $76k.
The post-election rally has been almost entirely erased, and market sentiment has cooled noticeably.
This
NAS100+1.90%
BTC-0.67%
SPYX+0.01%
  • 39
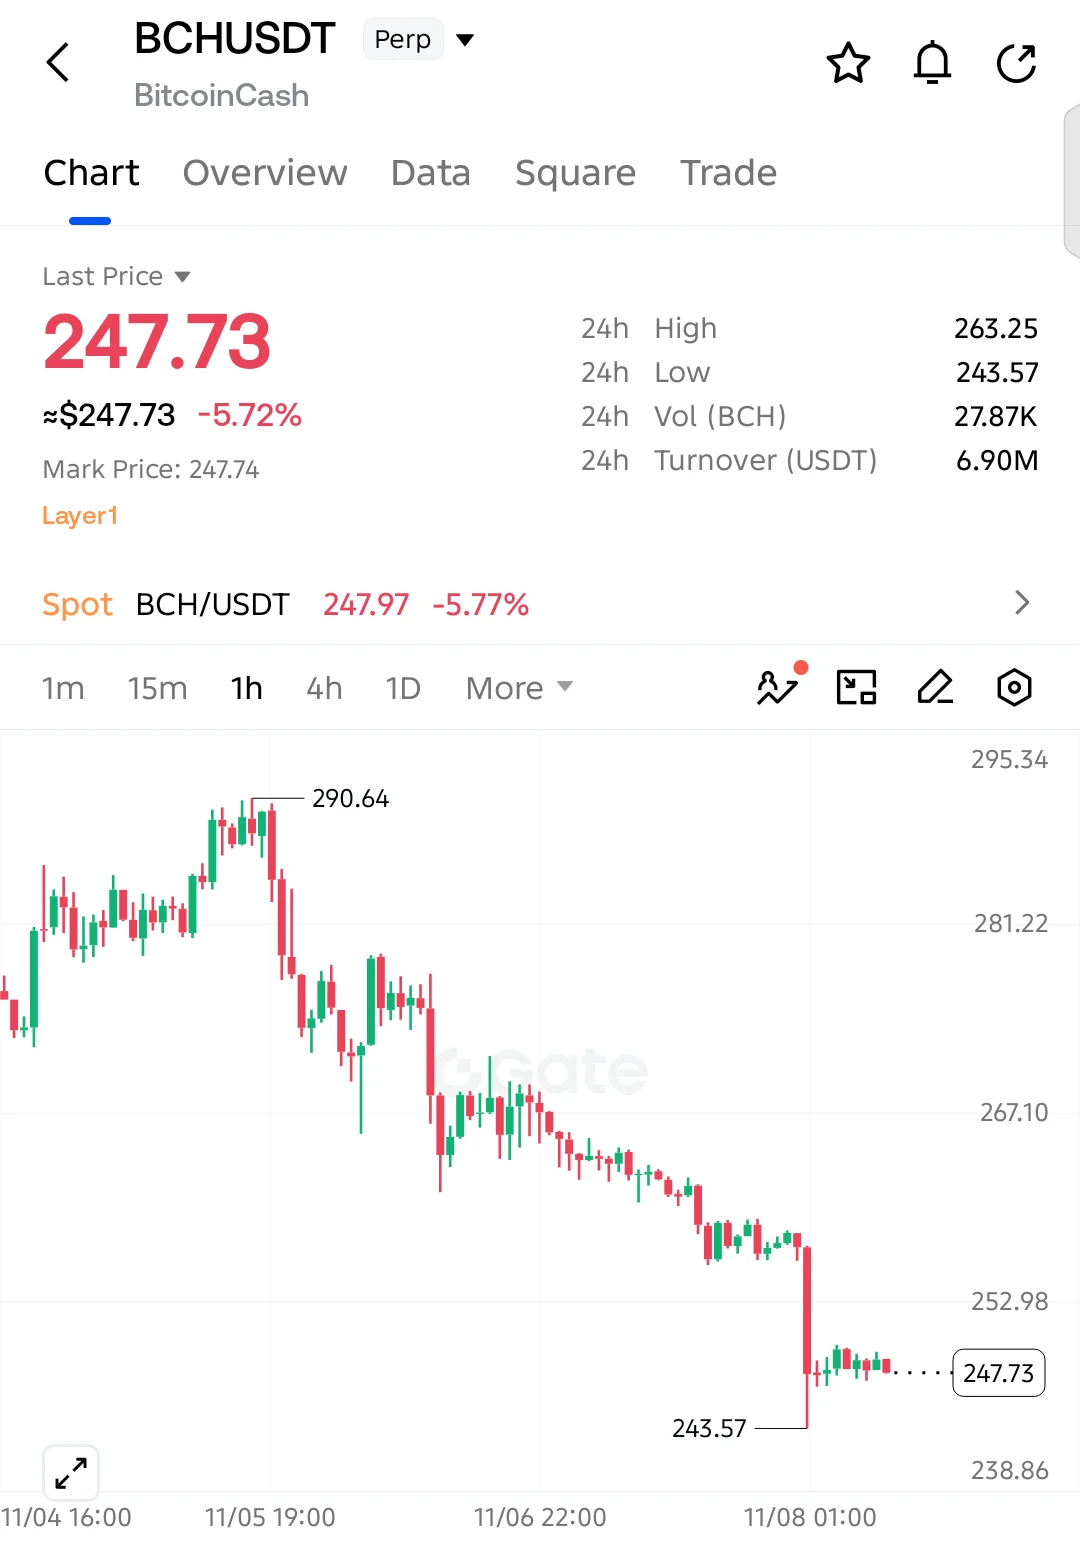
$BCH SHORT SETUP — BEARS PREPARING FOR ANOTHER LEG DOWN!

$BCH is down 5.72%, and selling pressure remains strong after the sharp decline from 290.64. Price is struggling near 247.73, with another breakdown possible!

Entry: 247.73
SL: 251.50

TP1: 243.57
TP2: 240.00
TP3: 238.86
Final Target: 235.00

Sellers continue to dominate as $BCH forms lower highs and fails to recover above 250. The weak consolidation near recent lows suggests buyers are struggling. A breakdown below 243.57 could accelerate the decline toward 240 and potentially 235.

Invalidation: A sustained recovery above 251.50 weak
post-image
BCH+1.05%
BTC falls below $76k! Ahr999 drops to 0.43—is the bull market handing out freebies?

Bitcoin has started teaching investors another lesson in psychology! 😂
As BTC retreats to around $76k, the Ahr999 indicator has also fallen below 0.45 and currently sits at around 0.43, re-entering what the market often calls the “buy-the-dip zone.”
What does this number mean?
Ahr999 takes into account BTC’s current price, the cost basis of dollar-cost averaging over 200 days, and its long-term growth valuation to gauge where Bitcoin’s price stands within its historical valuation range.
Simply put, the lower
BTC-0.67%
  • 13
Bitcoin Repeating 2023 Setup That Sparked Last Major Rally: Analyst
Bitcoin may be quietly setting up its next big move. Despite this week’s sell-off, a crypto analyst has spotted a pattern on the weekly chart that last appeared in 2023, shortly before BTC launched a rally that more than doubled its price.
BTC is currently trading around $76,000, sitting just above its weekly 50-period moving average (MA) at roughly $75,500. That comes after the price was rejected from the weekly MA 100 near $87,400, leaving Bitcoin stuck between the two lines.
⚠️ Personal market analysis only. NFA — manage ri
BTC-0.67%
#USNonfarmPayrolls #USNonfarmPayrolls

US Nonfarm Payrolls is one of the most important economic reports in the United States. Investors, traders, and financial markets closely watch this report because it provides important information about the condition of the US job market.

Nonfarm Payrolls shows how many jobs were added or lost in the United States during the previous month, excluding certain sectors such as farming and private household employment.

This report is important because the strength of the job market can influence the Federal Reserve's interest rate decisions.

If the US add
BTC-0.67%
  • 3
Altcoins are getting crushed! 70% are below the 200-day moving average—is a reversal closer than we think?

What’s the most interesting thing about the market?
When prices rise, everyone thinks they’re an investment genius; when they fall, everyone starts studying long-term investing!
Now, another noteworthy data point has emerged in the altcoin market.
CryptoQuant analyst Darkfost pointed out that around 70% of altcoins on a certain exchange are currently below their 200-day moving average, compared with only about 10% in early October.
Meanwhile, the total altcoin market cap has shrunk by ab
NVDA+2.80%
  • 31
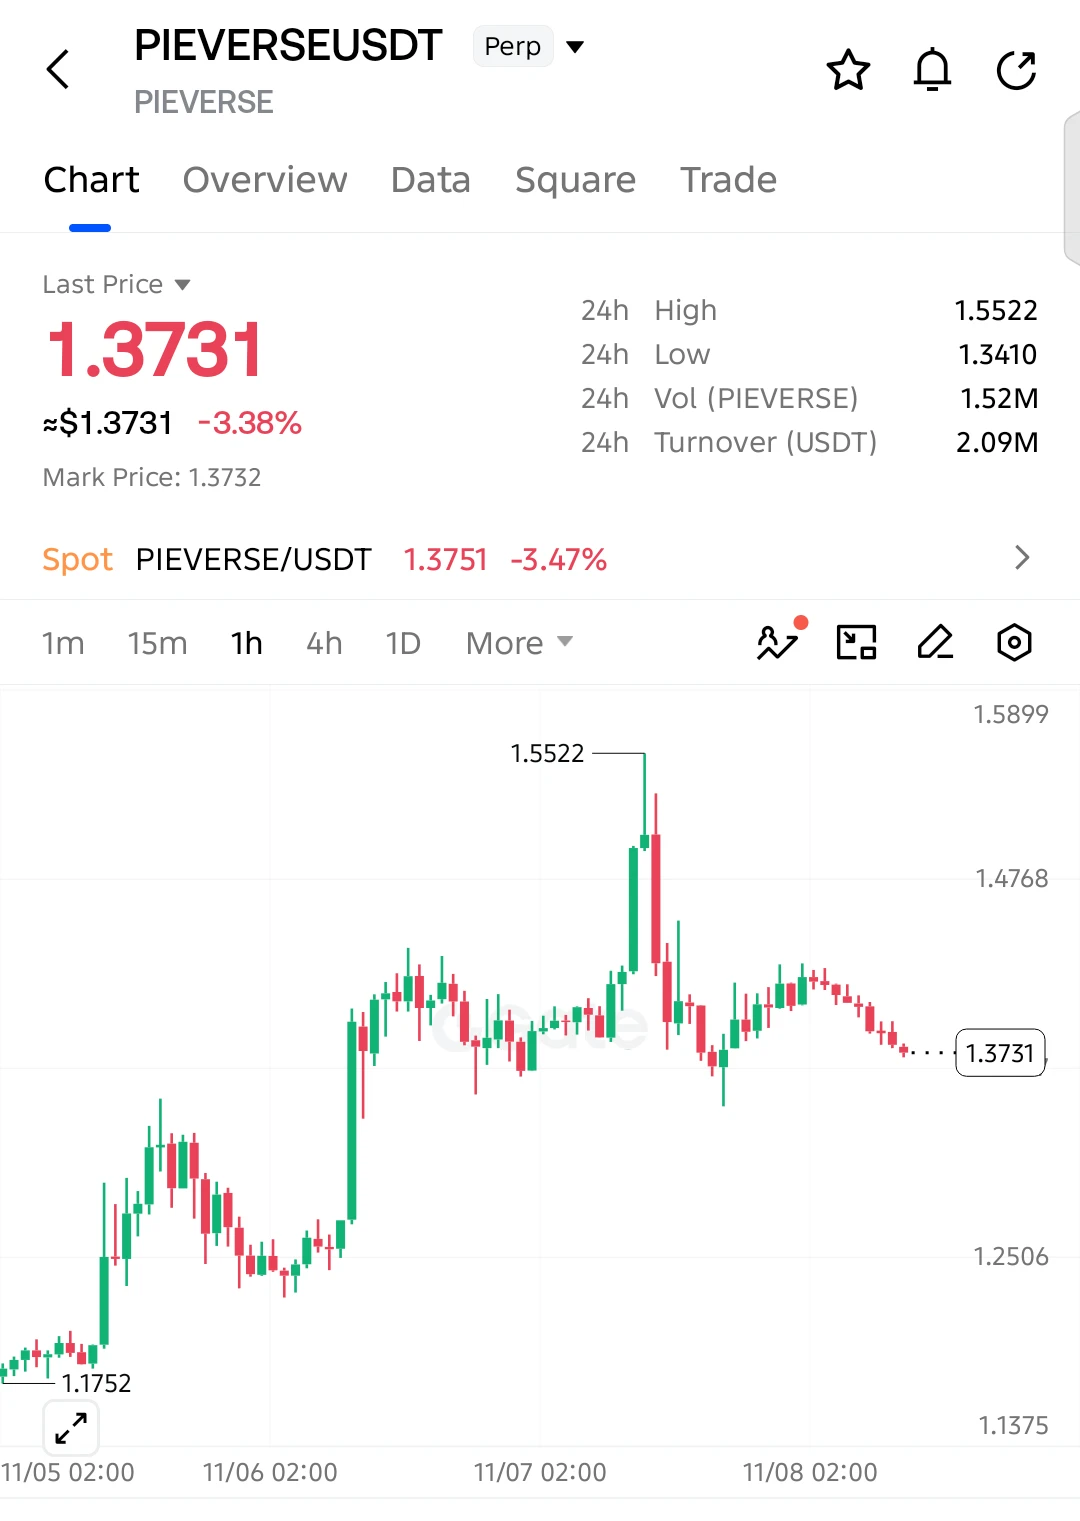
$PIEVERSE SHORT SETUP — SELLERS TARGET ANOTHER DROP!

$PIEVERSE is down 3.38%, with bullish momentum fading after a sharp rejection from 1.5522. Sellers are gaining control as price forms lower highs!

Entry: 1.3731
SL: 1.4110

TP1: 1.3410
TP2: 1.3200
TP3: 1.2900
Final Target: 1.2506

The recent recovery failed to sustain above 1.43, and sellers are pushing price back toward key support. A breakdown below 1.3410 could accelerate selling pressure toward 1.29 and potentially lower.

Invalidation: A sustained recovery above 1.4110 weakens the bearish setup.

Keep your eyes on $PIEVERSE!
post-image
PIEVERSE+0.58%
Before CPI is released, BTC could make a big move! Is November 10 an opportunity or a trap?

Bitcoin has had a rough time lately. The slightest jitters in market sentiment, and the candlesticks start putting on a free-fall show! 🤣
Now, everyone has their eyes on the U.S. October CPI release on November 10.
Why can one inflation reading make BTC so nervous?
Because CPI affects market expectations for the Fed's interest rate policy, and rate expectations in turn affect dollar liquidity, risk appetite, and capital allocation.
If inflation comes in below expectations, the market may see more room
AMD+11.55%
  • 14
When BTC Pulls Back, How Can You Tell a Normal Correction from a Trend Reversal?

In BTC trading, one of the most common mistakes people make is treating every decline as a trend reversal. As soon as the price pulls back, they rush to close positions or even open short positions; but sometimes, the market is simply undergoing a normal correction during an uptrend, after which the price strengthens again.

So, how can you distinguish a normal pullback from a genuine trend reversal?

First, observe the structure of highs and lows. In a healthy uptrend, prices typically form progressively higher
post-image
BTC-0.67%
Expectations for a Fed rate hike in December suddenly surge. Is there still a chance of a year-end Bitcoin bull market?

The year-end rally hasn’t officially begun, but macro markets are already building suspense.
The U.S. added 165,000 nonfarm jobs in October, far exceeding market expectations. The strong jobs data has revived concerns that the Fed may continue tightening monetary policy, with the probability of a December rate hike reportedly rising to 77.7%.
For investors hoping for improved liquidity by year-end, this is undoubtedly a signal that deserves serious attention.
If the Fed cont
BTC-0.67%
  • 25
Our Pickleball Open
Day 1 prediction market results: 180u 
Come to Dope Court for refreshments, socializing, exhibition matches, and profits!
You can still watch the livestream and predict the Olympics today
SanDisk, Micron, or SK Hynix? If I could buy only one AI storage stock, which would I put my money into?

If you were given a sum of money right now and could choose only one of SanDisk, Micron, and SK Hynix, which would you pick?
This question is a bit like choosing a partner: SanDisk is passionate, Micron is more well-rounded, and SK Hynix is the technical type.
First, SanDisk. It focuses mainly on NAND flash and enterprise SSDs. AI data centers need large amounts of high-speed storage, so as demand grows, the company’s earnings could show considerable upside. But the risks are clear, too: N
MU+4.71%
  • 41
BIRB | Short 🔴 | Bearish | 15m 24h: -8.38% | Volume: 26.4M USDT. Short rationale: Price below EMA200; EMA20/50/200 in bearish alignment; RSI14 at 32.2; MACD histogram negative; ADX14 at 31.5; volume at 0.59 times the 20-candle average; trend pullback/continuation. Entry: 0.08872 Stop loss: 0.0924167 Take profit 1: 0.0840992 | Take profit 2: 0.0813267 | Take profit 3: 0.07763Entry price is for reference only; do not chase. The strategy is invalidated if the stop-loss level is hit. Technical analysis only; not financial advice.$BIRB $BIRB
post-image
BIRB-16.68%
Happy Deepavali to everyone celebrating 🪔
May your lamps stay lit and your liquidation alerts stay quiet.
post-image
🔹 Vitalik Buterin Says SHIB Donation Worth Hundreds of Millions of Dollars Exceeded Expectations
live-cover
LIVE2,684
Load More

Join 40 M users in our growing community

⚡️ Join 40 M users in the crypto craze discussion

💬 Engage with your favorite top creators

👍 See what interests you

Trending Topics

USCPIDataIncoming

2.71k Views1.5k Discussing

The U.S. October CPI report will be released on November 10 at 8:30 a.m. ET. September CPI came in at 3.7% year over year, and markets will be watching closely for signs that inflation is cooling, especially in core CPI. A softer-than-expected reading could strengthen rate-cut expectations, while hotter inflation may pressure risk assets through higher Treasury yields and a stronger dollar. How do you think this CPI print will move $BTC, U.S. stocks and gold?

USAIStocksHitHard

24.25k Views3.7k Discussing

USNonfarmPayrolls

42.24k Views4.41k Discussing

View More