Square
Following
Hot
News
Notifications
Profile
Share your thoughts
placeholder
Article
btc market updates
live-cover
LIVE2,326
SOL-0.77%
BTC-0.67%
ETH-1.26%
USDC+0.01%
XRP-1.15%
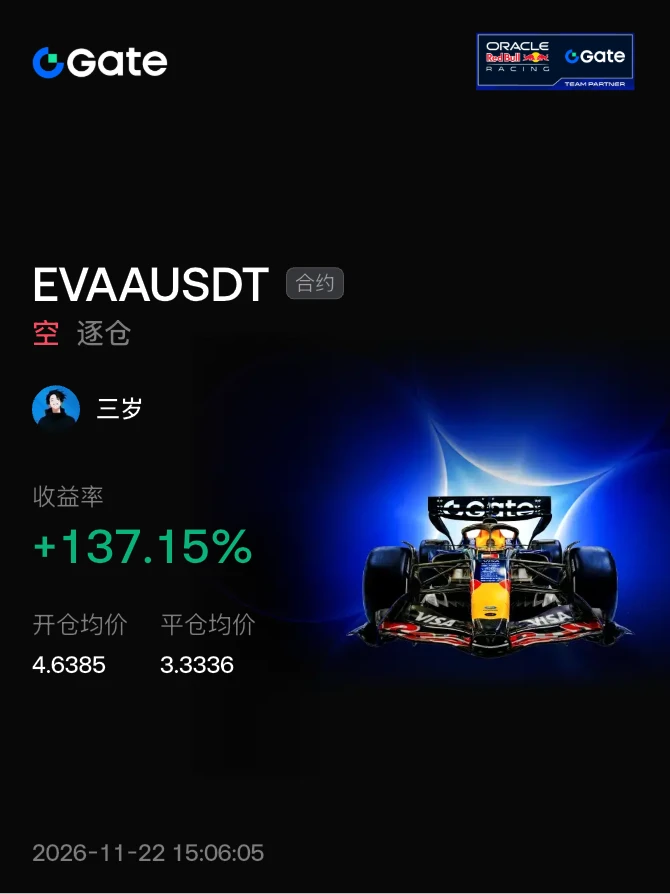
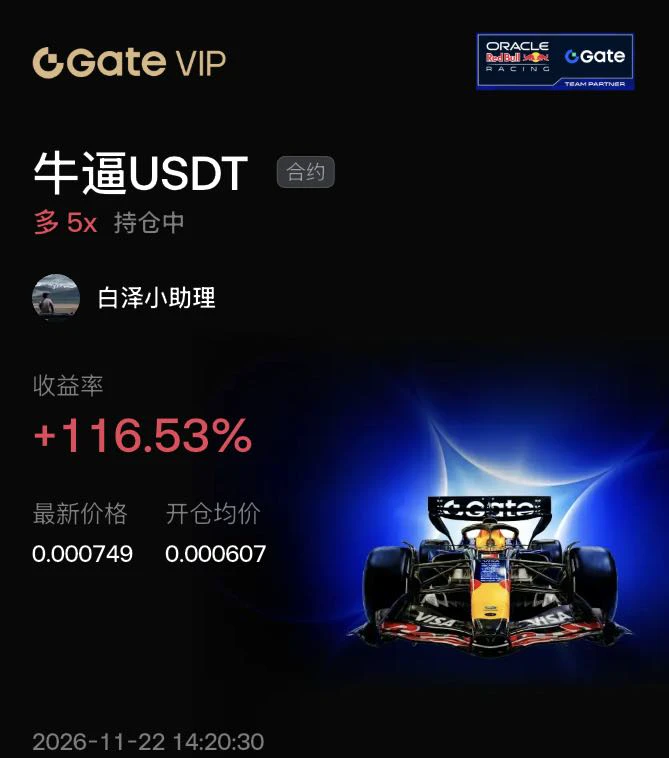
Those who got in basically all made money
Have you not seen the waters of the Yellow River come from the sky
Have you not seen likes, comments, and shares
I've closed out and left. Friends who like trading altcoins,
I basically share entry levels whenever I open a position
​#晒出我的合约收益
post-image
Trenches
IDOL
I
bade
b
IDOL
0x3b...ab07
Market Cap
$.
Change
.
24h Vol
$.
Holders
.
JAGENT
J
bade
b
JAGENT
0x8e...ae15
Market Cap
$.
Change
.
24h Vol
$.
Holders
.
PIEVERSE
P
bade
b
PIEVERSE
0x0e...25a9
Market Cap
$
Change
.
24h Vol
$.
Holders
.
FIONA
F
bade
b
FIONA
B34n...pump
Market Cap
$.
Change
.
24h Vol
$.
Holders
.
mihao
m
bade
b
mihao
4Cxj...pump
Market Cap
$.
Change
.
24h Vol
$.
Holders
.
$WLD Short position 75x
The entry was based on three failed attempts to break above 0.25, with each high lower than the last and a dense cluster of trapped positions. I entered when price reached the level. The stop-loss was fixed above 0.2530 before entry and would not be changed. Take-profit was split into two levels: halve the position at 0.2220 to lock in the cost, and let order book signals guide the rest.
$NVDA
Price moved sideways once during the trade, so I checked the order book again. Sell orders kept thickening, no buyers stepped in, and there were no signs of the structure turning
WLD-5.57%
NVDA-0.35%
ETH-1.23%
#下周PCE与GDP数据将揭晓
On Nov 25 at 21:30, US PCE, revised GDP, and personal spending are released simultaneously. There is little suspense over the direction of rate hikes; the focus is on the magnitude and path. Just watch these three columns: prices, growth, and asset correlations.

I. Information to watch
Next week has a set of data worth marking on the calendar in advance. According to CLS's investment calendar, on Nov 25 at 21:30, the US October Personal Consumption Expenditures Price Index, the revised annualized quarterly rate of real GDP for Q3, October personal spending, and durable goods
ANT-8.68%
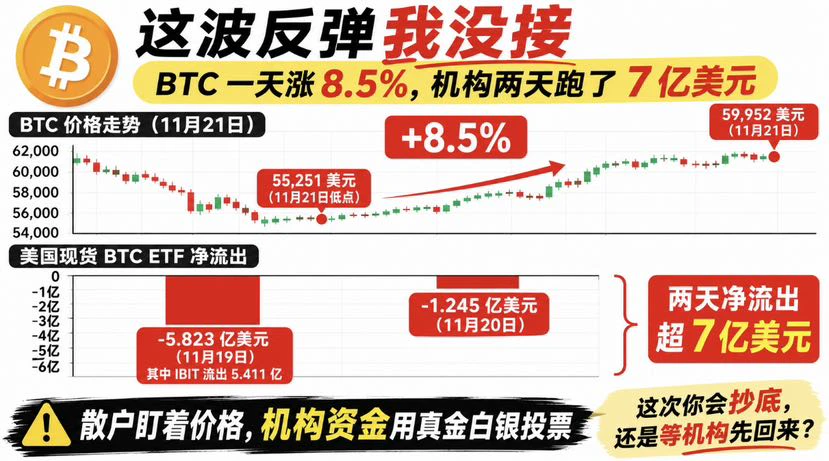
I didn’t catch this rebound. BTC rose 8.5% in a day, but ETFs saw net outflows of over $700 million over two days.

The price rebounded from $55,251 to $59,952—a solid move.

But the fund flows tell a different story:

* November 19: $582.3 million in net outflows, including $541.1 million out of IBIT.
* November 20: $124.5 million in net outflows.

Retail investors watch the price, while institutional investors vote with real money.

So what matters more to me now isn’t how much BTC rose in a day, but when ETF flows actually turn positive and whether it can hold above $60k.

I’d rather miss o
post-image
BTC-0.67%
  • 1
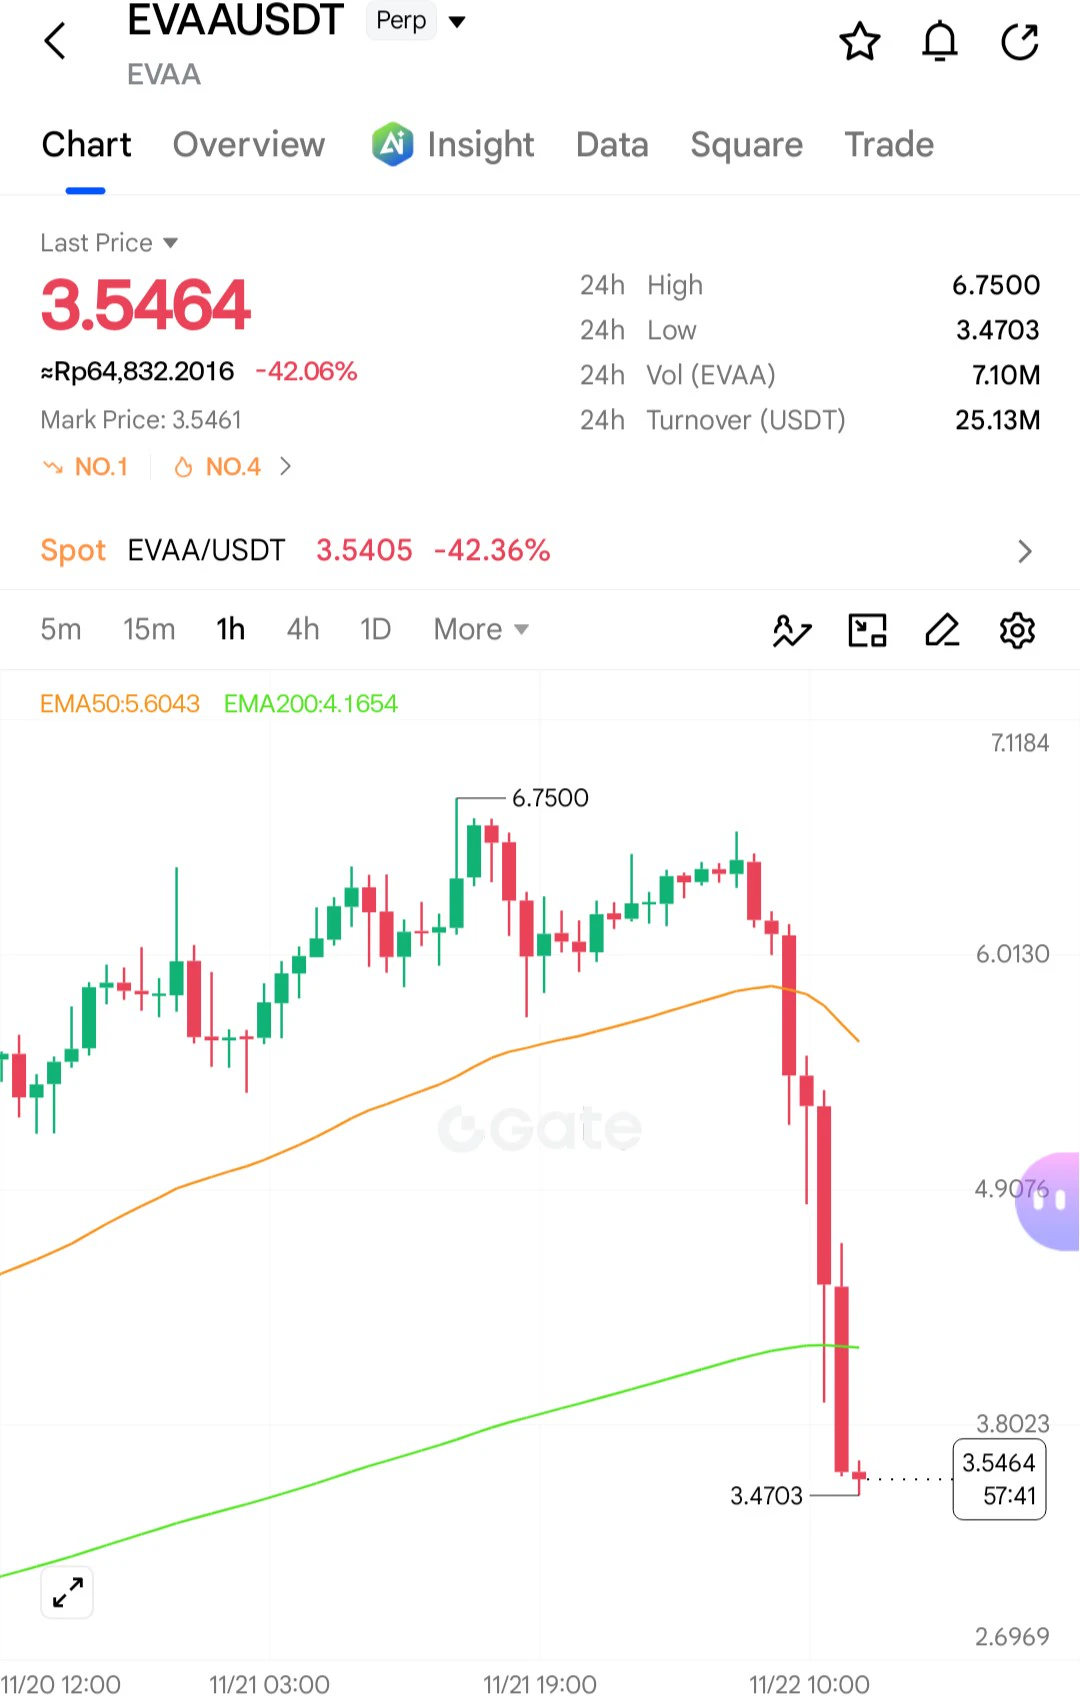
$EVAA Bought the dip, bought the dip—the rebound is pretty quick
EVAA-0.49%
  • 1
On November 21, Bitcoin fell below 58,000, Ethereum dropped more than 10%, the fear index was 12, and 89 of the top 100 coins were down.

When a small meme coin moves against the market at a time like this, it usually doesn’t mean investors are bullish on it—the order book is thin, and a few tens of thousands of dollars can move it. Its intraday range was 57%, covering in one day the distance others move in a week.

In the futures market: open interest fell more than 35% in a day, shorts accounted for over 70% of liquidations, and the funding rate was positive, meaning longs were paying shorts
post-image
BTC-0.65%
AKE+6.39%
  • 1
  • 1
$BTC
Bearish scenario
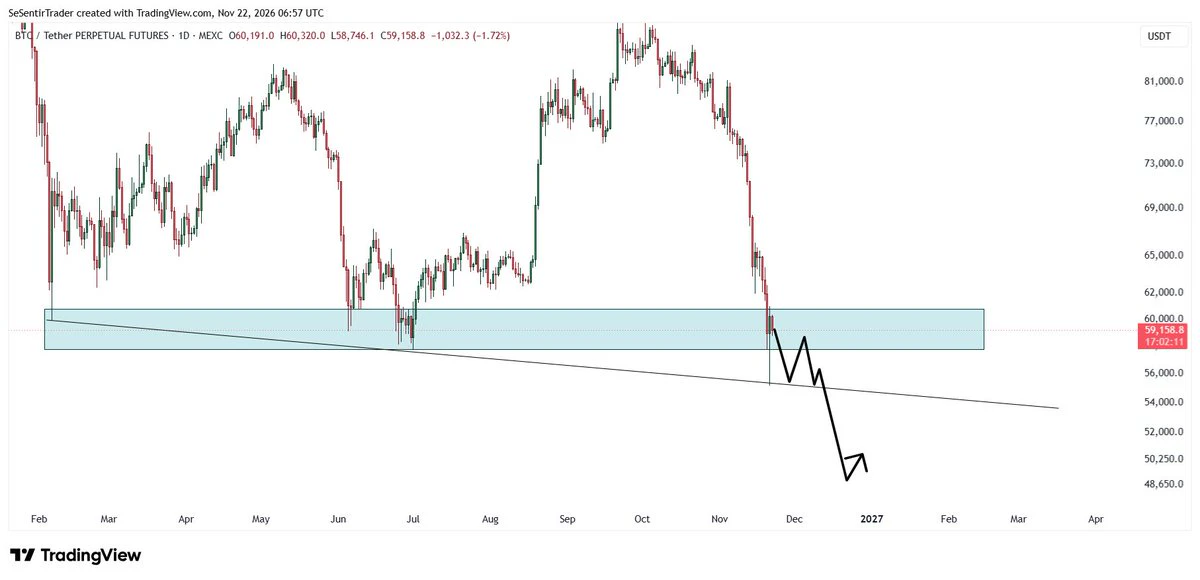
GM everyone, Bitcoin is now pretty likely to range between 55,000$ and 60,000$.
If we get back over 60,000$, this might indiate a potential revovery from here.
However, if Bitcoin has no reaction from here and stays under 60,000$, I will surely look for shorts.
post-image
BTC-0.67%
CRYPTO RELIEF BOUNCE OR DEAD CAT? 🐱
Bitcoin fell from 75.5K on Nov 10 to 55.1K yesterday. That's −27% in 11 days and its lowest level since Sept 2024
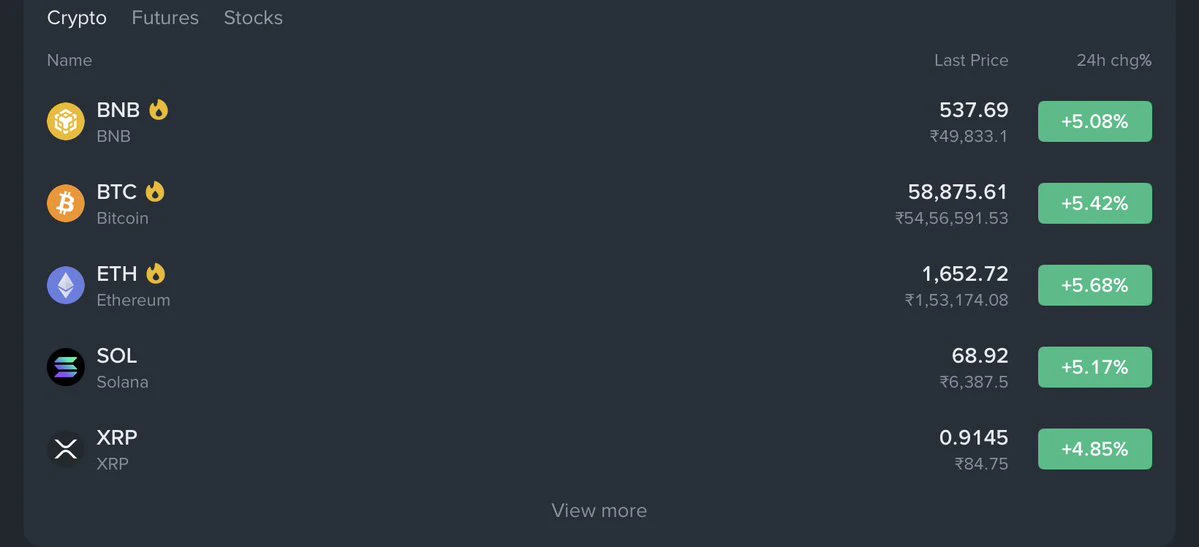
Now the whole board is green 🟢
$BTC 58,850 (+5.3%)
$ETH 1,652 (+5.6%)
$BNB 537 (+4.9%)
$SOL 68.8 (+4.9%)
$XRP 0.913 (+4.7%)
What caused the dump:
• An AI valuation scare hit tech stocks, and the Nasdaq fell 4%+ on Friday
• Fed rate-hike fears and higher real yields pushed money into cash and bonds
• Spot BTC ETFs saw $1.25B+ in outflows from Tuesday to Friday
• $2.4B+ in liquidations, mostly leveraged longs

BTC bounced to 60.97K, got rejected,
post-image
BTC-0.67%
ETH-1.26%
BNB-0.76%
SOL-0.77%
XRP-1.15%
  • 2
  • 1
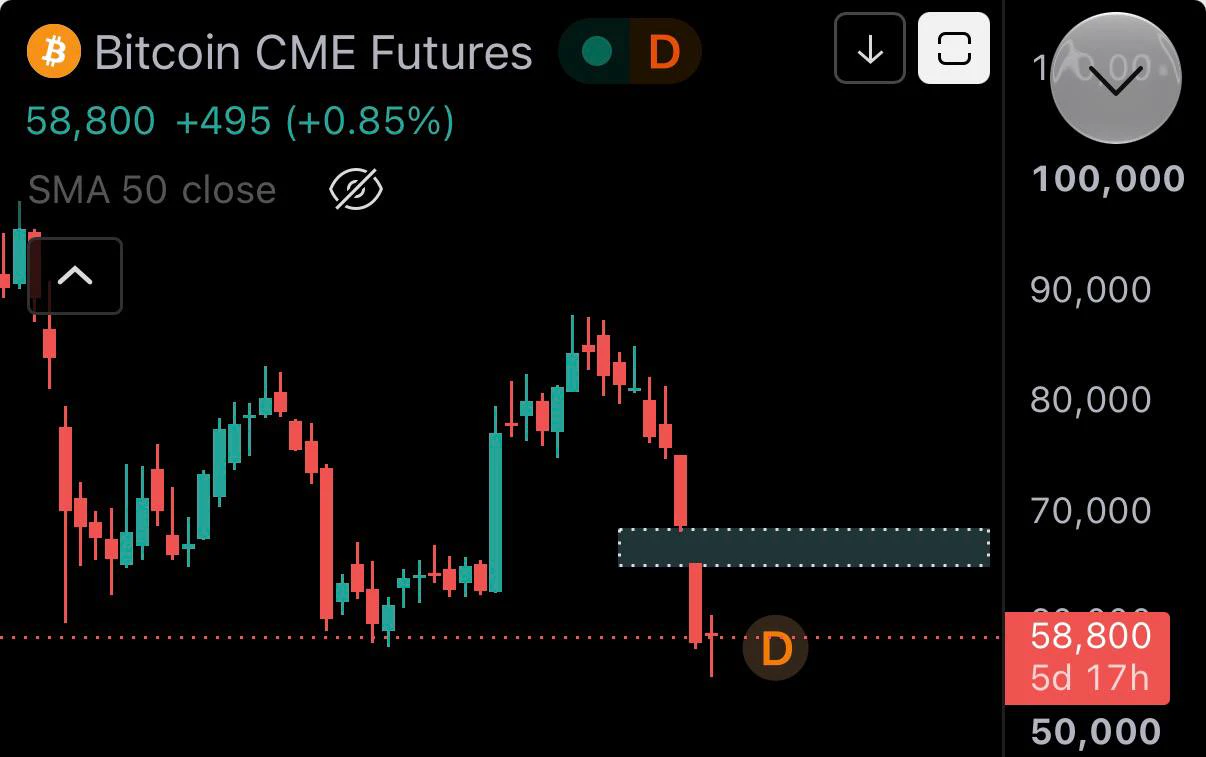
Bitcoin has created a new CME gap, and price often moves back to fill it.

BTC is already oversold after a massive drop.

If $55,000 holds without a daily close below it, we could see a recovery toward the CME gap soon.

#BTCReboundFaces60KTest
post-image
BTC-0.65%
  • 2
People online these days really know how to twist the knife.
Skunked! And skunked during a nighttime “battle,” no less 🤣🤣
🐋 WHALE WATCH : Four sectors. One cycle. Pick your conviction.
=> AI — $TAO $186 $FET $0.108 $RENDER $3.00
=> RWA — $ONDO $0.278 $LINK $8.56 $SYRUP $0.088
=> DeFi — $AAVE $95 $HYPE $60.70 $AERO $0.398
=> Privacy — $ZEC $774 $XMR
Which sector leads 2028 and whats your strongest ticker?
post-image
TAO+0.41%
FET-1.52%
RENDER+0.47%
RWA-0.39%
ONDO-0.29%
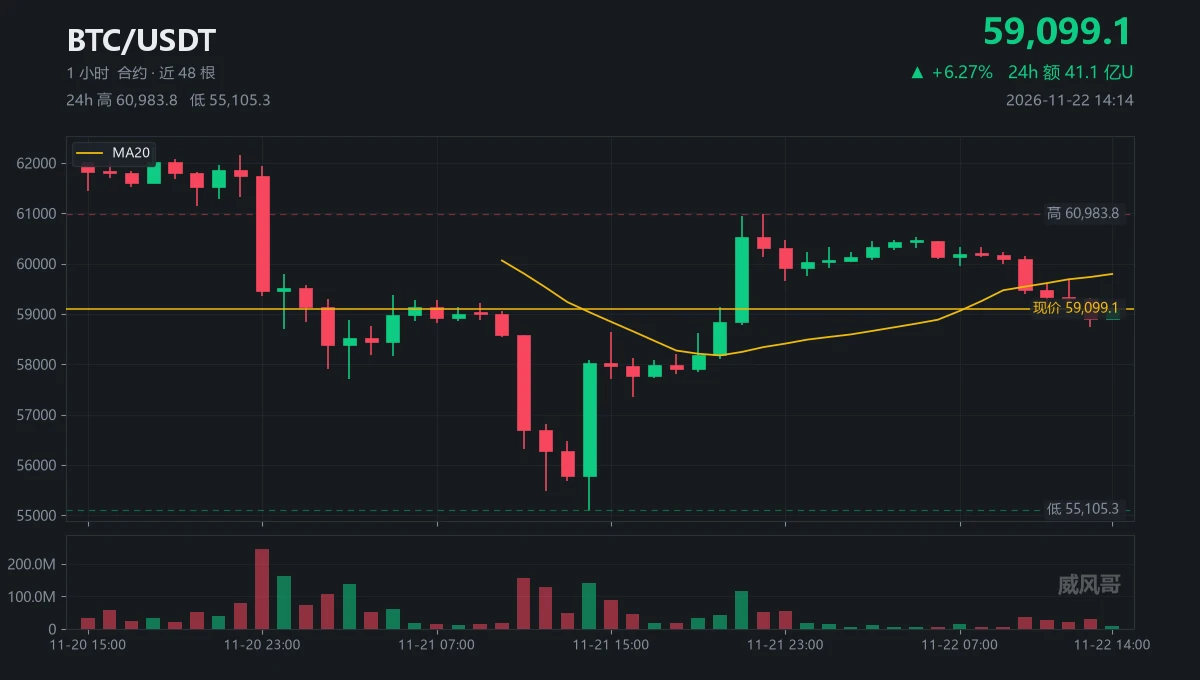
11-21 11:00: 158 million contracts pushed the price from 58572 down to 56697
14:00: 140 million contracts drove it straight down to 55105, then it closed at 58020
A 2915-point lower wick, all in one candle
Today at 10:00, the direction changed; four candles with 113 million contracts pushed the price from 60156 down to 58739
One candle moved 2915 points; four candles moved 1417 points
Both moves were downward, but the efficiency differed by more than 2x
$BTC is now at 59099, with MA20 acting as resistance at 59793
This rebound trade hasn’t been settled yet
My approach: if it can’t get above 5
post-image
BTC-0.65%
  • 2
$PARTI Bearish pressure is building... Is 0.033746 the next target? PARTI continued weakening after breaking below 0.036020. Sellers applied pressure with two consecutive strong red candles, pulling the price down from 0.036140 to 0.035400. Volume was about 1.9 times the recent average. As long as PARTI stays below 0.036020, the short-term bearish outlook remains valid. If the price climbs back above 0.036020, this view will be invalidated. Will there be another wave down? Sell and trade $PARTI
$ZEC $IDOL
post-image
PARTI-1.06%
ZEC+1.16%
IDOL-6.71%
EVAA immediately moved lower after touching $6.7, without bouncing back up 🤣
$EVAA ‌$AKE ‌$ZEC ‌
post-image
EVAA-0.42%
AKE+6.39%
ZEC+1.29%
  • 3
new market update
live-cover
LIVE2,484
BTC-0.67%
ETH-1.26%
USDC+0.01%
SOL-0.77%
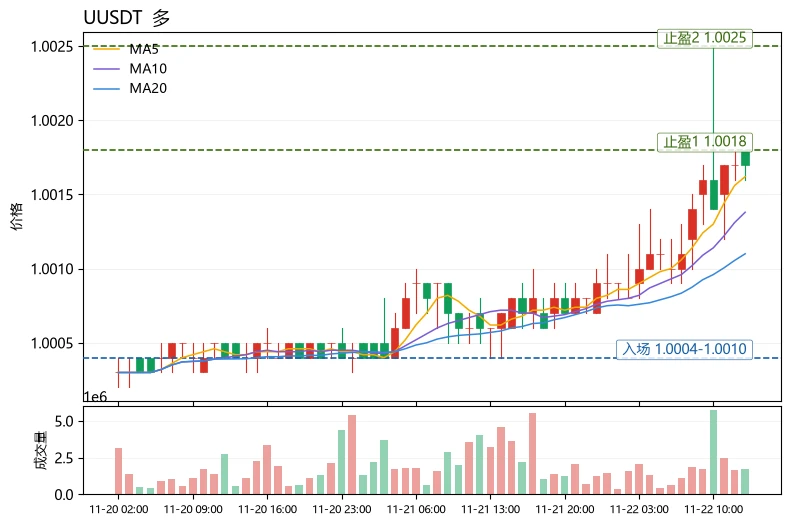
The most unusual detail in today's market is that the Fear & Greed Index is only 11 and the market is in extreme fear, while $U has formed a narrow-range bullish structure with MA5>MA20 and a positive MACD histogram within a range of only about 0.21% over 30 candles. This shows it is currently a low-volatility anchor asset, not a sentiment-driven directional trading asset; treating it as a trend trade offers very poor risk-reward.
Using moving averages to judge whether a trend is healthy, this is a perfect counterexample: MA5=1.00162 is only slightly above MA20=1.0011, with the two lines near
post-image
LINK-0.18%
TRUMP-0.95%
Peter Brandt warns Bitcoin could plunge to $31,550
Bitcoin has dropped over 50% from its peak and continues to face heavy selling pressure, trading near $61,000 after a sustained decline that began in early November.
Amid the sell-off, veteran trader Peter Brandt says the market should seriously consider whether a new bear market has already begun. Brandt arrived at this view as Bitcoin fell roughly 51% from its recent peak of around $126,200.
⚠️ Personal market analysis only. NFA — manage risk and DYOR.
Educational content, not investment advice or a recommendation to buy, sell, deposit, or w
post-image
BTC-0.67%
Are we really going to pretend this $ONDO rally can keep going? Yesterday it looked poised and ready to sprint, but now it keeps tripping over every moving average in its path. What a fleeting rally. Take profit: 0.2649 Stop loss: 0.2875 Market moves:
$SOL : Current price 69.04 - 24-hour change: +1.22%
$MAGMA : Current price 0.24406 - 24-hour change: +18.34%
post-image
ONDO-0.29%
SOL-0.77%
MAGMA-0.57%
$BTC Yesterday’s price action offers a lot to review. Shortly after the open, a sharp sell-off hit, accompanied by a brief downside wick that flushed out a number of holders at lower levels. Near midday, the price fell back to the same support zone for a second test, essentially confirming the area once again. After two rounds of selling, buyers gradually stepped in at lower levels, and the price slowly recovered its losses, ultimately forming a candlestick with a long lower wick.
From a chart perspective, signs of a short-term pause in the decline have emerged. The 57000-58000 range is curre
post-image
BTC-0.67%
Load More

Join 40 M users in our growing community

⚡️ Join 40 M users in the crypto craze discussion

💬 Engage with your favorite top creators

👍 See what interests you

Trending Topics

BTCReboundFaces60KTest

2.1M Views30.1K Discussing

BTC rebounded from around $55,300 on November 21, briefly reclaiming $60,000 before pulling back to around $59,300. The $60K level is back in focus as traders assess whether the recovery can last. Is this rebound a sign of stabilization or a short-lived recovery? Would reclaiming and holding $60K be enough, or do you need confirmation from trading volume and fund flows?

PCEAndGDPDataNextWeek

258.2K Views2.6K Discussing

GateDirectIPOPhase3ANTAllocates92100Shares

817.6K Views5K Discussing

View More