Square
Following
Hot
News
Profile

Mining_sLittleSheep

vip
Crypto Market Researcher
Market Analyst
Futures Trading Strategist
Don't be fooled by the many hundredfold coins in the crypto world; very few actually achieve tenfold gains. If you don't understand it, you won't be able to hold it. Even if you do understand it, you still might not be able to hold it. So don't listen to too many myths. Really, if you make ten times on a coin, you should be satisfied. Just listen to the stories. Follow me; here you'll find not just the crypto world, but many other interesting things as well!
2
Following
4.2k
Followers
2.2k
Liked
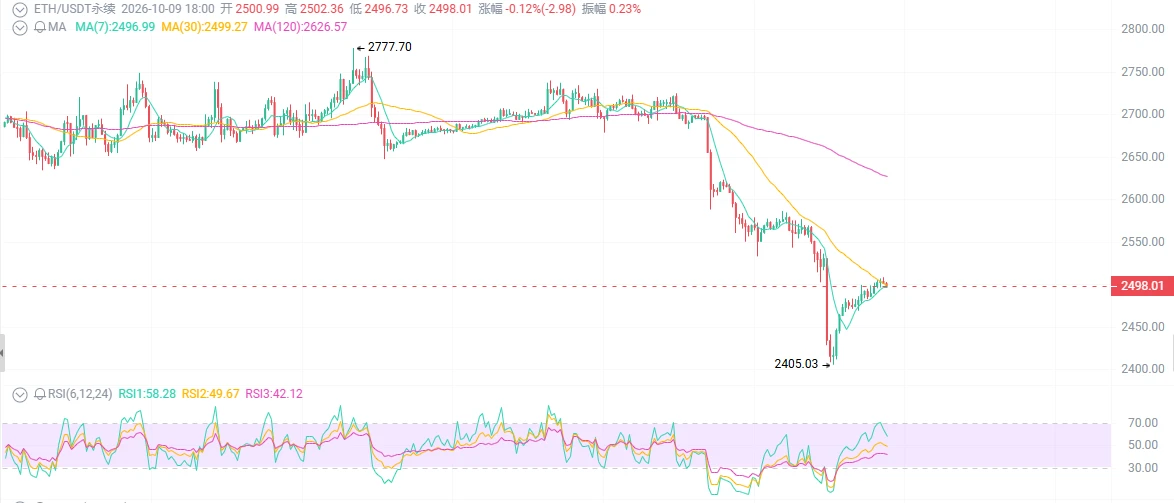
ETH at $2,500—are you buying the dip?
Yesterday it was 2560, then it plunged overnight to 2406 before recovering to 2500 today. You stare at the screen, palms sweating—is this a “golden pit,” or a grave the market makers dug for you? It has fallen 7% over the past week, underperforming BTC, while the ETF saw $200 million in outflows over six straight days. Let me tell you a harsh fact: people rushing in now are most likely providing exit liquidity for those who bought the dip at 2400.
First, the surface view: the rebound from 2406 to 2500 looks pretty strong.
Today’s low was 2406 and high was
post-image
BTC+0.06%
ETH-1.78%
SOL-3.48%
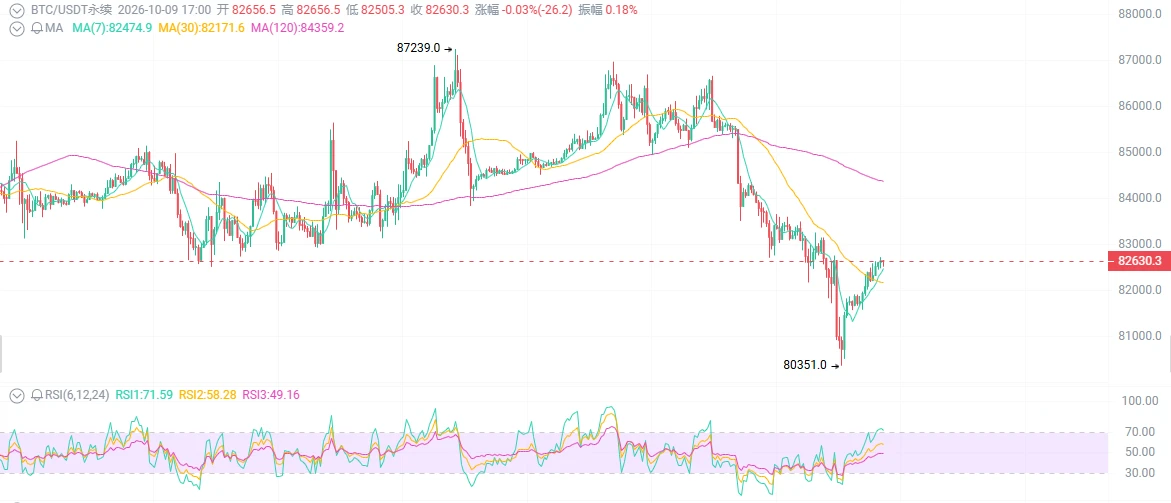
Would you dare add to your BTC position at $82,600?
The ETF saw $487 million in outflows over the week, leverage just suffered $1 billion in liquidations, the three-week winning streak was broken, and one sentence from Trump pushed oil prices down, pulling BTC sharply from $80,500 back to $82,600. Is this wave really the end of the “shakeout,” or a trap dug for you during a continued downtrend?
First, look at the surface: down 34%, but some people are still calling it a bull market.
BTC is currently at $82,600, down 3% this week, ending a three-week winning streak. It plunged to $80,500 on Thu
post-image
BTC+0.06%
ETH-1.78%
SOL-3.48%
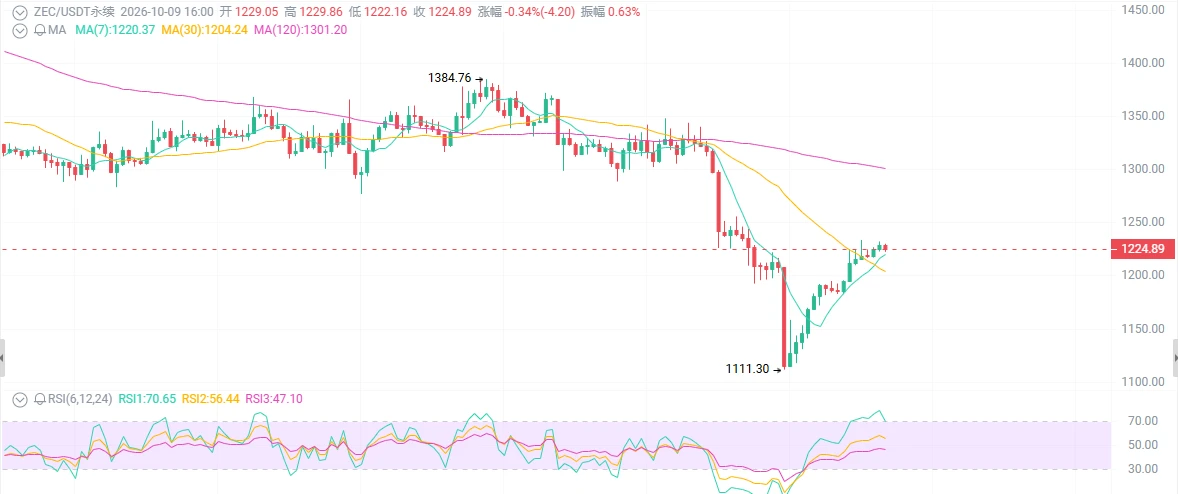
ZEC at $1220—would you dare buy the dip?
Yesterday, it crashed from 1340 to 1112 in a single day, wiping out 18%; today, it rebounded from 1115 to 1220, and everyone is shouting “V-shaped reversal, buy the dip”—but no one is telling you that 1270 has already been breached. This isn’t a reversal; it’s a rebound after a breakdown.
First, look at the surface: one bullish candle pulled it back, making it look like a bottom.
ZEC is currently around 1220, with today’s high at 1232 and low at 1115, clawing its way back from yesterday’s 1112. It’s down 15% over 7 days, while its 30-day performance has
post-image
BTC+0.06%
ETH-1.78%
ZEC+1.77%
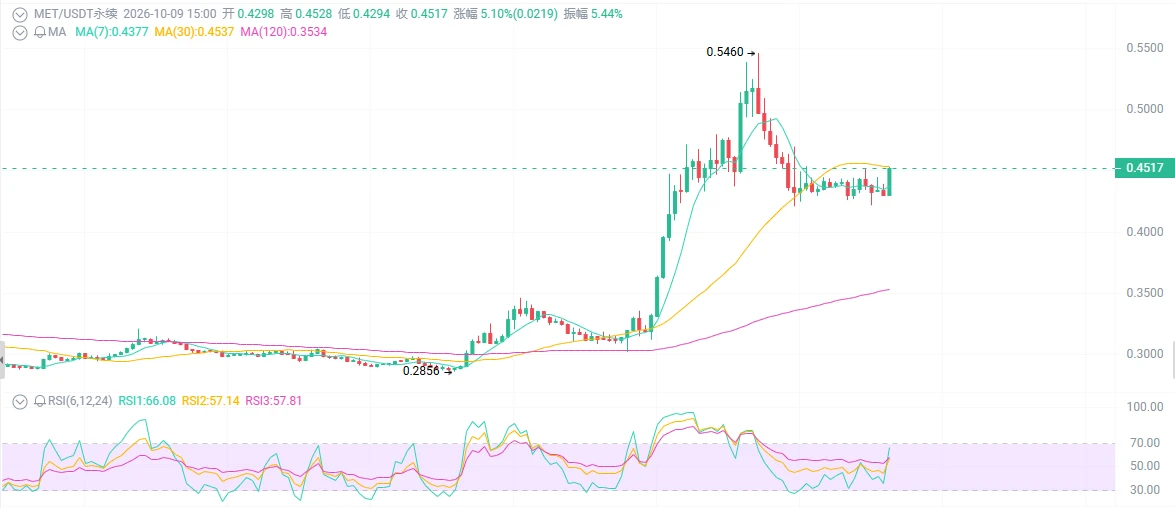
Would you buy MET at $0.45?
Yesterday it ran from $0.33 to $0.55, you chased in at $0.48, and when you opened your eyes today it was $0.45—down 2% in 24 hours. You think it’s just a minor pullback? That $0.55 wick may be the top of this impulse.
Look at the surface first: it went crazy, but has started giving back gains.
MET is up 36% over the past 7 days and has doubled over the past 30 days, with a market cap of $250 million, $34.2 million in protocol fees over 30 days, and $7 billion in trading volume—the data looks so good you want to go all in. But look at the candlesticks: October 5 at $
post-image
BTC+0.06%
ETH-1.78%
MET-13.08%
Multiple bearish blows, yet BTC only fell 5%
This is not a bad thing; it is the strongest signal
The 30-year US Treasury yield surged to 5.7%, its highest level since 2002. The 10-year yield reached 5.3%, a 24-year high. Brent crude rose above $100. Expectations of another Fed rate hike this year are heating up.
At any other time in the past, BTC would have fallen more than 10% by now.
But this time, BTC has only pulled back by about 5%.
Why? This is the question most worth asking today.
Whale “Set 10 Big Goals First” jasonleo posted a statement last night, saying that the most noteworthy thin
post-image
BTC+0.06%
ETH-1.78%
SOL-3.48%
  • 1
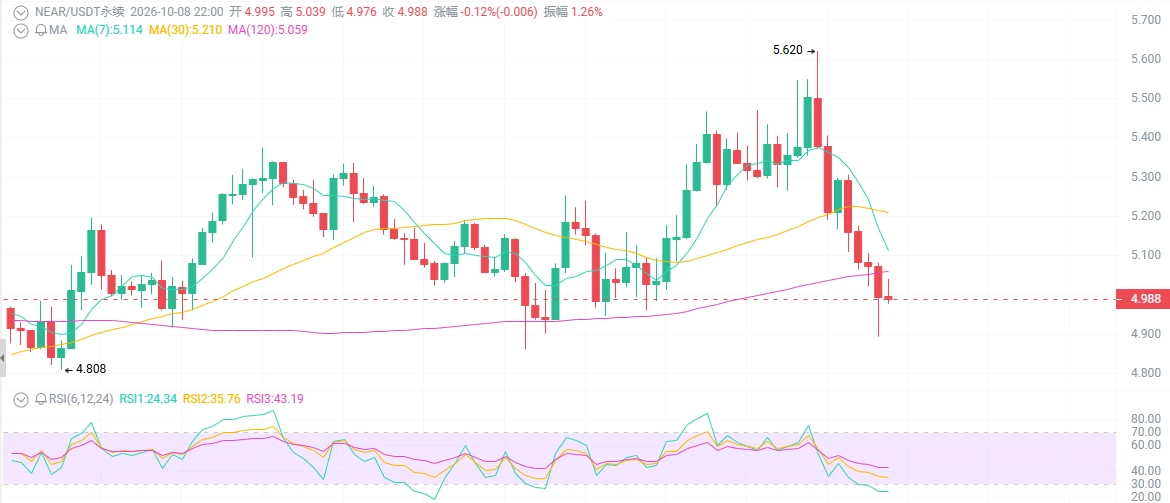
Would you dare chase NEAR at $5?
It was still at 2.3 in mid-September, then shot to 5.6 in half a month, with the doubling move just completed—but today a single wick slammed it from 5.60 back to 5.0, with a frighteningly long upper shadow. The ETF has just started trading, yet the price dropped first as a show of respect. Is this a sell-off signal of “buy the rumor, sell the news,” or a shakeout before the next major upward wave?
First, the surface view: the ETF is here, but the price flinched first.
Bitwise’s NEAR spot ETF has started trading on NYSE Arca, with a 0.75% fee, and plans to stak
post-image
BTC+0.06%
ETH-1.78%
NEAR-6.62%
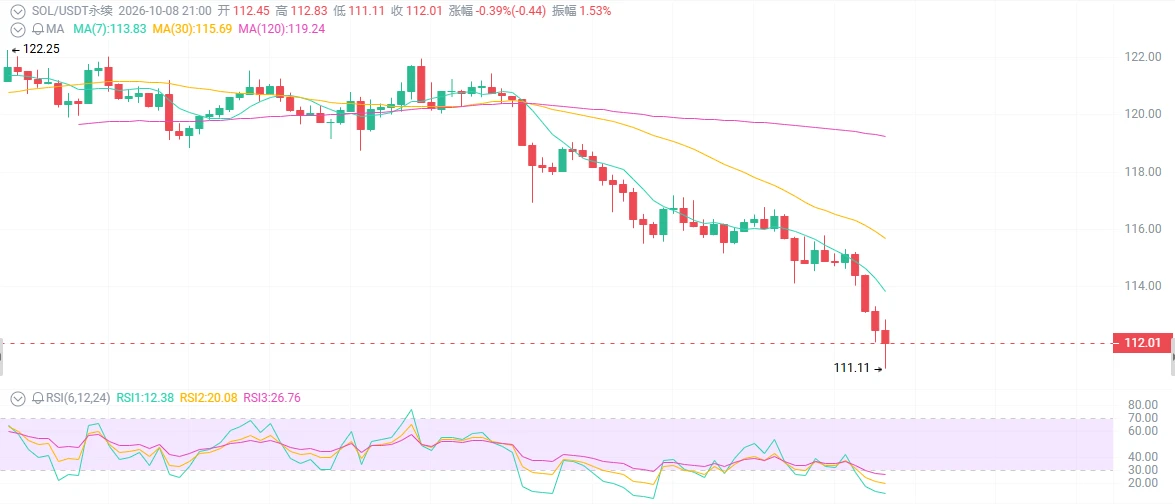
SOL at $112—are you cutting your losses?
ETF weekly inflows plunged from $188 million to $800,000, oil broke above $102, U.S. Treasury yields surged to 5.31%, and BTC crashed through 83000—SOL was kicked down from 123.8 to 112, losing 10% in two days. Is this the second leg down after the breakdown, or just a mid-bear-market pause?
First, the surface: the positive catalysts are still there, but the money is not coming in.
SOL is currently around 112, down 3-4% in 24 hours and 4% in 7 days, with a 30-day gain of only +9%. Its market cap is $66.5 billion, ranking near the top, but after falling
post-image
BTC+0.06%
ETH-1.78%
SOL-3.48%
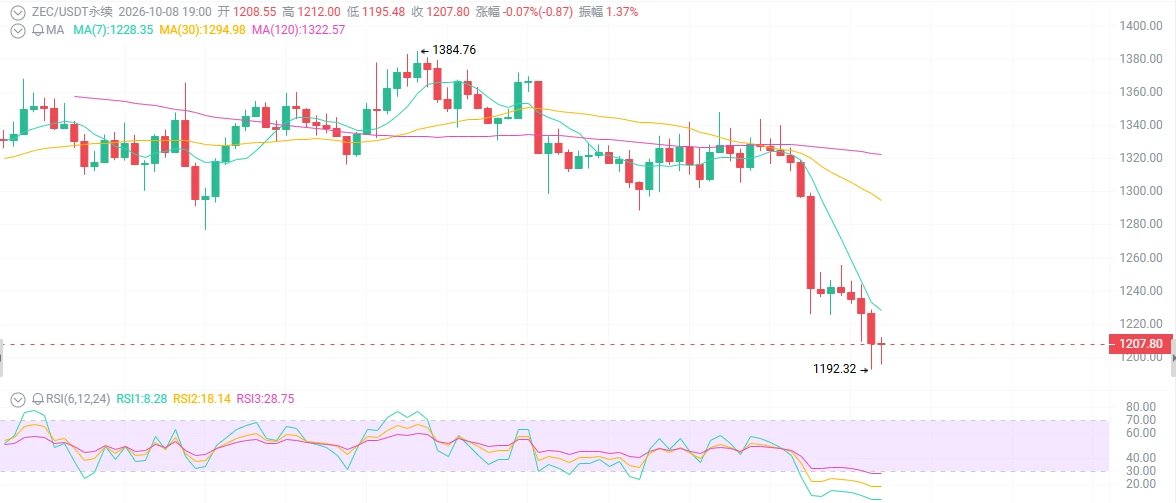
At $1,210, would you buy the dip on ZEC?
It was still at $1,310 yesterday, then got slammed straight down to $1,210 today, falling 8% in 24 hours. The $1,270 lifeline was shot through—but there has been no on-chain blowup, NU7 is still running, and the ETF channel remains open. Is this “a major player washing out positions amid macro pressure,” or has the privacy narrative cooled off early?
First, the surface picture: it fell harder than BTC, but no one can explain why.
ZEC has retraced 29% from 1,697, hitting a low of 1,199 and a high of 1,342 today before closing at 1,210. Its market cap is
post-image
BTC+0.06%
ETH-1.78%
ZEC+1.77%
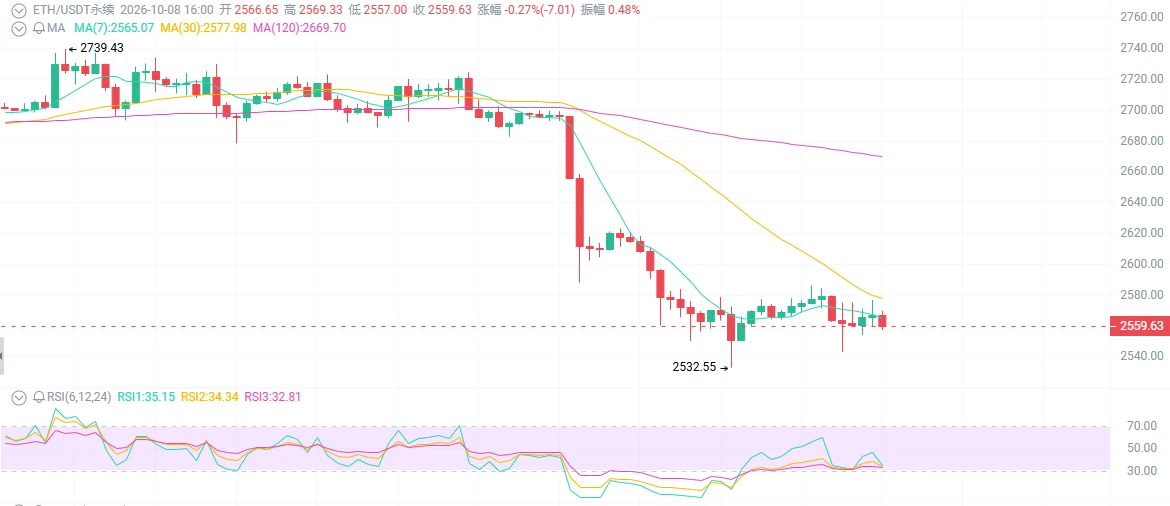
ETH at $2560—are you buying the dip?
Spot Ethereum ETFs have seen outflows for six straight days totaling $207 million, oil has broken above $102, BTC plunged through 83000 overnight, and ETH followed by retesting 2536—but just now, buyers started stepping in at 2560. Is this a “golden pit” after the breakdown, or a “false support” before the third leg down?
First, the surface: it has fallen for two days, but no one dares call the bottom.
It dropped from 2710, fell below 2650 to 2570 yesterday, and retested a lower point at 2536 today, down another 1.5%-3% over 24 hours. ETH/BTC continues to w
post-image
BTC+0.06%
ETH-1.78%
SOL-3.48%
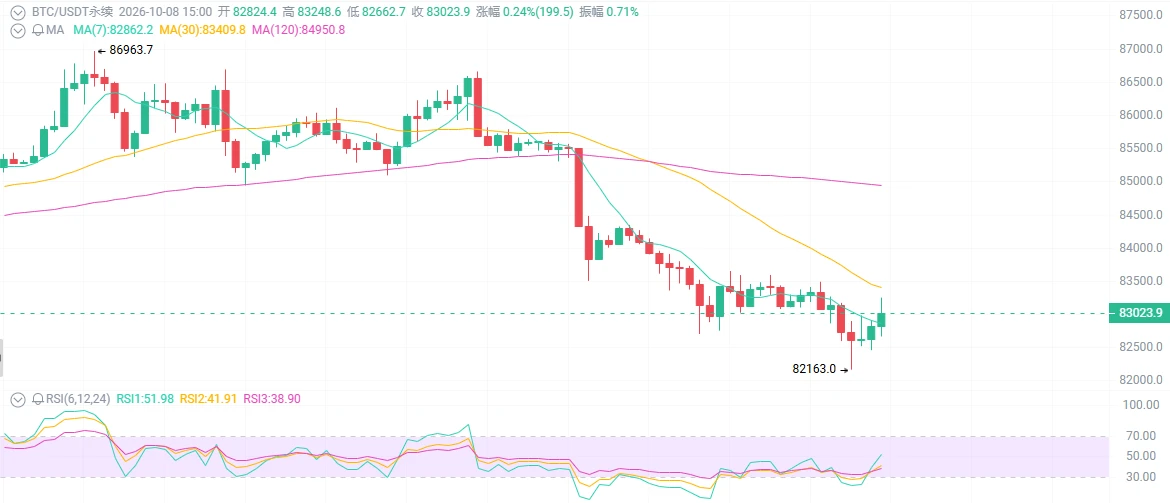
Would you cut your losses on BTC at $83,000?
Oil prices jumped to $102 overnight, the Fed minutes just put “another hike by year-end” back on the table, and another $410 million was liquidated across 92k accounts in 24 hours—BTC dropped another level from $84,000, breaking straight through $83,000. Is this the “second leg down” or the start of a crash?
First, the surface picture: two legs down in succession, leaving the bulls stunned.
It briefly fell to $82,100 in the Asian morning session, down 1.6% in 24 hours. Yesterday’s low of $83,560 failed to hold, and today it also broke through $83,00
post-image
BTC+0.06%
ETH-1.78%
SOL-3.48%
Trump, who “doesn't really want a deal,” is writing Bitcoin's best script
On October 7, Trump said in front of everyone in Texas: He “doesn't really want” a deal with Iran.
That same day, NBC News broke the news that his national security team was discussing the possibility of resuming large-scale military action against Iran in the coming weeks. Axios used even harsher wording—“large-scale bombing” of Iran's energy, infrastructure, and nuclear facilities.
Everyone's first reaction was: It's over—risk aversion. Oil prices are going crazy, and risk assets are about to collapse.
Brent crude surg
post-image
BTC+0.06%
XAU+1.50%
BZ-2.74%
The Federal Reserve and Congress are simultaneously giving the crypto market a tough challenge
Two things happened today.
The Fed’s September meeting minutes were just released: all 19 policymakers supported a rate hike, and most believed another hike would be needed before year-end. Meanwhile, the probability of a rate hike in October has plunged from 70% in September to below 20%.
On the same day, House Financial Services Committee Chairman French Hill said on Fox Business: “I hope the CLARITY Act can pass during the lame-duck session.”
On one side, the direction of rate hikes has not change
post-image
BTC+0.06%
ETH-1.78%
SOL-3.48%
  • 1
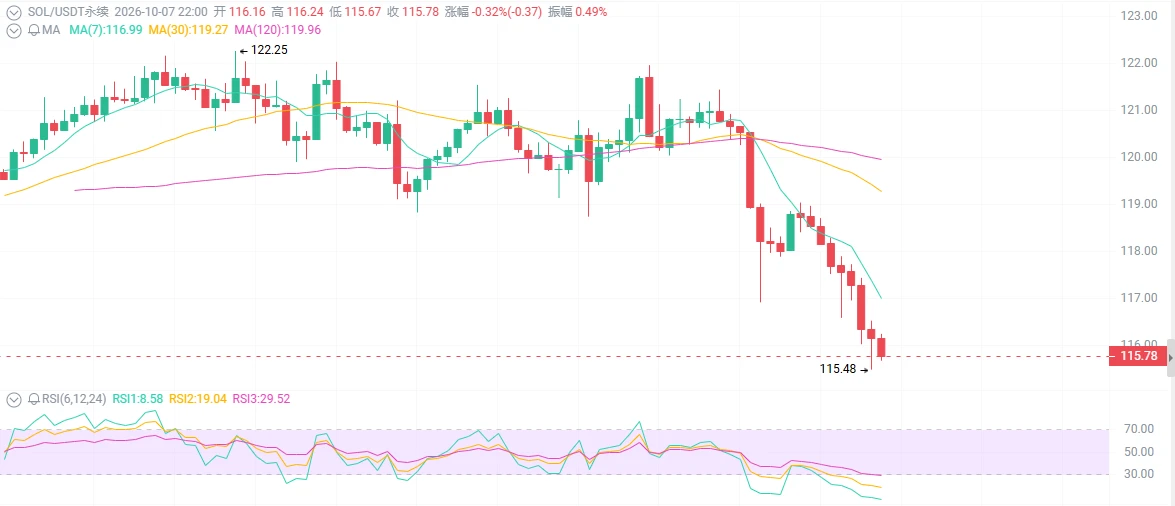
SOL at $115—are you buying the dip?
SOL plunged from 122 to 115, down 4% in 24 hours, falling alongside BTC and ETH—but just now, weekly ETF inflows plunged from $188 million to $800,000, while the Alpenglow mainnet date remains nowhere in sight. Is this a “golden pit at the bottom of the range,” or the first domino in a macro sell-off?
First, the surface: it fell, but not without reason.
It was still at 120-122 yesterday, then hit 115 today, punching through the bottom of the range from the past two weeks. The past 7 days turned from flat to negative, with a 3-4% drop today. Market cap is app
post-image
BTC+0.06%
ETH-1.78%
SOL-3.48%
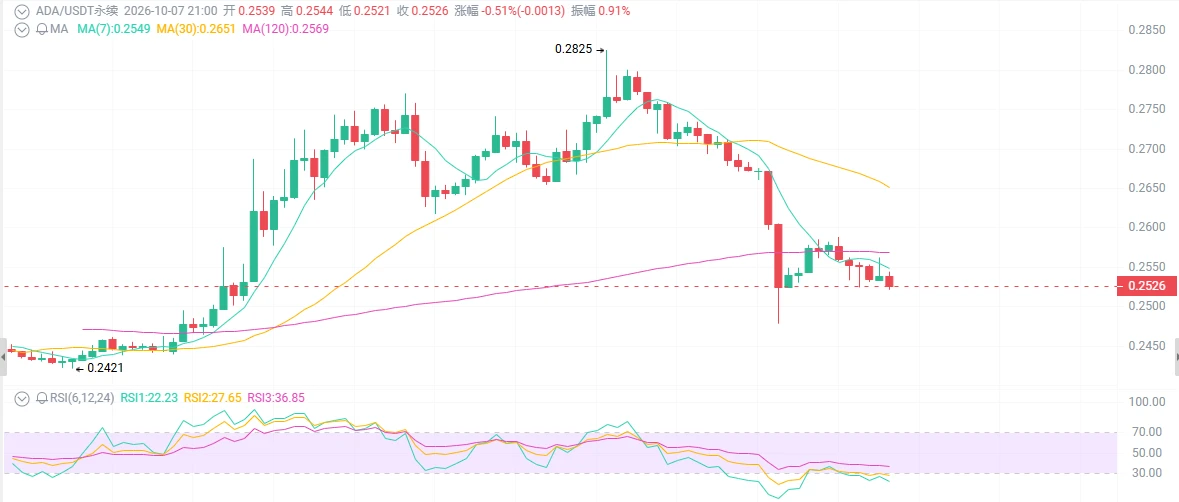
ADA at $0.25—are you bottom-fishing?
ADA crashed from 0.28 back to 0.25, down 8% in 24 hours and 70% over the year. The RealFi bullish catalyst is still intact, but the price has already knelt. Is this a shakeout or has the narrative collapsed? 0.244 is the final line of defense—don't stubbornly hold if it breaks.
First, the surface picture: the bullish catalyst had just emerged, yet the price fell, leaving retail investors confused.
On October 1, RealFi brought a bullish catalyst: stablecoins entering institutional lending at an annualized yield of 9%. On October 3, ADA climbed from 0.237 to
post-image
BTC+0.06%
ETH-1.78%
ADA-5.33%