Square
Following
Hot
News
Notifications
Profile
Share your thoughts
placeholder
Article
November 15 Gold and Silver Weekend Analysis

Gold: Prices on the weekly and daily charts are below the major moving averages, and MACD is negative, so the higher time frames remain weak. On the 4-hour/1-hour charts, price rebounded from around 3777 and is currently at 3841.68. First watch 3886; a breakout would put 3930–3975 in view. If price falls below 3777, the chart shows no lower confirmed support, so no target is assumed.

Intraday/Monday rules: At the open, first check for a gap. Assess the setup only after the first-hour high and low are confirmed. A breakout above resistance needs a
post-image
GLDX-0.40%
PAXG+0.37%
XAU+0.38%
XAG+0.47%
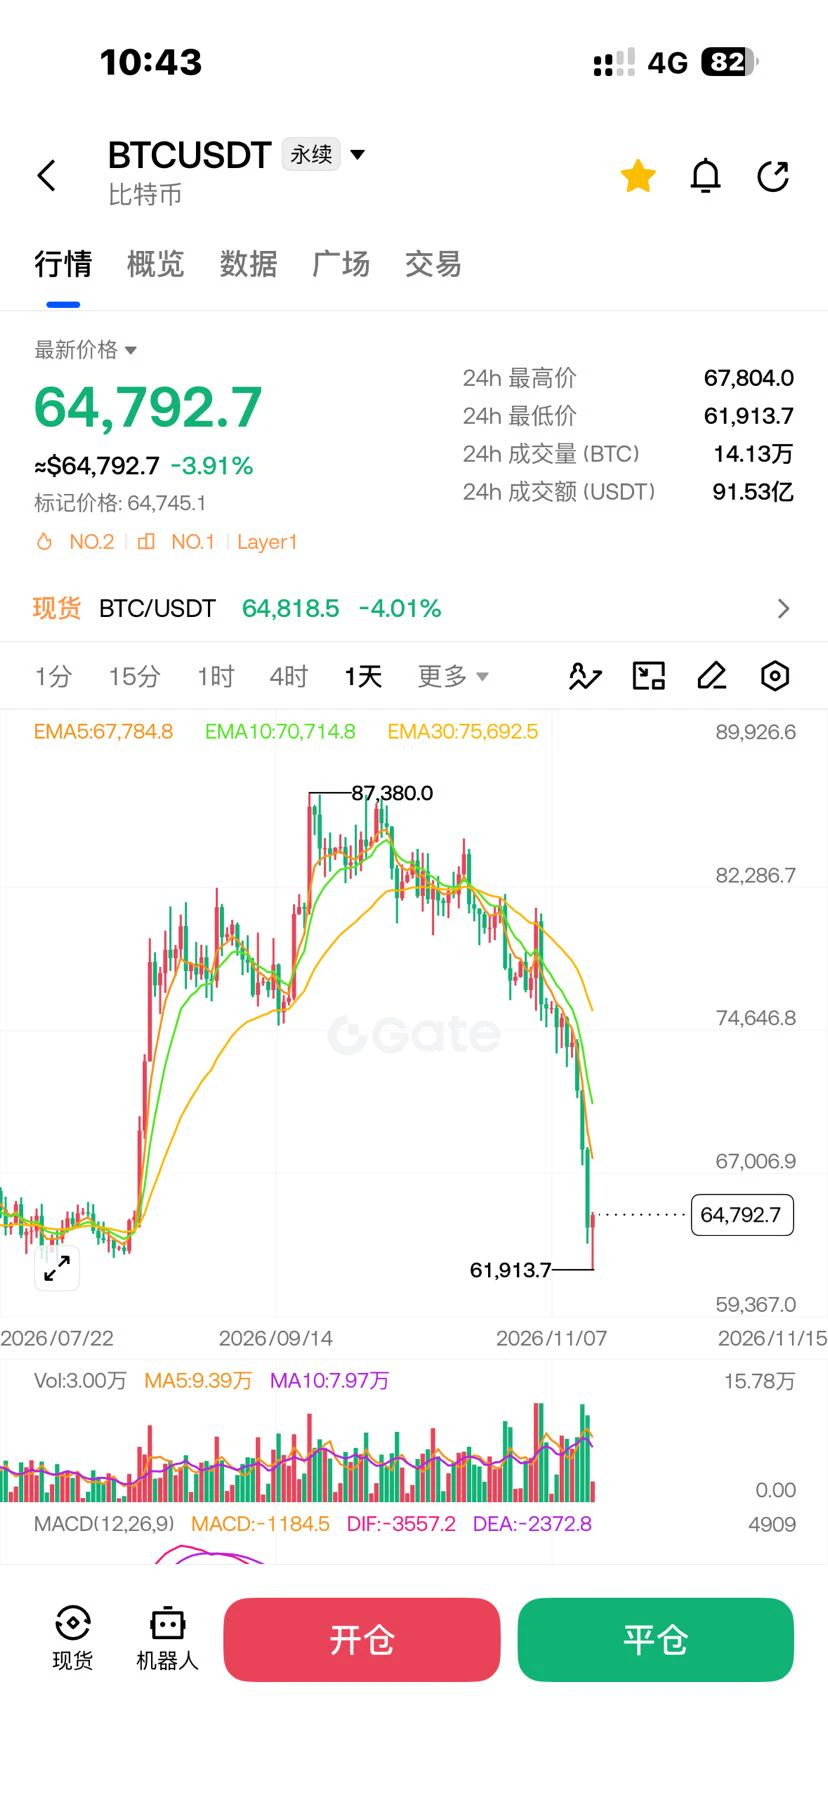
This morning it was still at 61,946
Now I look up and BTC is already back around 65,400
It has bounced about 5.6% from the low, with the 24-hour loss narrowing to around 3.2%
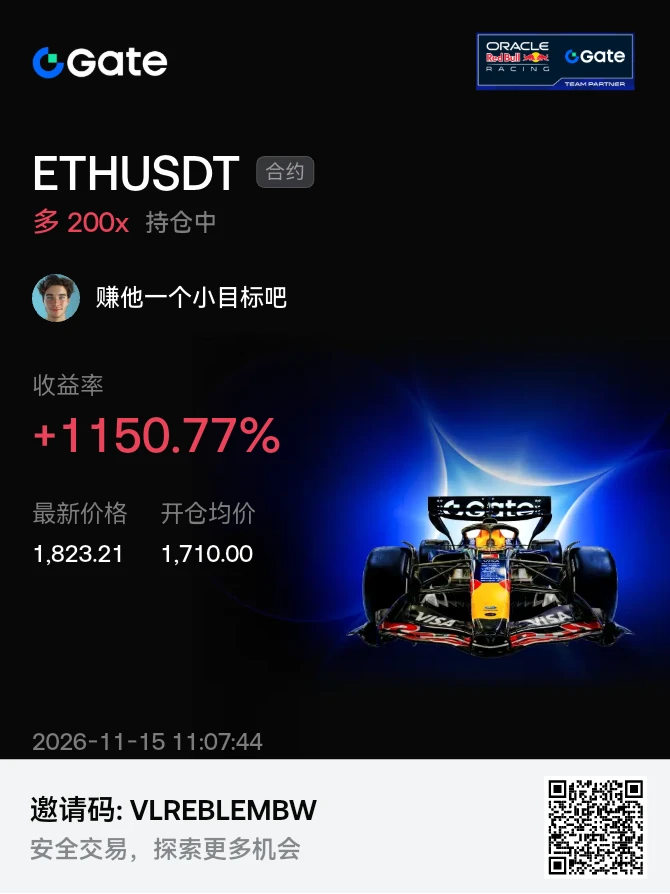
ETH bottomed around 1,709 and is now around 1,829, back above 1,800
SOL bottomed around 67.37 and is now around 71.8, also back above 70
The levels that just gave way have been reclaimed again for now
Just make a note of it; no guessing how much further it can go
post-image
ETH-1.26%
SOL-0.77%
Trenches
mihao
m
bade
b
mihao
4Cxj...pump
Market Cap
$.
Change
.
24h Vol
$.
Holders
.
Snoopy
S
bade
b
Snoopy
7mEh...47Cn
Market Cap
$.
Change
.
24h Vol
$.
Holders
.
AGT
A
bade
b
AGT
0x5d...e274
Market Cap
$.
Change
.
24h Vol
$.
Holders
.
PIEVERSE
P
bade
b
PIEVERSE
0x0e...25a9
Market Cap
$.
Change
.
24h Vol
$.
Holders
.
WASTED
W
bade
b
WASTED
GexT...pump
Market Cap
$.
Change
.
24h Vol
$.
Holders
.
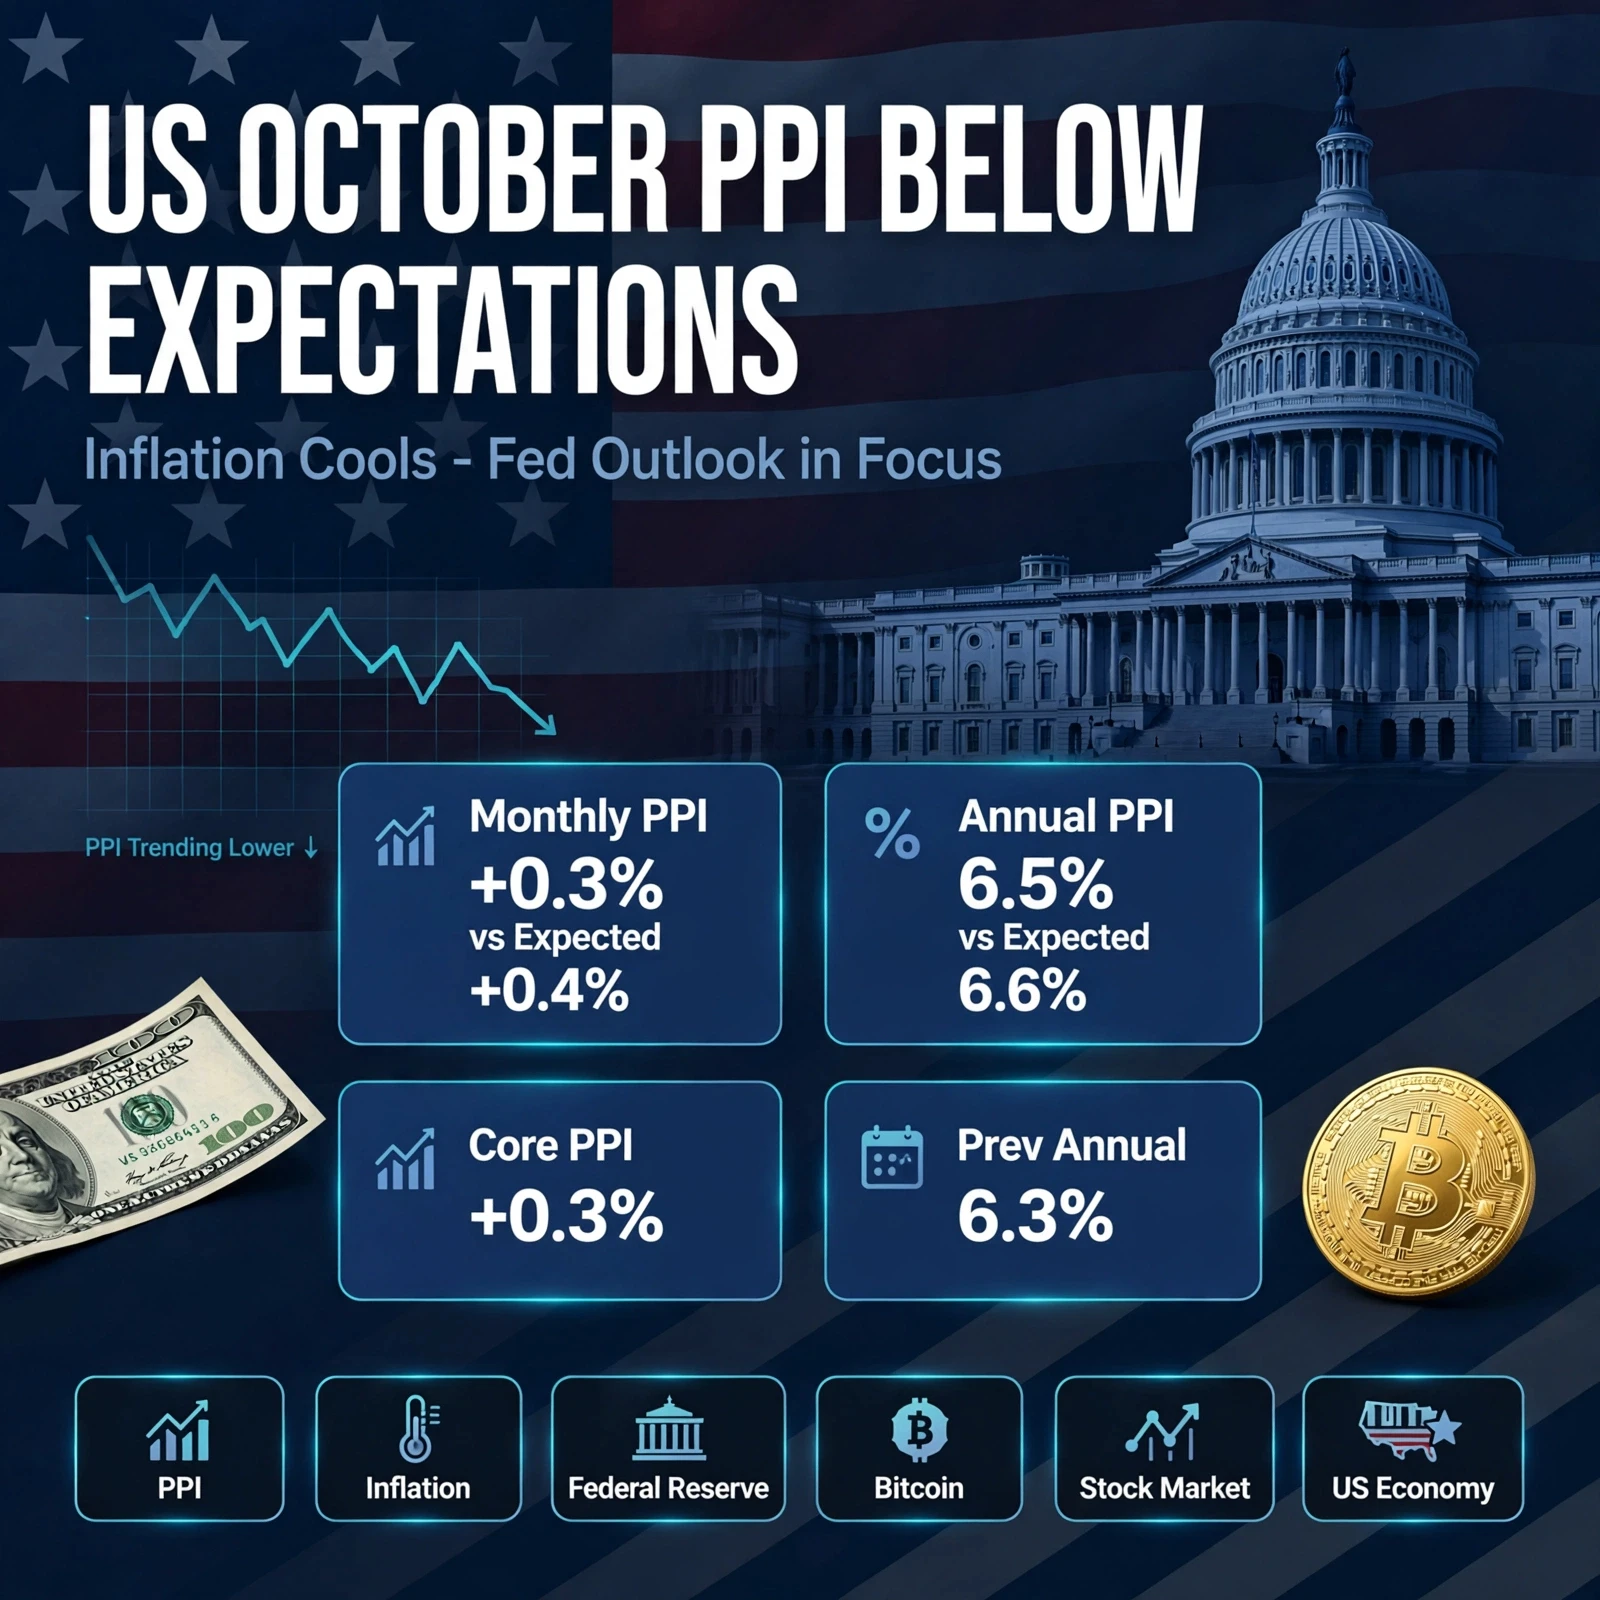
#USOctoberPPIBelowExpectations 🇺🇸📊 US October PPI Comes in Below Expectations!

The US October Producer Price Index (PPI) increased by 0.3%, below economists' expectations of 0.4%. Meanwhile, annual producer inflation reached 6.5%, up from 6.3% in September.

📉 Why Does It Matter?

Lower-than-expected producer inflation may indicate easing business costs and reduced inflationary pressure. This could influence Federal Reserve interest-rate expectations and investor sentiment.

🏦 Federal Reserve Outlook

Softer PPI data may support expectations of less restrictive monetary policy. However,
post-image
BTC-0.67%
ETH-1.26%
He controls 90% of the world’s chips
Yet can’t control one little bro
post-image
How the fuck do you niggas afford to fly first class?
Roundtrip to Australia is $26,000 lmao.
post-image
【November 15 | Sunday BTC / ETH Market Watch】
BTC is around $65,050. On the 4-hour chart, it rebounded sharply from around 62,006 and is now back above 65,000. However, the rebound is still in the recovery phase following a steep drop. Watch whether it can hold above 65,600–66,500. Support is at 64,100–63,000, with a key low at 62,000. If the rebound meets resistance and falls back below 64,000, the risk of a retest will increase.
ETH is around $1,823. On the 4-hour chart, it has rebounded from a low of 1,709, showing a clear short-term recovery, but 1,834–1,870 is a resistance zone. Support i
post-image
BTC-0.67%
ETH-1.26%
I had just put down my chopsticks after lunch and was planning to lean back in my chair for a quick nap, but one glance at the fund flow table wiped the sleepiness right away. Guys, although the market bounced a little today, don't rush to declare that the bull market is back. There's a lot more going on beneath the surface than you might think.
First, $BTC saw several hundred million in net inflows across spot and futures in just one or two hours. Looks pretty tempting, right? But scroll the table to the right, and the picture changes completely after four hours: 30-day futures net outflows
post-image
BTC-0.67%
ETH-1.26%
Me explaining to CT for the last month that #Bitcoin and $ETH were in distributive structures.
post-image
BTC-0.67%
ETH-1.26%
📈11.15 Midday Market Outlook📈

$ETH 思路:

If ETH breaks above 1821 on volume, enter long on the right side and cancel the stop-loss.

If ETH breaks below 1784 on volume, enter short on the right side and keep a stop-loss in place.

If a retest of 1740 confirms support, add one unit to the long; stop-loss below 1709.

If ETH holds above 1821 on the hourly chart, look toward 1861–1910.

Watch 1861 for a one-unit short; set a stop-loss if ETH breaks above 1910.

Left-side wick order: long at 1680, stop-loss below 1648.

Resistance above: 1821–1861–1910
Support below: 1784–1740–1709

If
ETH-1.23%
NVDA-1.92%
#Dr.Han牛津辩论社演讲 Starting Alone Sounds Brave, But Staying Alive Is Where the Real Test Begins

Most startup playbooks preach the exact same formula: secure venture funding early, assemble a big team fast, and scale at all costs. Yet when Gate Founder and CEO Dr. Lin Han took the historic podium at the Oxford Union for his keynote titled “Start Alone,” he dismantled that conventional wisdom using 13 years of unfiltered personal history. Instead of celebrating effortless breakthroughs, he laid bare a path forged through early trading losses on online forums, zero external venture capital, and sur
GT-2.41%
AKE+6.07%
XAUUSD+0.00%
XAGUSD+0.00%
AMD-8.76%
What should I do now?
Urgent! Urgent! Urgent!
Was bearish on the local range, but how quickly it's unfolding without any meaningful bounce is brutal.

Genuinely hope everyone is okay, fam. If you're in a bad place, remind yourself:

a) The lower we go, the bigger the opportunity.
b) There's more to life than money and crypto. Focus on the other good things and take a step away.
c) If you are in a dark place, reach out to your loved ones.
post-image
  • 2
$WHEAT ‌
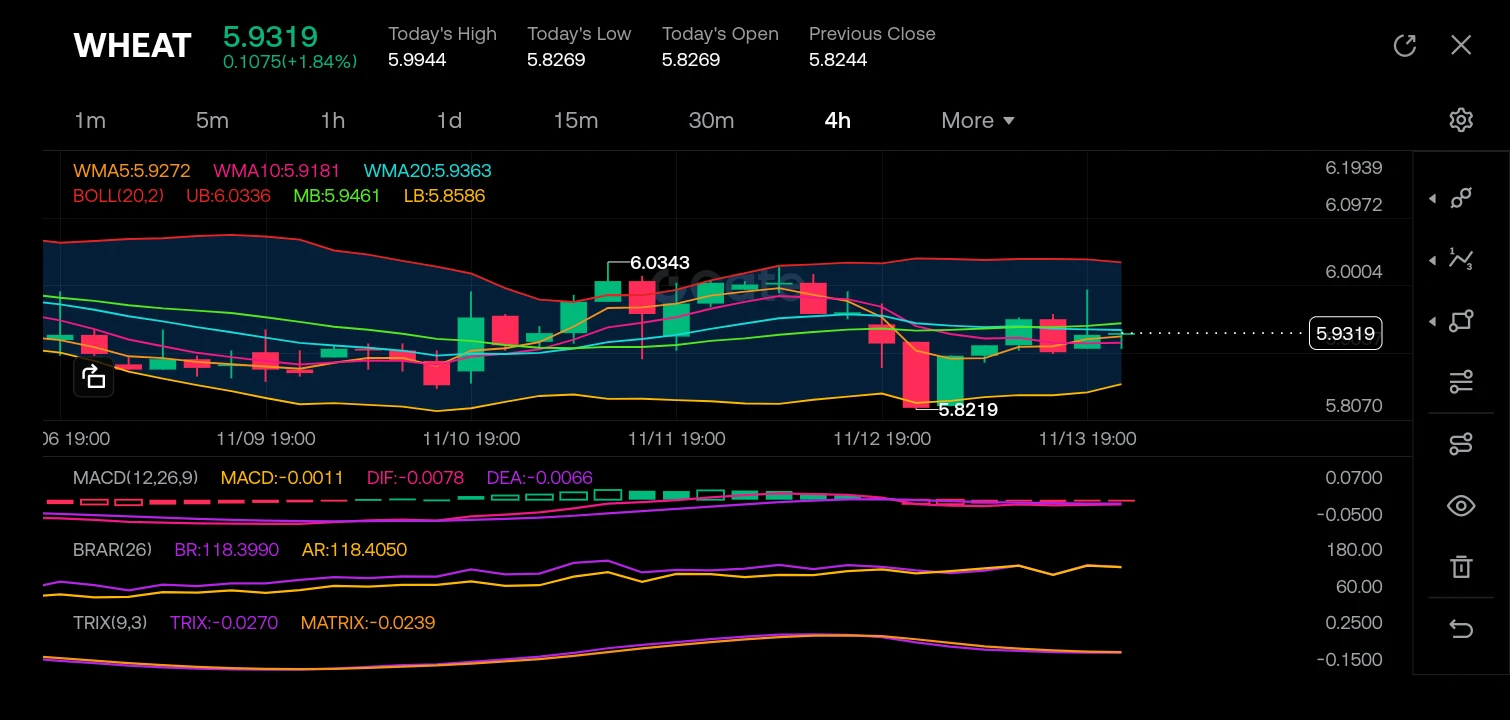
WHEAT, the market has transitioned out of its sharp corrective dip toward the $5.8219 swing low into a consolidation and recovery phase, currently stabilizing near the $5.9319 mark. Moving averages (WMA 5, 10, and 20) are beginning to compress and converge tightly around the current price level, indicating a compression of momentum before the next directional break. Meanwhile, the MACD histogram shows a transition from deep negative expansion to shallow, flat momentum bars, reflecting a temporary exhaustion of selling pressure and the formation of a local base.

The chart highlights
post-image
WHEAT+0.00%
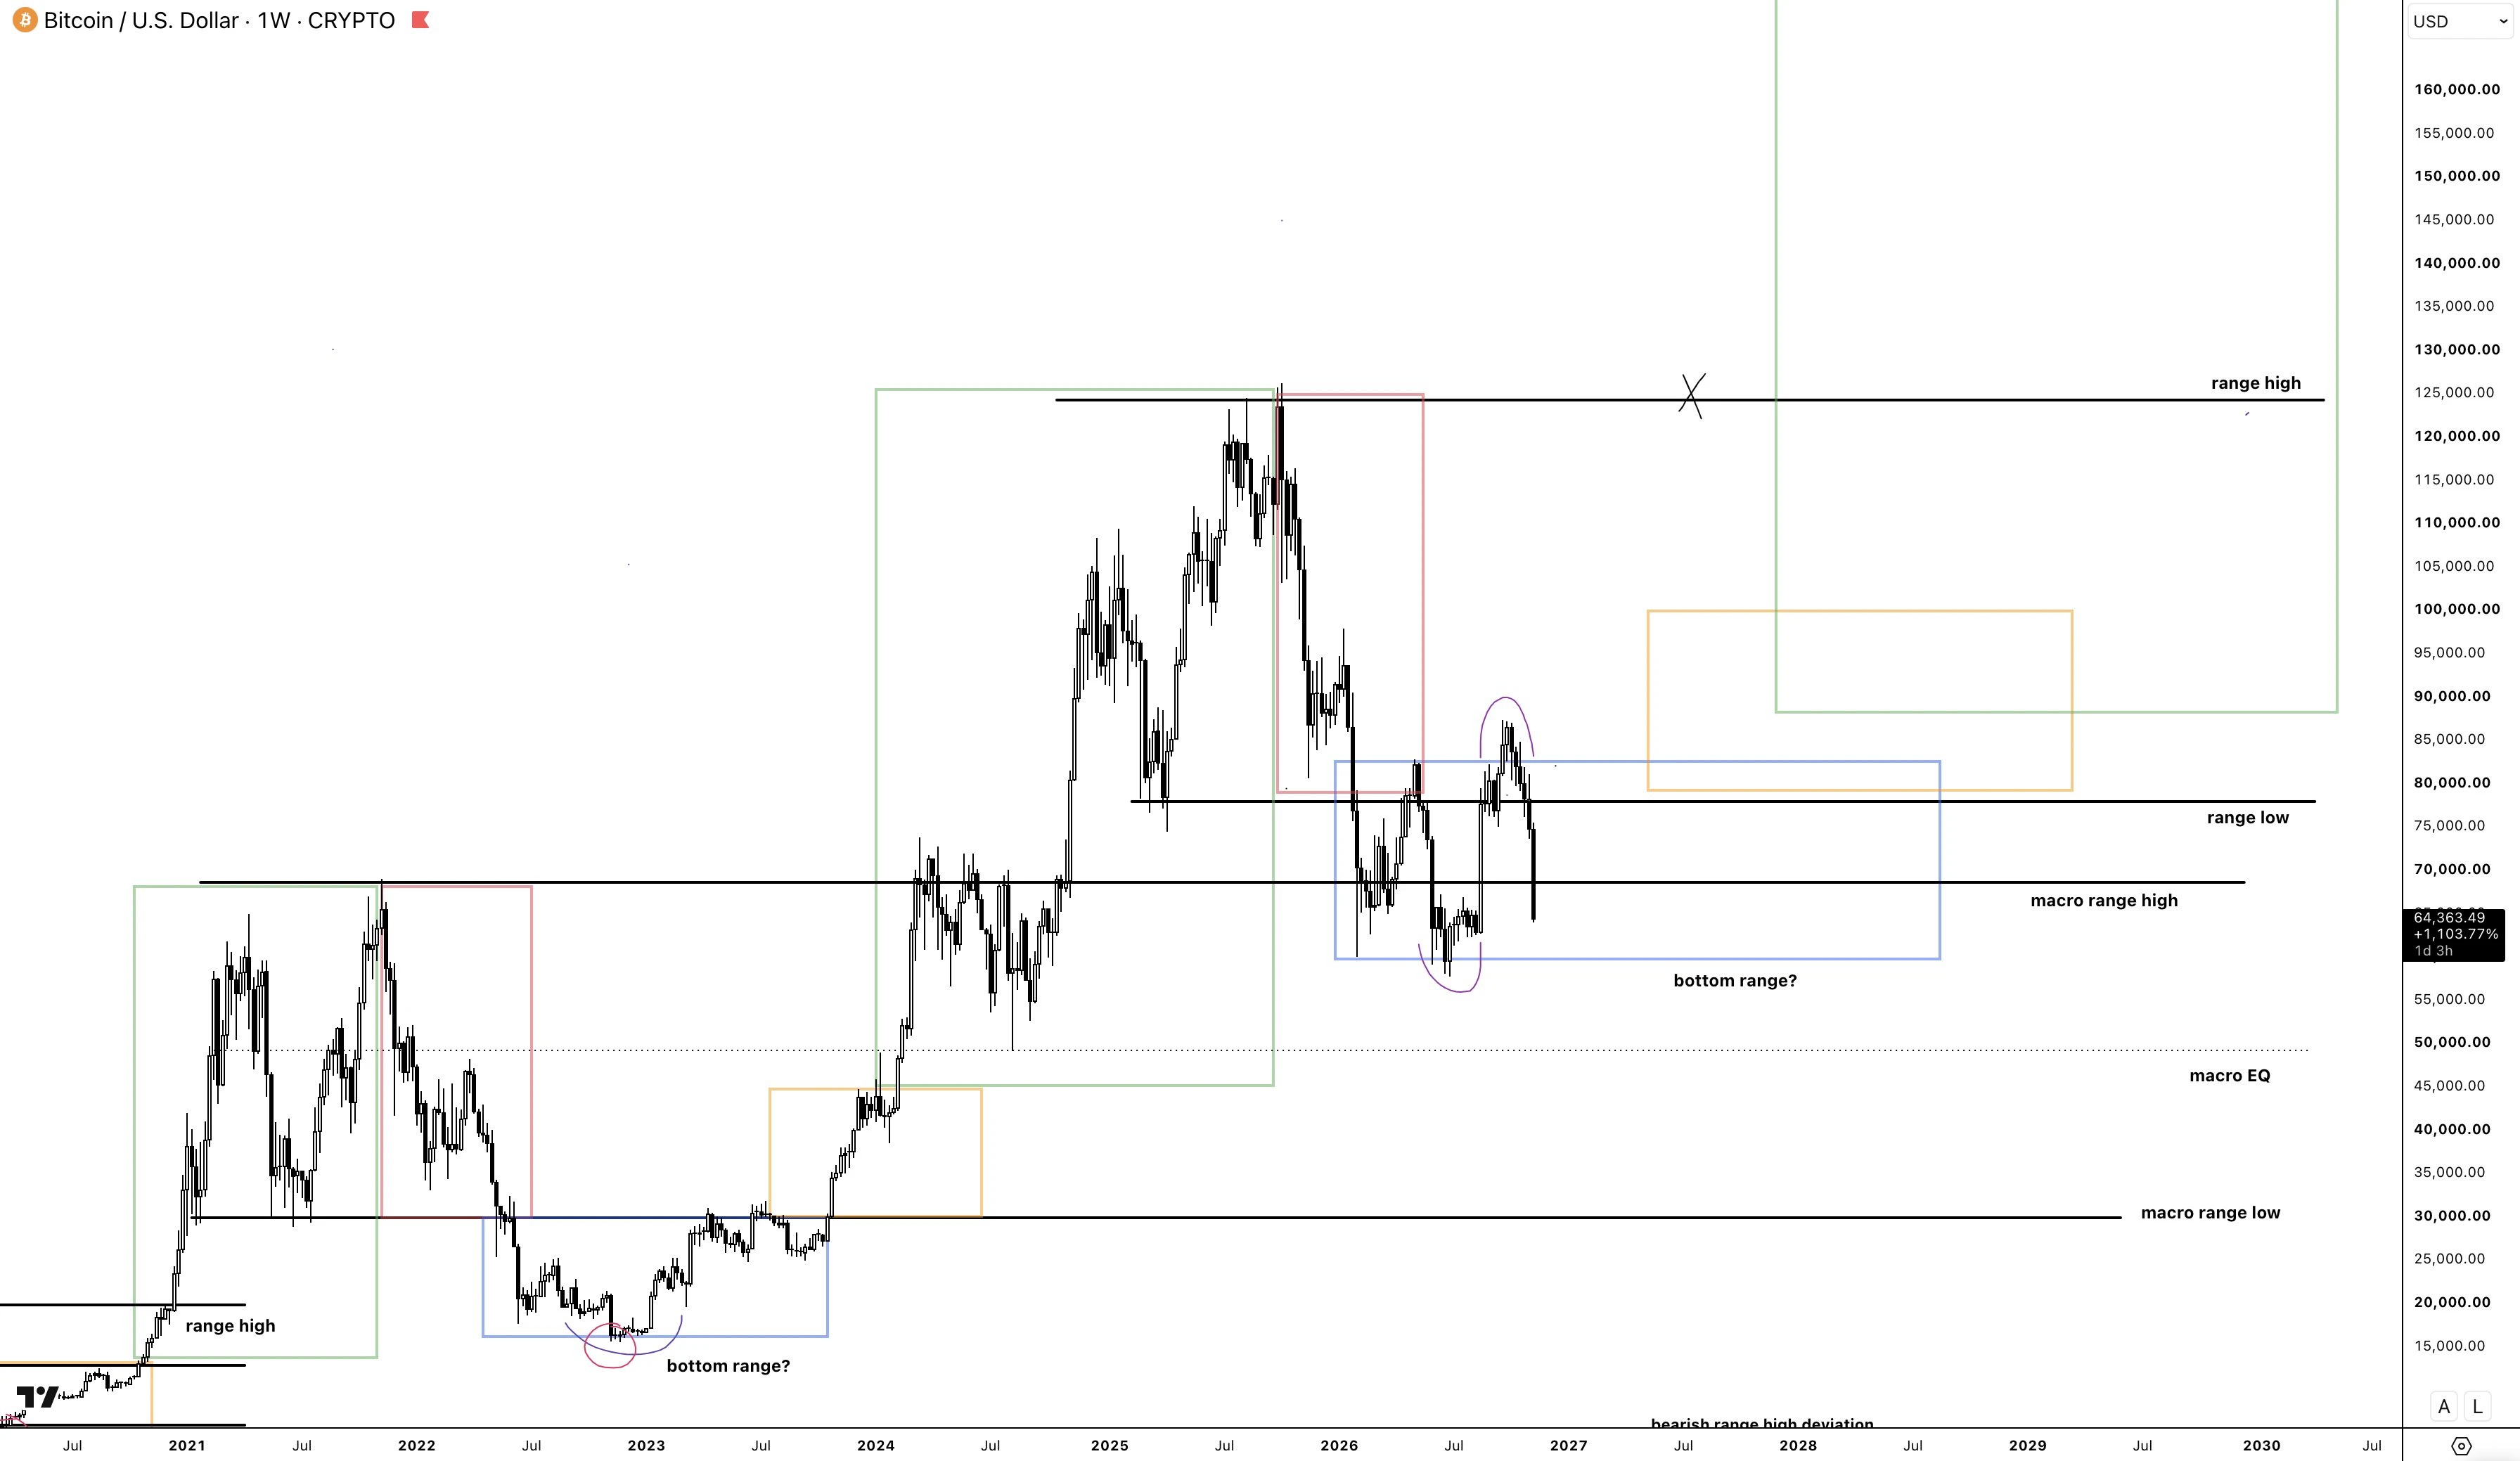
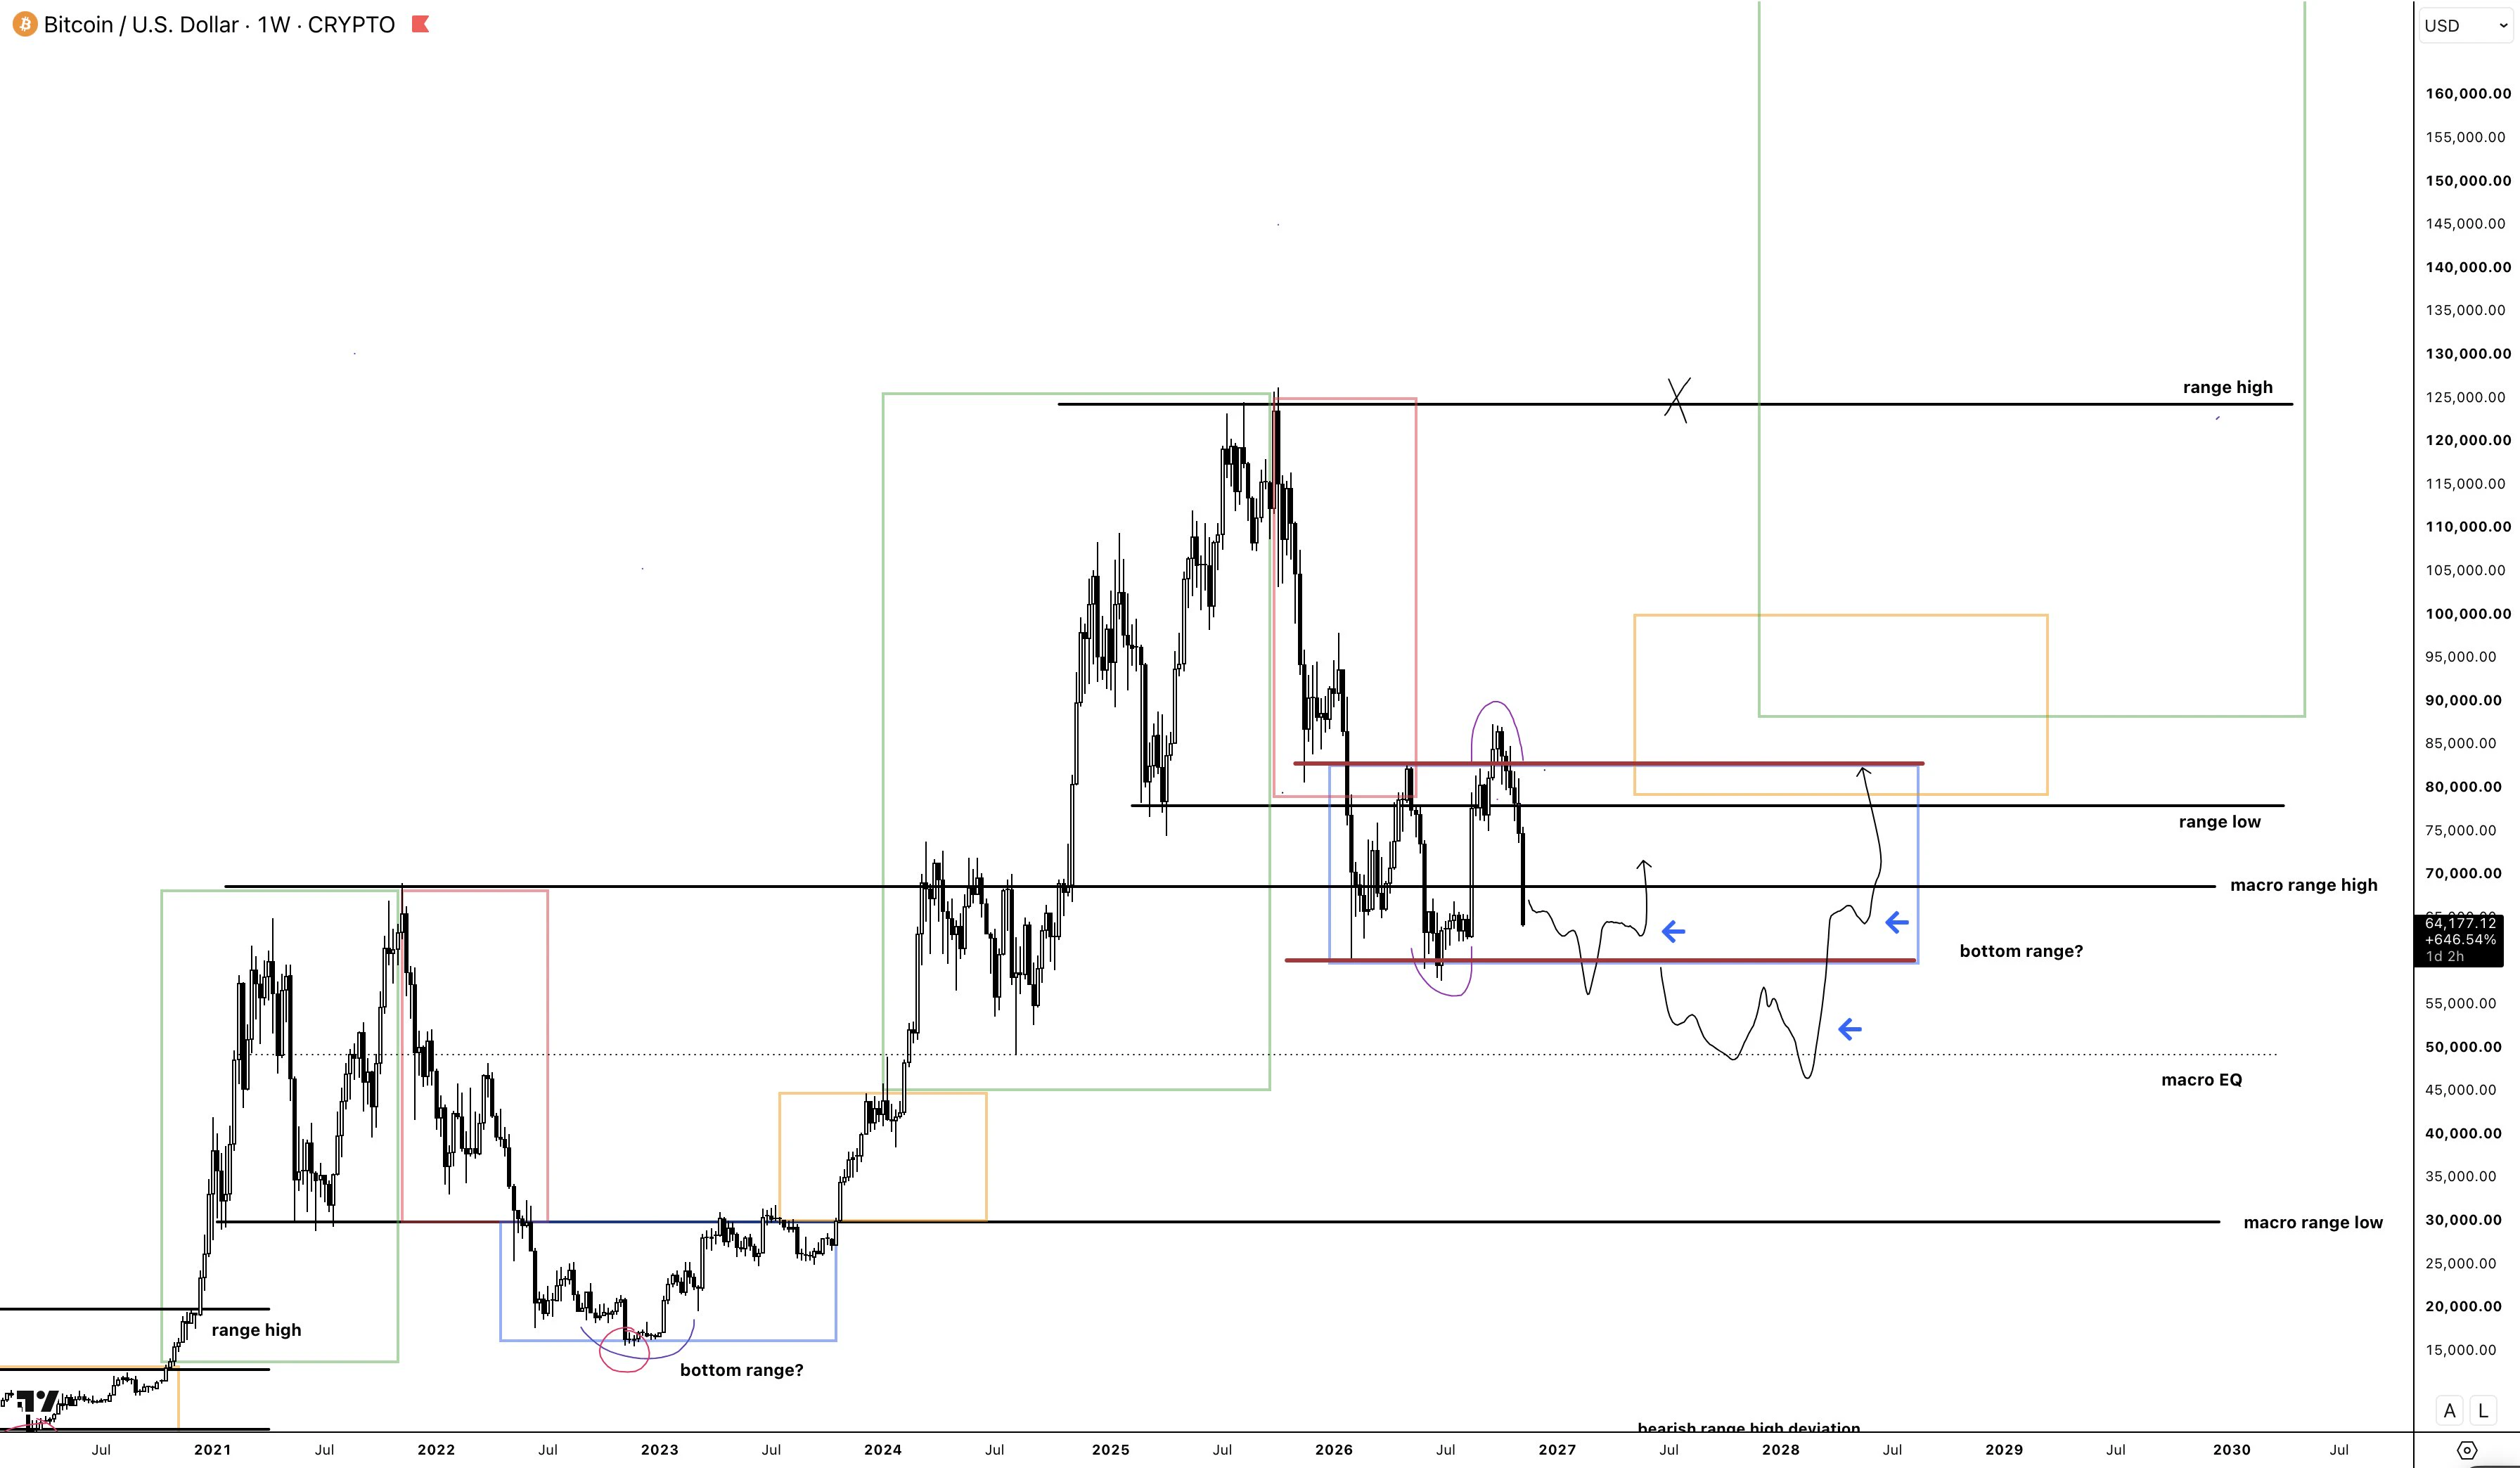
There we are. What a hell of a drop.

Patience has been paying off, but gonna hold off for a bit longer.

→ Macro:
- Still think we're forming a bottom stage.
- We're back at the zone where we took a lot of swings late summer.

→ Medium time frame:
- Not buying yet.
- Want to see a setup form first.
- In the end, it's simply a range.

Last June, our entry was the range low deviation, and I want a similar setup again.

But the reality is, while everyone screams and acts like they know how this will unfold, they don't.

In any case, the cleanest entries would come IF we at least take the lows of
post-image
  • 2
I placed a small order, and then this happened
post-image
BTC rebounded at a major gap on the daily chart, a higher-timeframe level. However, the market is unlikely to reverse and rally sharply right away. The key is whether the market gets positive catalysts, including improved sentiment. Next, watch whether it can continue breaking below the low. If it can't, the market will most likely enter a range and start moving sideways while accumulating BTC
post-image
BTC-0.67%
Where’s the bottom? 🥺 Stop falling already—if you drop any further, the crypto world will lose a happy little Jinbao. 😢 $ETH
ETH-1.26%
Market Analysis
live-cover
LIVE3,773
Accurate Forecast: Bitcoin Enters a Consolidation Phase, What Key Levels to Watch in the Short Term?
live-cover
LIVE1,478
Two ETH short trades, banking a total of 127 points!

The first trade gained 88.29 points, and the second 39.18 points. I didn’t deliberately try to capture the maximum move on every trade. I entered when the position was right and took profit when the market reached the expected area.

Although BTC and ETH are correlated, you can’t simply apply BTC’s rhythm to ETH. Each coin has its own volatility and key levels, so entries, stop-losses, and take-profits need to be assessed separately.

The longer you trade, the more you realize that trading isn’t about charging in aggressively in one directi
BTC-0.65%
ETH-1.23%
Load More

Join 40 M users in our growing community

⚡️ Join 40 M users in the crypto craze discussion

💬 Engage with your favorite top creators

👍 See what interests you

Trending Topics

GateIPOAccessAnthropic

337.8K Views2.6K Discussing

Gate IPO Access Phase 3 features Anthropic (ANT), with USDT subscription interest starting from 100 USDT. Successful allocations will be delivered as real shares to Gate Stock Accounts. Indicative price: $70–$78/share Subscription: Nov 12–17 (UTC+8) Allocation is not guaranteed. Please manage risk accordingly.

Dr.HanOxfordUnionSpeech

150.3K Views510 Discussing

USOctoberPPIBelowExpectations

475.4K Views1.3K Discussing

View More