Square
Following
Hot
News
Notifications
Profile
Share your thoughts
placeholder
Article
BITCOIN Falls below 5,7000k
live-cover
LIVE3,677
BTC-0.67%
This time, U.S. stocks, gold, and BTC all fell together, which really makes it easy to think of historical turning points.
The first scenario: 2020. After the drop, the Fed stepped in with liquidity, and the market quickly climbed back up.
The second: 2022. Keep hanging on, wait for inflation to come down and policy to shift, and recover gradually.
The third, and worst, was 2000. The bubble really burst. Even Fed rate cuts didn’t help, and it could take many years to recover.
What’s scariest now isn’t the drop—it’s figuring out what kind of cycle turning point this is.
post-image
GLDX-0.40%
PAXG+0.37%
XAU+0.38%
BTC-0.67%
  • 2
Trenches
IDOL
I
bade
b
IDOL
0x3b...ab07
Market Cap
$.
Change
.
24h Vol
$.
Holders
.
JAGENT
J
bade
b
JAGENT
0x8e...ae15
Market Cap
$.
Change
.
24h Vol
$.
Holders
.
PIEVERSE
P
bade
b
PIEVERSE
0x0e...25a9
Market Cap
$.
Change
.
24h Vol
$.
Holders
.
mihao
m
bade
b
mihao
4Cxj...pump
Market Cap
$.
Change
.
24h Vol
$
Holders
.
FIONA
F
bade
b
FIONA
B34n...pump
Market Cap
$.
Change
.
24h Vol
$.
Holders
.
If you keep calling the short-haired girl a tomboy, I’ll start calling the long-haired guy a fake young woman.
post-image
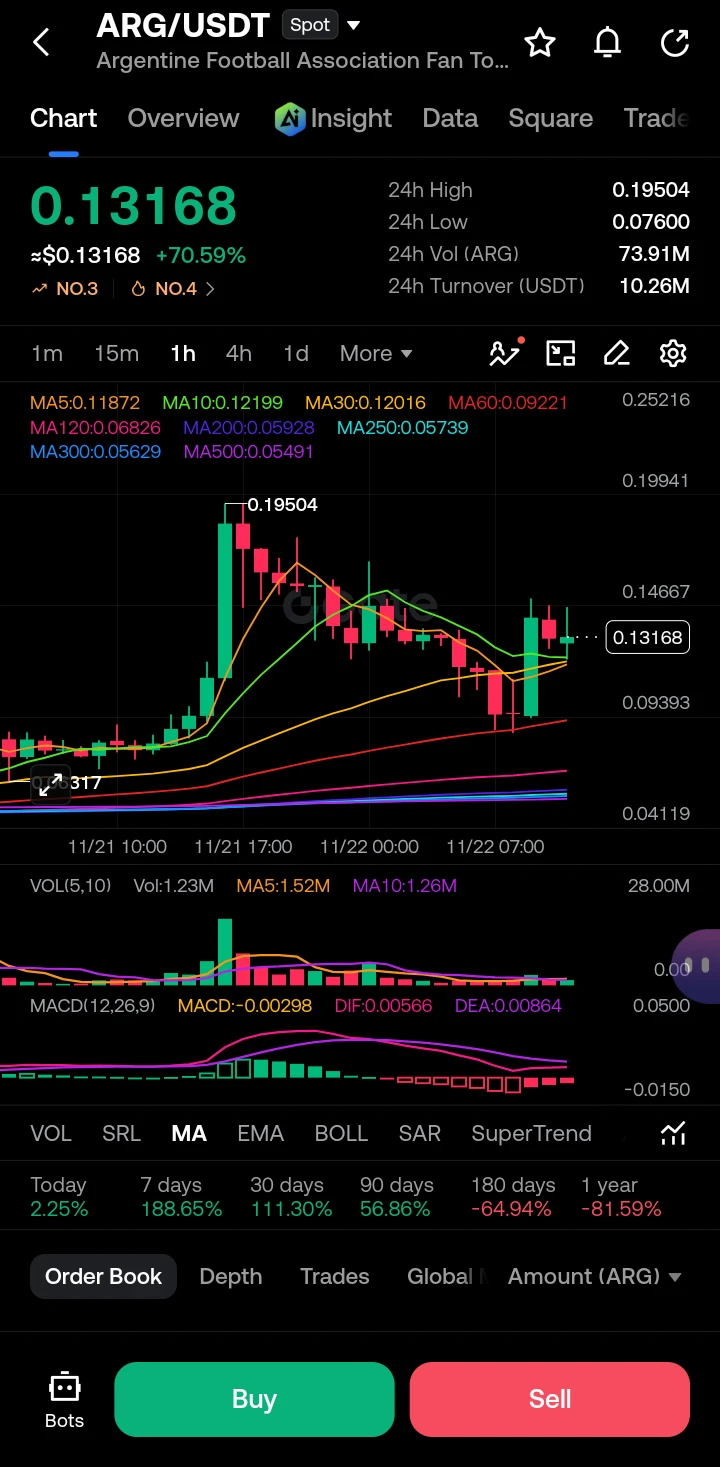
The Liquidity Vacuum: Decoding ARG’s 70% Parabolic Expansion and the Inevitable Mean Reversion
$ARG ‌
The ARG/USDT market is currently exhibiting textbook parabolic price action, characterized by a massive +70.59% intraday surge that has violently repriced the asset from a low of 0.076 to a peak of 0.195. This is not a normal trend; it is a liquidity-driven expansion. When an asset moves this far this fast, traditional oscillators like the RSI become broken (overbought for extended periods), while whale accumulation/distribution dictates the true structural ceiling. We are currently witnessin
post-image
ARG-2.15%
  • 3
Keep a close eye on the spot gainers list. These hot assets are worth watching, with the following target prices for the next phase:
$AIGENSYN target: 0.020 $NIGHT target: 0.050 $DODO target: 0.0450 ORCA target: 1.50 ETHFI target: 0.0550 COOKIE target: 0.01 DASH target: 47
My approach is simple: pick the spot coin you’re most bullish on, buy it, then avoid trading too frequently. Hold patiently until it reaches your take-profit target, and the gains will naturally materialize.
This does not constitute financial advice.
post-image
AIGENSYN+1.18%
NIGHT-3.10%
DODO+11.43%
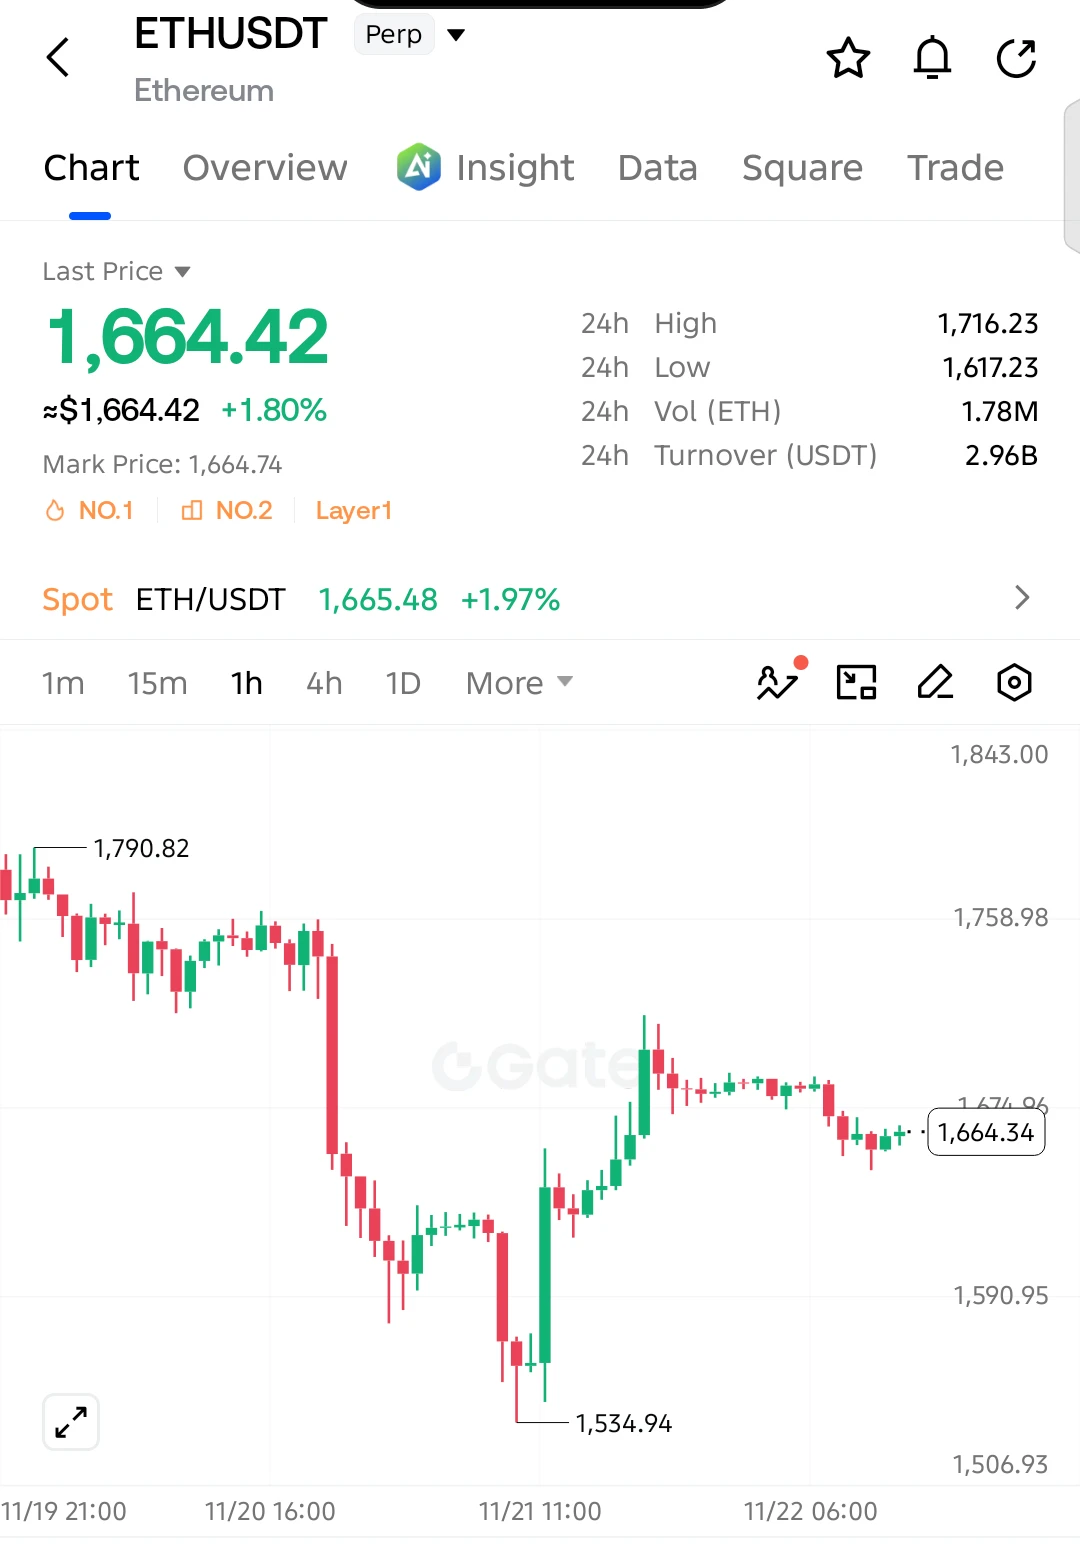
$ETH RECOVERS FROM $1,535 — IS $1,715 THE NEXT TARGET?

$ETH is up 1.80% after a strong rebound from 1,534.94, but buyers are now facing resistance near 1,675.

Current Price: 1,664.42
Key Resistance: 1,675–1,715
Immediate Support: 1,640–1,650
Next Bullish Target: 1,715

Ethereum's recovery shows renewed buying interest, but the broader structure remains under pressure. A confirmed breakout above 1,675 could open the door toward 1,715, while losing 1,640 would put the recovery at risk.
post-image
ETH-1.26%
MARKET OVERVIEW
live-cover
LIVE1,275
BTC-0.67%
I’m Vietnamese. I’d like to ask my Chinese friends: Which Vietnamese dish made the deepest impression on you? Please briefly introduce it so we can all learn about it together!
post-image
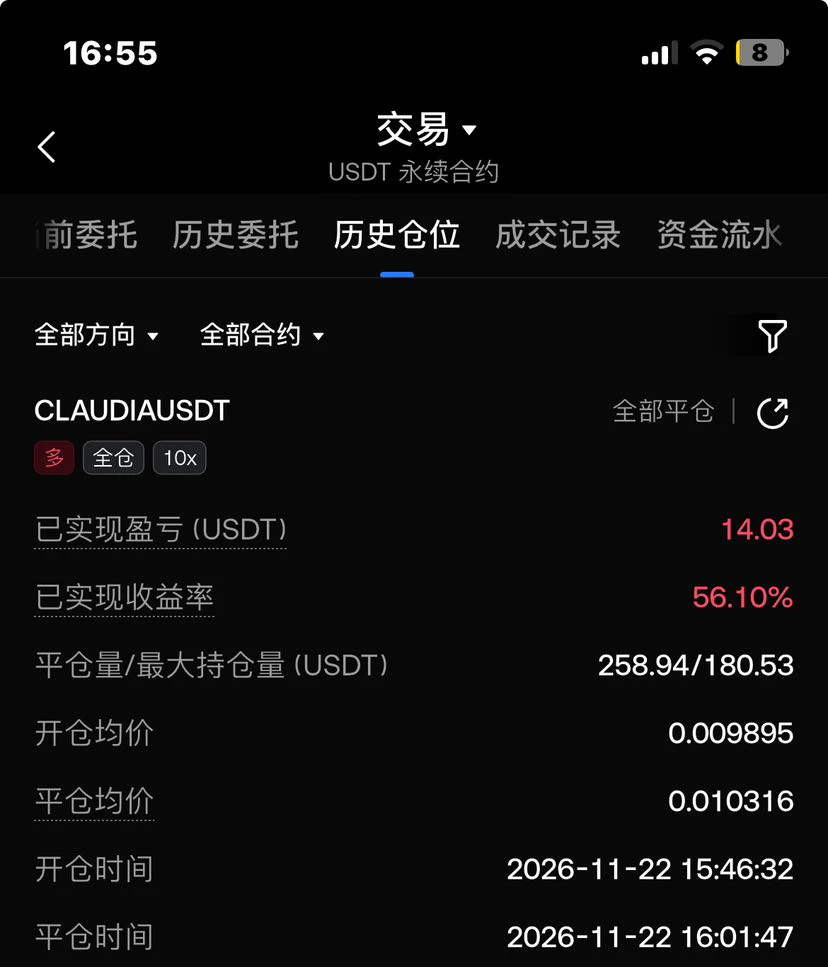
$CLAUDIA Once bitten by a snake, you fear the rope for ten years. Got burned by the exchange rate, so I’m out—damn.
post-image
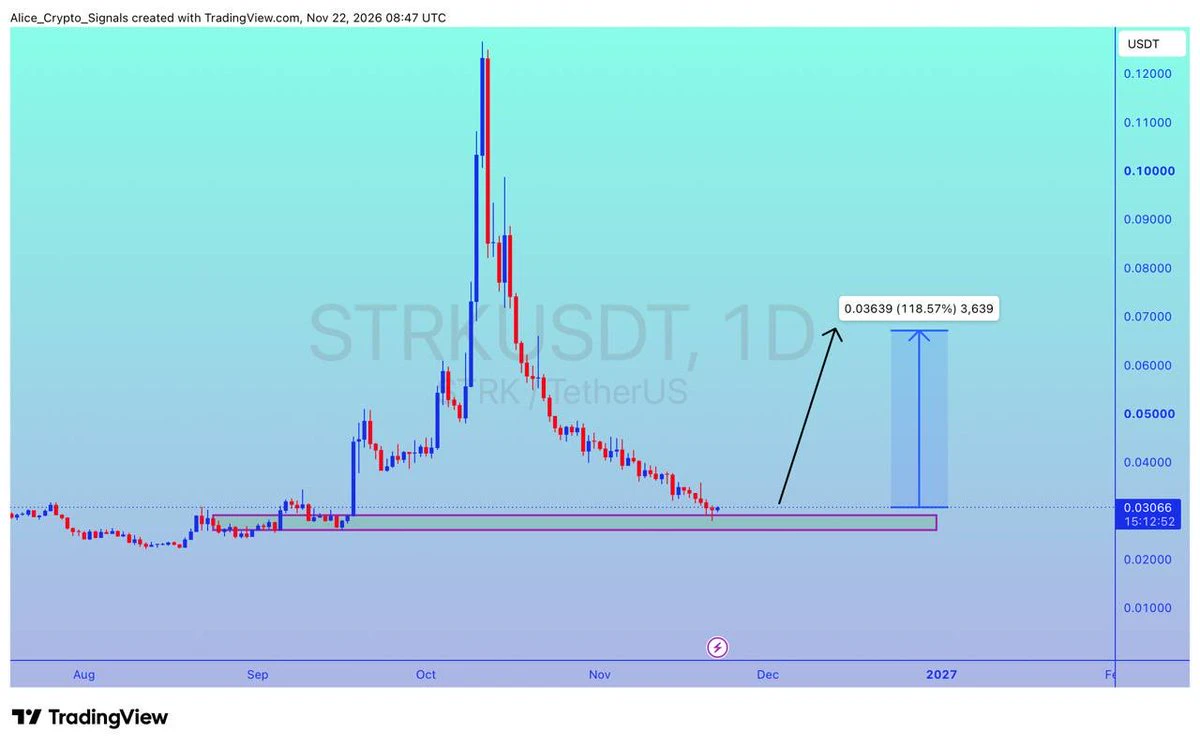
$STRK
UPDATE
#STRK is getting a goo support here. In this move we can see 100%+ gain here ✍🏻
post-image
STRK-3.55%
Sis is back to being the messenger 📖
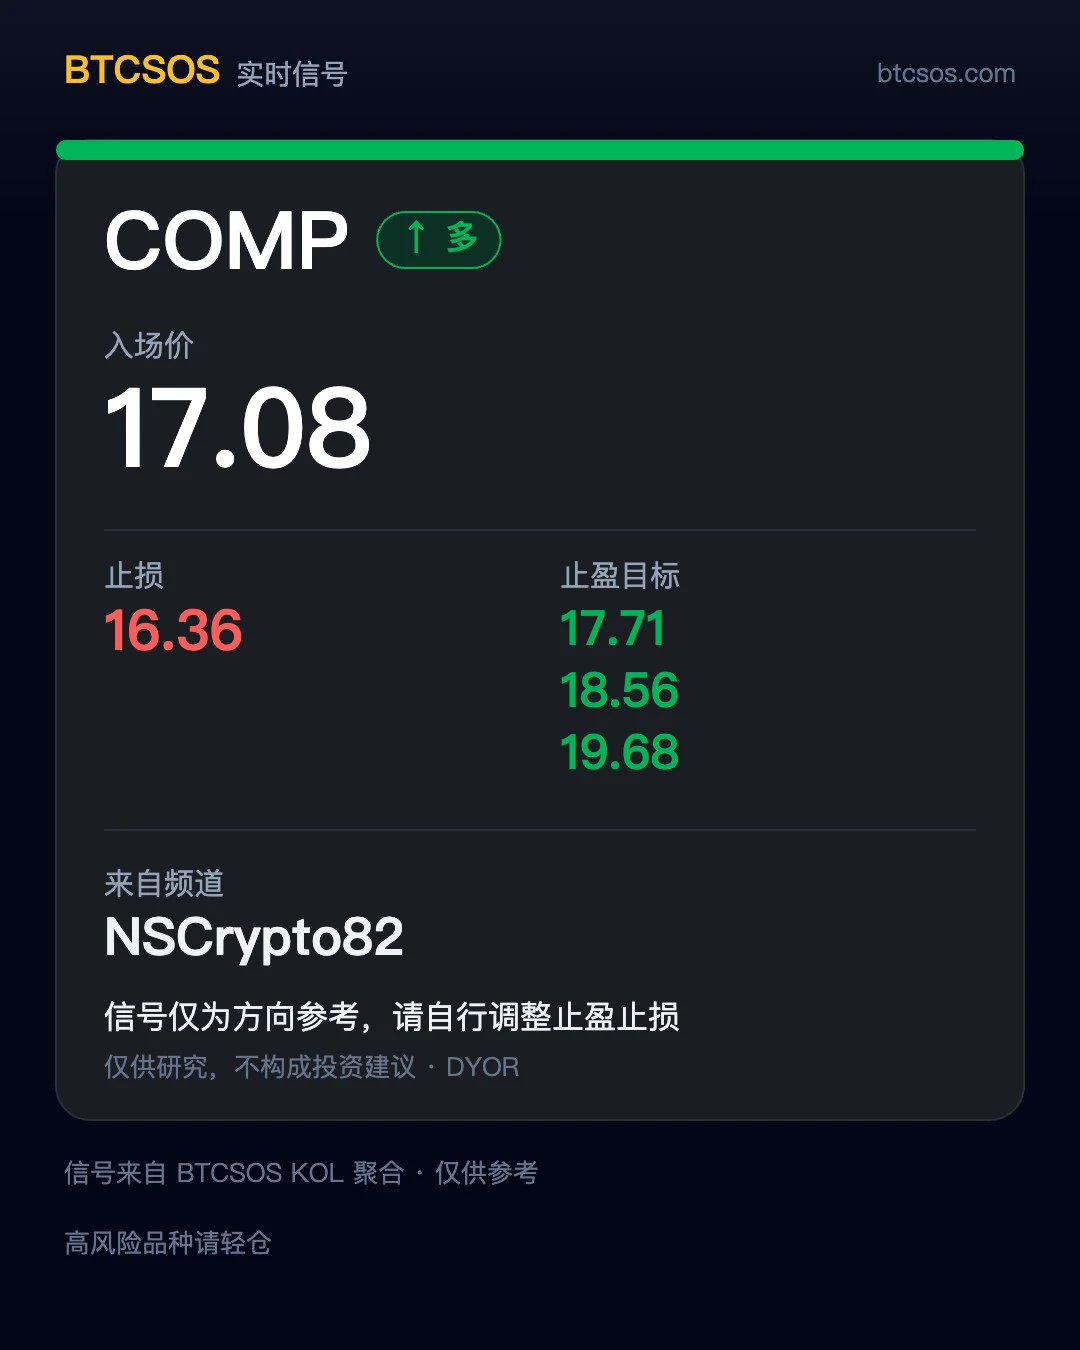
BTCSOS just picked up a new signal from NSCrypto82 — I only relayed his $HYPE trade yesterday (11-21), and now there’s another one, this time switched to an $COMP long position:
Entry 17.08|Stop-loss 16.36 Target 17.71 / 18.56 / 19.68 Time: not specified in the source, just captured
Folks, the signal belongs to someone else, but the wallet is yours. I’m just passing it along as-is; whether to follow it and how much to put in is up to you~
For personal record-sharing only; not investment advice. #新币观察站 xTLT +0.87% xSECZ +2.91%
post-image
HYPE+0.24%
COMP-10.58%
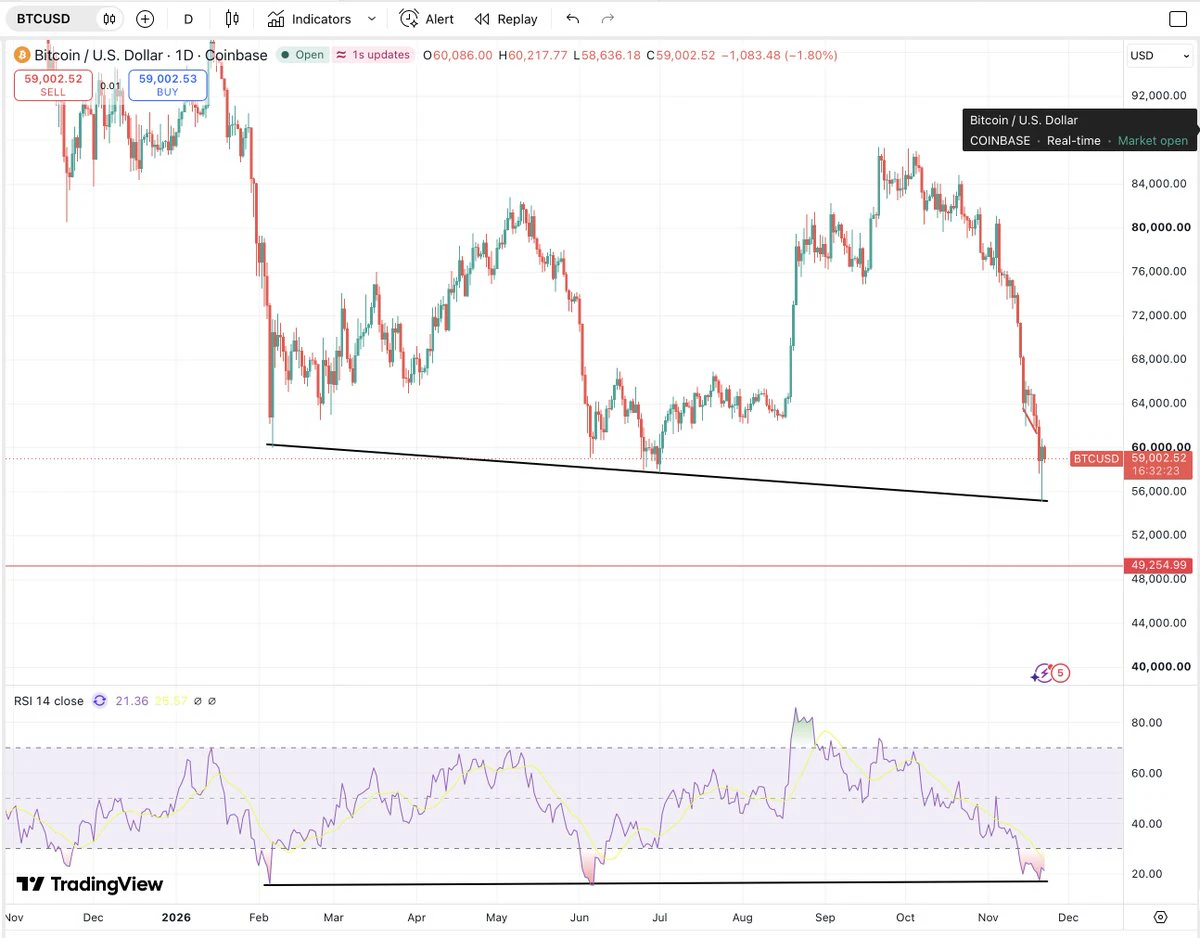
#BTC is testing trendline support near $55–56k. Daily RSI is still oversold, with potential bullish divergence on a close-to-close basis. A daily close back above $60k would strengthen the bounce case. A close below the trendline would weaken it.
post-image
BTC-0.67%
  • 3
How are there still whales like this who haven't been liquidated? If they refuse to admit defeat, the price can't go up. 😅😅$BTC
post-image
BTC-0.65%
$AAVE finally woke up and started breaking through those resistance levels, as if it had something to prove. It's pretty amusing when you think about it: for weeks, it seemed allergic to any real trading volume, then suddenly woke up today and decided to make a run for it. Let's see whether this is a genuine breakout or just another morning jog before heading back to the couch. Take profit: 101.42 Stop loss: 93.61 Hot coins: $EVAA : Current price 3.1694 - 24-hour change: -51.20% $SKYAI : Current price 0.04098 - 24-hour change: +51.33%
post-image
AAVE-1.22%
EVAA-0.49%
SKYAI-7.58%
#晒出我的持仓收益 Charge, push toward resistance, BTC (Bitcoin)
post-image
BTC-0.65%
This round of U.S. stock sell-offs has been brutal: the Nasdaq plunged 5.28% in a single day, the S&P 500 fell for seven straight days, closing down 3.7%, and even the Dow gave way, sliding 1.93%. Since its August peak, global stock market capitalization has shed nearly $9 trillion. The apparent trigger was a widespread sell-off across the AI sector, with $NVDA plunging 14% in a single day and Anthropic turning sour on its first day of trading. But at its core, it comes down to three words: repricing.
In the past, markets were willing to believe that “the AI narrative is big enough to justify
post-image
NVDA-0.35%
XAU+0.38%
BTC-0.67%
$EVAA Bought the dip, bought the dip—the rebound is pretty quick
EVAA-0.49%
  • 1
Can yesterday’s liquidation data make the all-time top 10? Will this round of cascading sell-offs $BTC really send prices plunging all the way to 40,000? I lean toward no. Instead, I want to remind everyone: don’t take missing out lightly—when the price reaches your target level, it’s time to act:
1. The liquidations triggered by yesterday’s volatility totaled 256.4 billion, 1.6 times the amount on the day FTX collapsed. That puts it at the 5th-largest liquidation event since 2021, and 12th in BTC’s entire history. There have already been 5 major shakeouts in this bear market, and most of the
post-image
BTC-0.67%
Multiple Whales Buy the Dip as Bitcoin Rebounds Above $60,000

Everyone is shouting that the bear market is here, but the richest wallets on-chain haven’t stopped buying. As I write this, BTC has bounced off the $55,140 wick and is hovering around $60,000. Just 24 hours ago, longs had been wiped out for $2.4 billion, 92.5% of them long positions, leaving carnage in their wake; then the shorts started taking hits too, with BTC short liquidations surging 56%. Longs and shorts were both getting washed out in turn within a single day. What really made me sit up was this: Abraxas Capital withdrew 1
post-image
BTC-0.67%
ETH-1.26%
BNB-0.76%
Load More

Join 40 M users in our growing community

⚡️ Join 40 M users in the crypto craze discussion

💬 Engage with your favorite top creators

👍 See what interests you

Trending Topics

BTCReboundFaces60KTest

2.1M Views30.1K Discussing

BTC rebounded from around $55,300 on November 21, briefly reclaiming $60,000 before pulling back to around $59,300. The $60K level is back in focus as traders assess whether the recovery can last. Is this rebound a sign of stabilization or a short-lived recovery? Would reclaiming and holding $60K be enough, or do you need confirmation from trading volume and fund flows?

PCEAndGDPDataNextWeek

258.7K Views2.6K Discussing

GateDirectIPOPhase3ANTAllocates92100Shares

823.4K Views5K Discussing

View More