Square
Following
Hot
News
Notifications
Profile
Share your thoughts
placeholder
Article
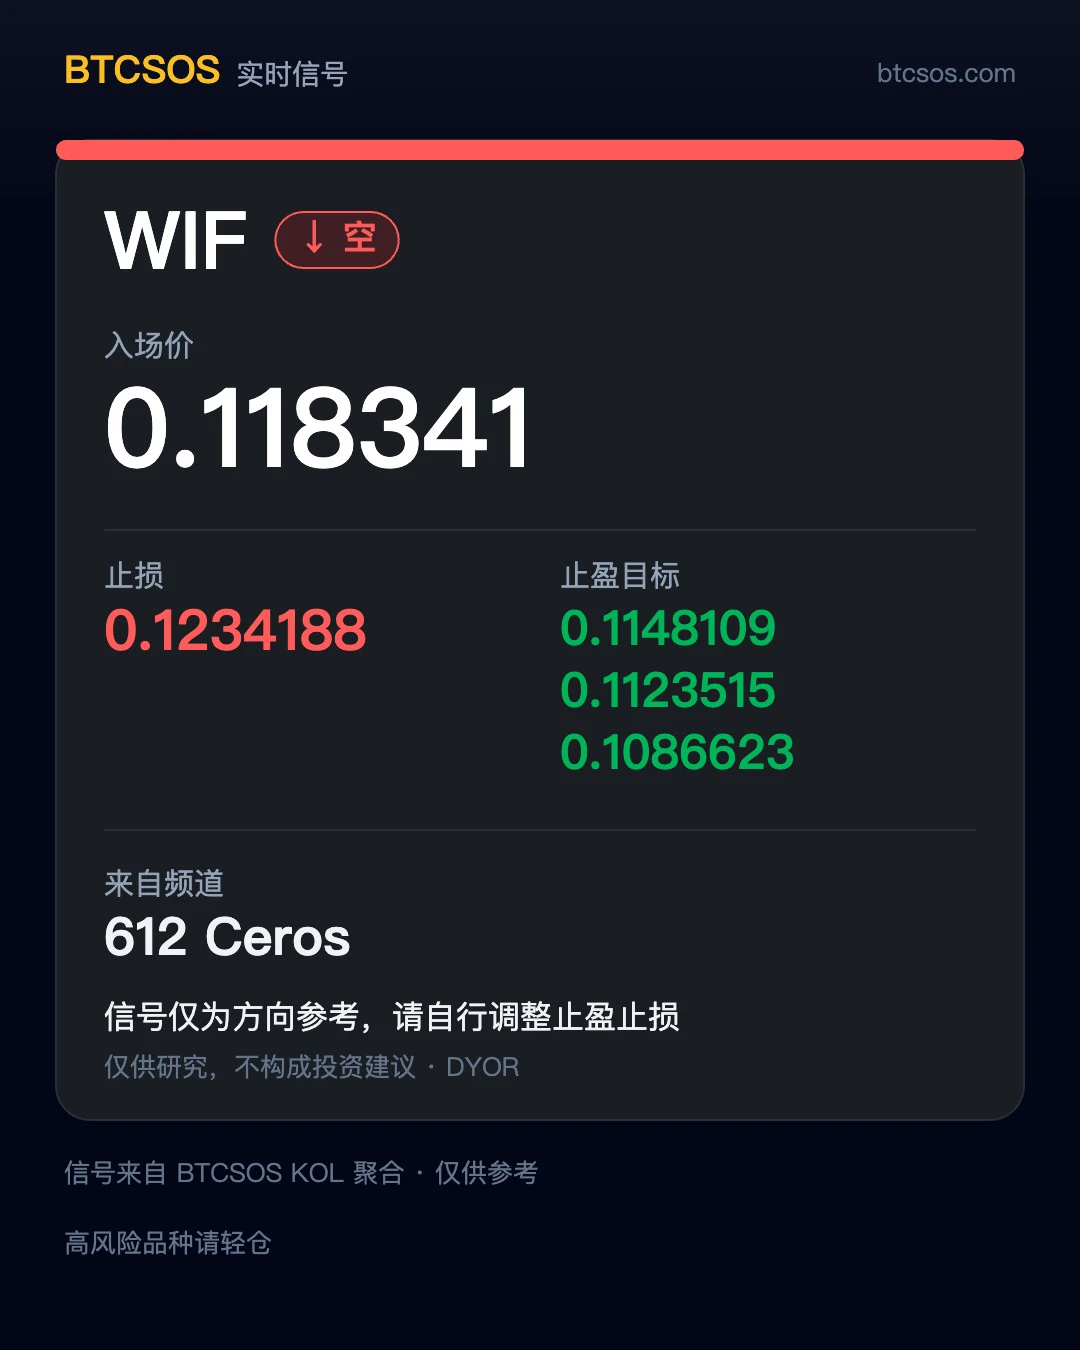
📡 Signal Relay Card
Channel: 612 Ceros Target: $WIF Short entry: 0.118341 Stop-loss: 0.1234188 Targets: 0.1148109 / 0.1123515 / 0.1086623 Time: Not specified in the original signal
Come to think of it, I just reposted a trade for 612 Ceros earlier today (11-22), and here it is again👀
Sis only relays the signal as-is. Whether to follow and how much to put in is up to you.
Personal record shared for reference only; not investment advice. #Trade Voices: Your experience deserves to be heard.
post-image
WIF-0.22%
Earn futures points and claim airdrop rewards:
post-image
Trenches
PIEVERSE
P
bade
b
PIEVERSE
0x0e...25a9
Market Cap
$.
Change
.
24h Vol
$.
Holders
.
IDOL
I
bade
b
IDOL
0x3b...ab07
Market Cap
$.
Change
.
24h Vol
$.
Holders
.
JAGENT
J
bade
b
JAGENT
0x8e...ae15
Market Cap
$.
Change
.
24h Vol
$.
Holders
.
hSOL
h
bade
b
hSOL
he1i...tn9A
Market Cap
$.
Change
.
24h Vol
$.
Holders
.
CATE
C
bade
b
CATE
Ai66...pump
Market Cap
$.
Change
.
24h Vol
$.
Holders
.
Bearish $QNT . Trade parameters: Entry: 142.57 - 143.28 Target 1: 135.97 Target 2: 130.41 Exit: 147.58
QNT has lost momentum below the 15-minute moving average; time to follow the trend down to support. You can trade here. There are two on my watchlist:
‍$EVAA and $ELSA .
post-image
QNT+4.79%
EVAA-0.49%
ELSA+5.80%
Rewards are being distributed now! Open the surprise box and win tokens worth up to 100 USDT!
post-image
MAGMA | Long 🟢 | Bullish | 15m | 24h: +3.12% | Volume: 40.7M USDT Long rationale: Price above EMA200; EMA20/50/200 bullishly aligned; RSI14 at 54.3; MACD histogram positive; ADX14 at 9.4; volume at 0.39x the 20-candle average; trend pullback/continuation. Entry: 0.26313 Stop loss: 0.256583 Take profit 1: 0.271314 | Take profit 2: 0.276225 | Take profit 3: 0.282772 For reference entry points only; do not chase the price. The strategy is invalidated if the stop-loss level is hit. Technical analysis strategy only; not investment advice. $MAGMA
post-image
MAGMA-0.57%
What Is Consensus?
From a time when humans did not yet know how to use fire to the formation of human civilization
Human society is full of things we cannot see or touch
yet that profoundly shape our lives.
Examples include justice, morality, beliefs, positions, language,
writing, family, businesses, religion, currency,
nations, and laws.
These things may seem unrelated,
but they share a common core concept:
consensus.
Without consensus, humans might still
be able to survive as individuals or in small groups,
but it would be difficult to build the complex
social institutions and systems of civ
post-image
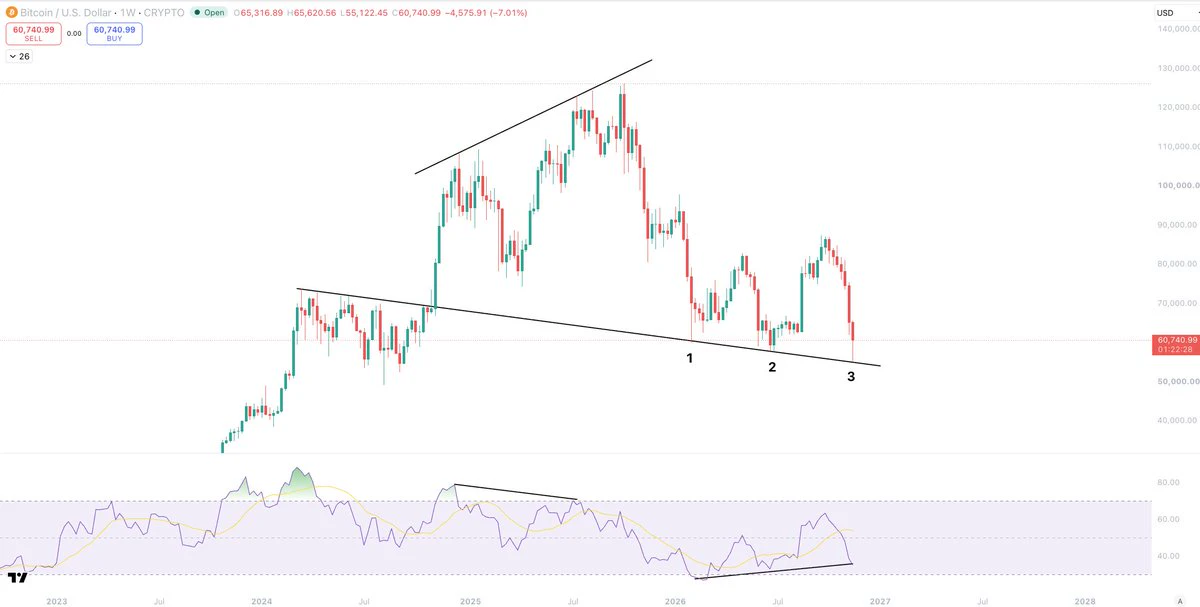
That is a pretty clean chart.
Three drives
Long-time Bullish divergence
2 year long trendline
Be wild if it plays out.
post-image
Burns $16.4 billion in a single quarter, with a 5.7% AI business profit margin—SpaceX’s compute business is hard-earned money

The $40 billion financing narrative is grand, but the financial reality of SpaceX’s AI business is far less rosy.

In the third quarter of 2026, SpaceX’s AI division, Super Intelligence (SI), generated $7.56 billion in revenue, accounting for 51.9% of the company’s consolidated revenue of $14.575 billion—AI now accounts for half of SpaceX’s revenue. But SI’s operating profit for the same quarter was only $431 million, with an operating margin of 5.7%. Meanwhile, SI’s c
SPCX-7.38%
Down 14%, $AIOT fell from 0.0685 to 0.0581, with 5.4M in trading volume. This level is interesting.
A question: Was the 0.0571 24-hour low caused by someone dumping, or did it naturally slide down because there were no buyers? Two answers.
If it was a dump—down 14% with 5.4M in volume doesn’t look like retail selling; it looks more like someone using the weakness to push the price down and shake out weak hands. Technically, it’s a high-volume wick.
If there were no buyers—the volume actually isn’t that high. 5.4M isn’t enough to support an aggressive dump; buyers simply pulled back, and the p
AIOT-2.28%
  • 3
Crypto Trade Today
live-cover
LIVE1,320
AAPL-1.83%
AMD-13.27%
PLTR-6.45%
NVDA-13.84%
MU-13.88%
Bnb
live-cover
LIVE690
BTC-0.67%
ETH-1.26%
SOL-0.77%
$LIT surged into trending searches, yet is down 1.8% in 24h; Fear & Greed at 11, I'm shorting
Ridiculous! $LIT is trending, but the market's response is just -1.8%: currently at 2.615, drifting lower within the 2.4–2.753 range.

I'm opening a short here. Trending brings attention, not buyers—the combined multi-timeframe signals are bearish, with 1h ADX at 7.8 and daily ADX at 15.5, showing no trend at all. With Fear & Greed frozen at 11, trending coins are most likely to leave you holding the bag.

The bearish case: first, the daily MACD has formed a death cross below the zero line, and the hi
LIT-4.56%
Nvidia fell 20% in a week, but Treasuries are rallying and rate-hike expectations are easing—BTC is caught between two narratives

The most notable thing on Friday night wasn’t how much BTC fell, but that Nvidia and Treasuries were moving in opposite directions. Nvidia plunged 14%, its seventh consecutive day of losses, and fell more than 20% for the week, its biggest weekly drop since October 2008; the Philadelphia Semiconductor Index tumbled nearly 11%, AMD fell more than 13%, Micron dropped nearly 14%, the Nasdaq fell 5.28%, and the S&P 500 entered correction territory. This was a textbook
BTC-0.65%
Place Stop-Losses Ahead of Liquidation Zones

• First check open interest and the long/short ratio: BTC open interest is 91522 contracts, with a long/short ratio of 2.1726; ETH open interest is 2316988 contracts, with a long/short ratio of 1.9078; SOL open interest is 8167177 contracts, with a long/short ratio of 3.3215; BNB open interest is 503973 contracts, with a long/short ratio of 2.3727. The more crowded leveraged positions become, the more likely an opposite price move is to trigger a cascade of stop-losses.

• Long positions in SOL are the most crowded, with a long/short ratio of 3.321
post-image
BTC-0.65%
ETH-1.23%
SOL-0.74%
BNB-0.72%
  • 3
  • 2
$KAVA A long opportunity is taking shape, and I’m eyeing a long position.
Here’s the plan: The entry range is set between 0.02276 and 0.02318; upside targets are 0.02420 and then 0.0252; the stop-loss is set at 0.02208.
Technically, the RSI has compressed into extremely low territory, while the funding rate has turned negative—this combination often signals crowded shorts, and a short squeeze could start at any moment.
But keep this in mind: If the current strong downtrend continues, this rebound could quickly be wiped out.
One final reminder: Don’t get carried away and take an oversized posi
post-image
KAVA-0.56%
Good morning, Zuo Zuo kept an eye on things for you all weekend ☕
Wall Street just had its worst week since 2020 👇
The Nasdaq fell 10% in one week
$NVDA fell 23% in one week, its biggest weekly drop in 18 years
The VIX fear index surged to 37 on Friday
But markets that stay open over the weekend have already cast their votes:
$BTC hit a low of 55,106 on Saturday and was around 60,800 at 06:30 Taipei time
The on-chain 24-hour S&P 500 perpetual was around 7,012, about 1.5% above Friday’s close of 6,910
The Nasdaq 100 perpetual was also about 2.2% above the close
Zuo Zuo’s take: The weekend re
post-image
NVDA-13.84%
BTC-0.67%
SPX500+0.19%
Everyone’s been talking lately about whether this commodity rally is about to really take off. The consensus seems pretty clear: the supply-demand gap is right there, so prices are bound to rise sooner or later. Sounds reasonable. I thought the same thing last month, until I looked at the positioning and saw that retail traders were more heavily positioned than institutions. The answer is in the details—when everyone thinks it’s just a matter of time, that “sooner or later” is often already behind us.

I have a bad habit in this business: when I see data, I question where it came from. In this
post-image
  • 2
$SOXLB Short-Term and Longer-Term Divergence: Which Direction Will Change First?
Currently, $SOXLBUSDT is priced at 34.35, up 4.122% in 24 hours. The intraday high is 34.73, and the low is 32.16. The 1-hour chart shows strength, with the price breaking above the 1-hour EMA20 at 33.7062 and RSI14 at 60.99, indicating a strong short-term trend. The price has touched the 1-hour resistance at 34.73, but whether it can hold above this level and continue rising is key.
The 4-hour chart shows weakness, with the price slightly below the 4-hour EMA20 at 36.6917 and still a considerable distance from th
post-image
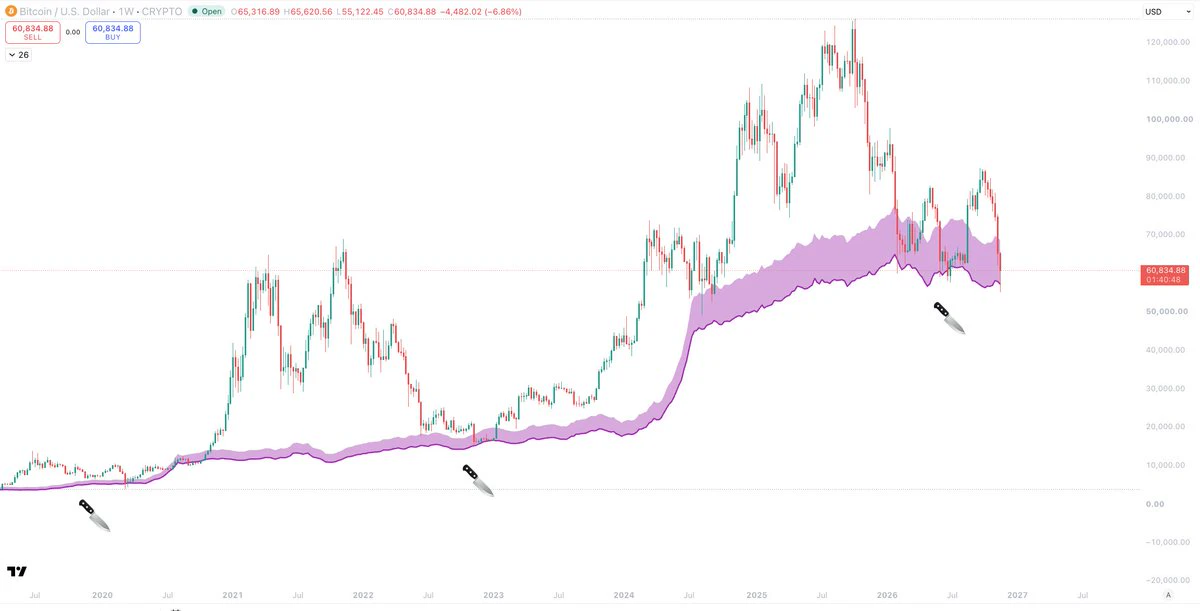
Regardless of how brutal this price action has been...
When you strip it back it becomes clearer.
We have just been put through one of the most complex bottoming structures with more fake-outs and traps ever seen.
Usually, a bull trap will get bulls too bullish before reclaiming actual levels that represent a true shift.
This time, however, we reclaimed all levels and it was still a trap, which had never happened before.
However, everything still points to this $60k zone being the bottom.
This chart very simply shows the Syko HTF bottom signal, with the Bitcoin production cost indicator.
Closi
post-image
BTC-0.67%
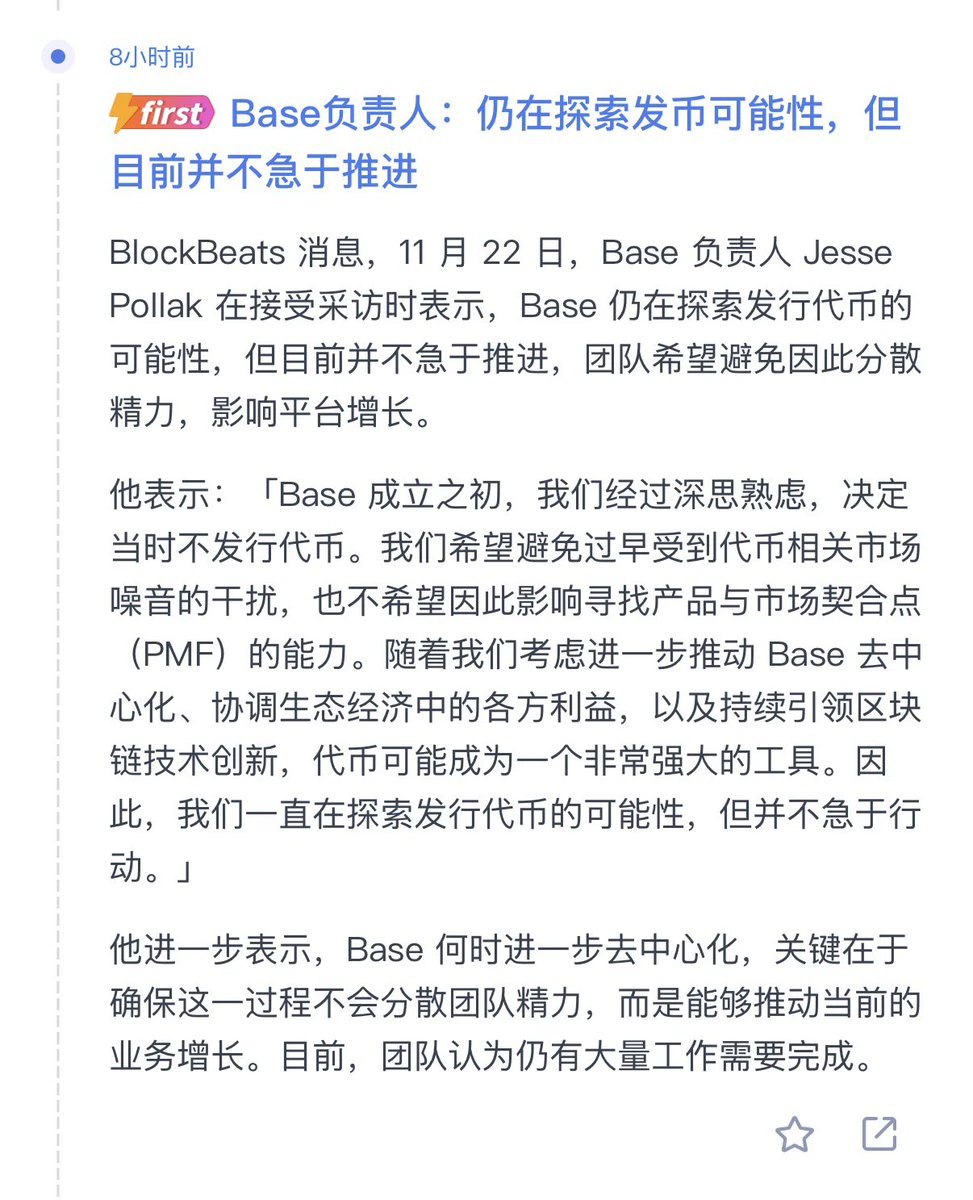
Base could still launch a token
It's just that today, after the entire market has cooled off,
who still cares?
post-image
Load More

Join 40 M users in our growing community

⚡️ Join 40 M users in the crypto craze discussion

💬 Engage with your favorite top creators

👍 See what interests you

Trending Topics

BTCReboundFaces60KTest

2.2M Views30.1K Discussing

BTC rebounded from around $55,300 on November 21, briefly reclaiming $60,000 before pulling back to around $59,300. The $60K level is back in focus as traders assess whether the recovery can last. Is this rebound a sign of stabilization or a short-lived recovery? Would reclaiming and holding $60K be enough, or do you need confirmation from trading volume and fund flows?

PCEAndGDPDataNextWeek

261.7K Views2.6K Discussing

GateDirectIPOPhase3ANTAllocates92100Shares

869.4K Views5.1K Discussing

View More