Square
Following
Hot
News
Profile
Share your thoughts
placeholder
Article
📗Macro Schedule (Time)

✅10.19 Monday
14:00 Opening ceremony of the Financial Street Forum Annual Meeting; senior officials from the central bank, SAFE, and CSRC to speak; Fed discount rate closed-door meeting (no exact public time)
✅10.20 Tuesday
09:00 LPR loan prime rate announcement; Fed governors' closed-door meeting
✅10.21 Wednesday
Morning APEC Finance Ministers' Meeting and post-meeting press conference (Hong Kong venue)
✅10.22 Thursday
Evening European Parliament vote on a resolution related to Black Sea shipping
✅10.23 Friday
Evening U.S. consumer and manufacturing economic data rel
post-image
Vance’s response says a lot. They asked whether he’d seen any corruption, and he pivoted to Trump’s business interests—basically, he didn’t answer. With this White House mess, the question was “What did you see?” and the answer was “What do you suspect?” Those are pretty far apart. Where should we set the stop-loss?
post-image
Trenches
AGT
A
bade
b
AGT
0x5d...e274
Market Cap
$.
Change
.
24h Vol
$.
Holders
.
CNPY
C
bade
b
CNPY
0xc6...ddd2
Market Cap
$.
Change
.
24h Vol
$.
Holders
.
Q
Q
bade
b
Q
0xc0...0589
Market Cap
$.
Change
.
24h Vol
$.
Holders
.
Gato
G
bade
b
Gato
55A3...pump
Market Cap
$.
Change
.
24h Vol
$.
Holders
.
DOPE
D
bade
b
DOPE
0xf9...8899
Market Cap
$.
Change
.
24h Vol
$.
Holders
.
This week, Bitcoin and Ethereum spot ETFs recorded a total of $548.55 million in outflows.
$BTC spot ETFs recorded a total outflow of $228.58 million, while $ETH spot ETFs recorded a total outflow of $319.97 million.
post-image
BTC-0.96%
ETH-1.64%
  • 2
🐋 CRYPTO WHALES ARE MAKING BIG MOVES — IS A MAJOR MARKET REVERSAL COMING?
Large crypto holders can influence market sentiment with significant buys, sells, and changes in their positions. But are these whale movements early signals of a market reversal, or simply strategic moves in an uncertain market?
🔥 Today's Gate Livestream Discussion
🔹 What can large whale transactions reveal about market sentiment?
🔹 Are whales accumulating Bitcoin and Ethereum or preparing to sell?
🔹 Could major capital movements signal a potential bullish reversal?
🔹 How can traders distinguish genuine accumulati
post-image
BTC+0.13%
ETH-0.51%
  • 2
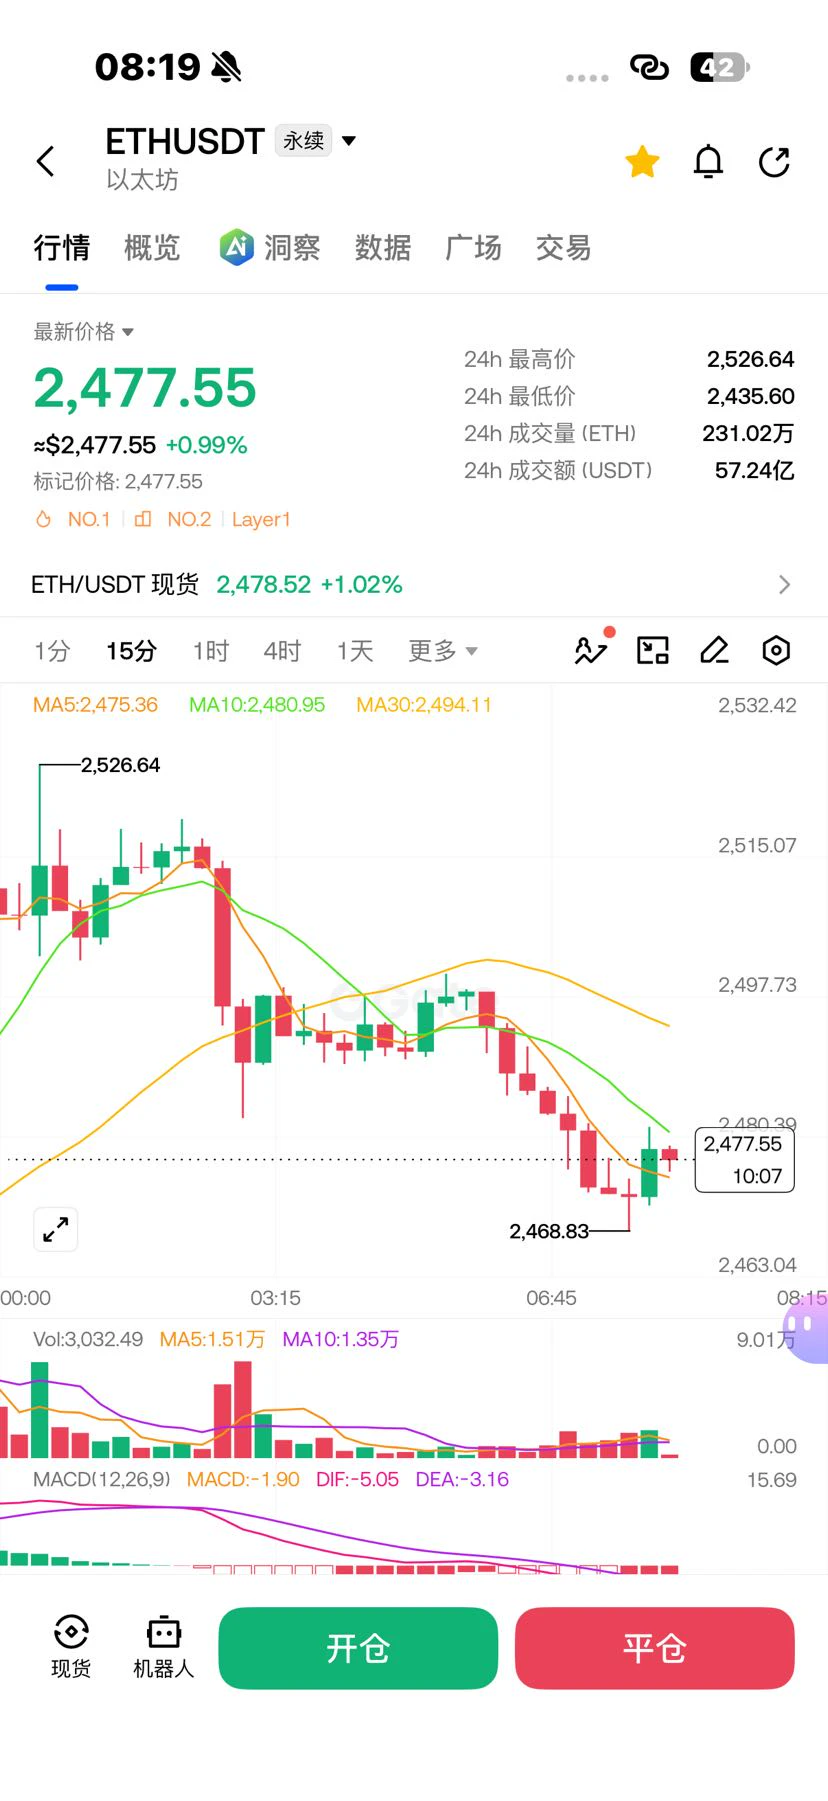
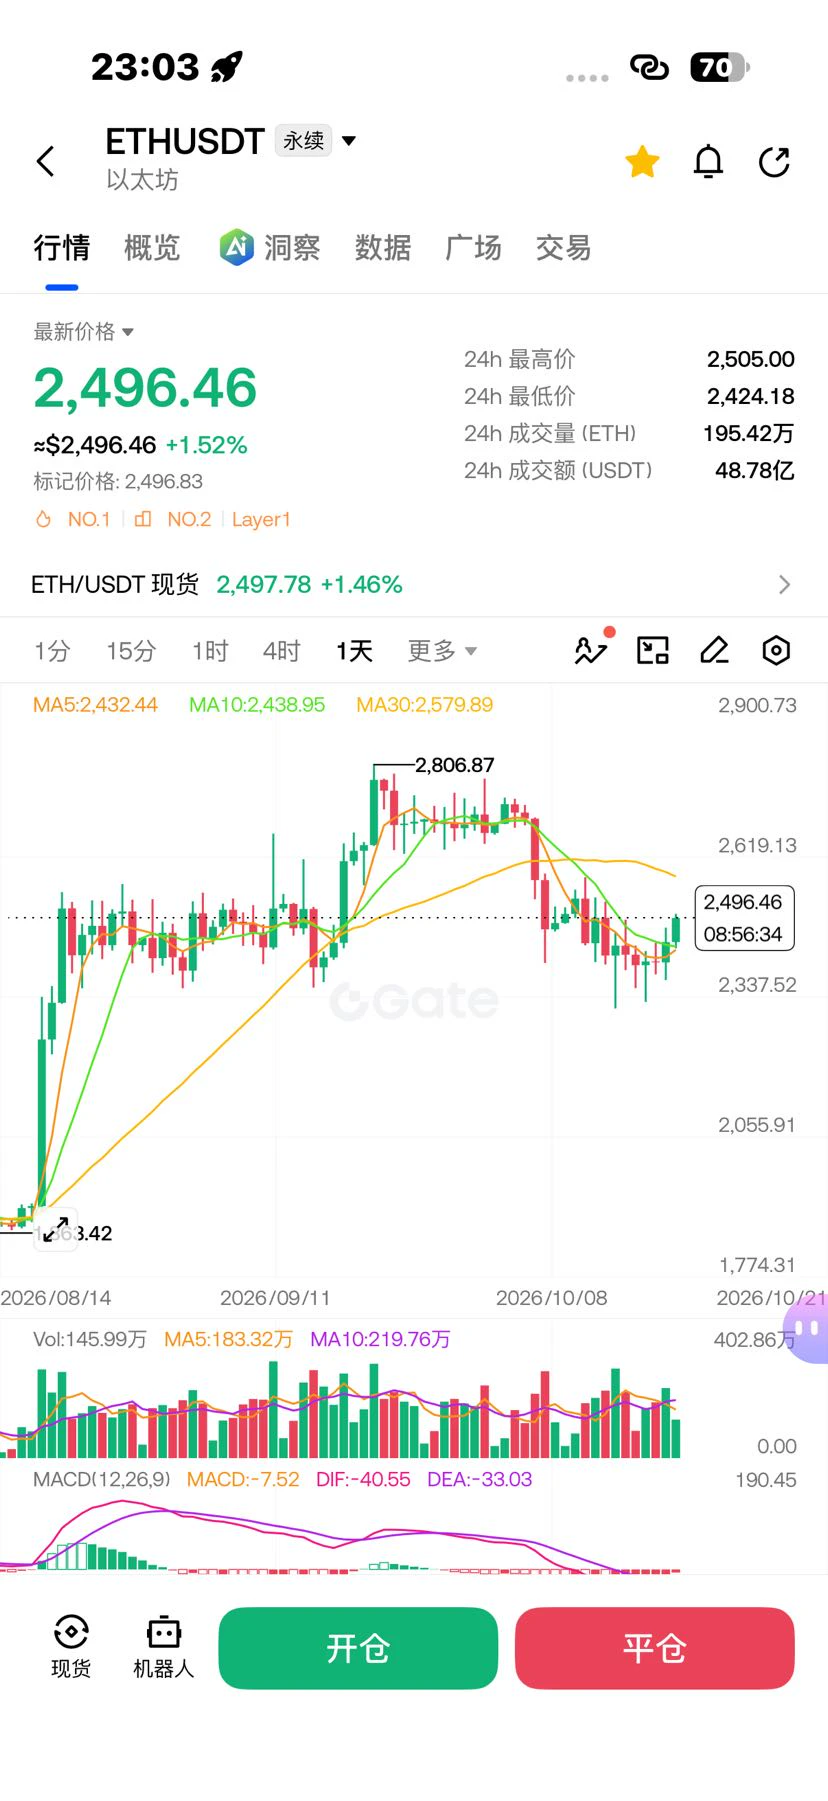
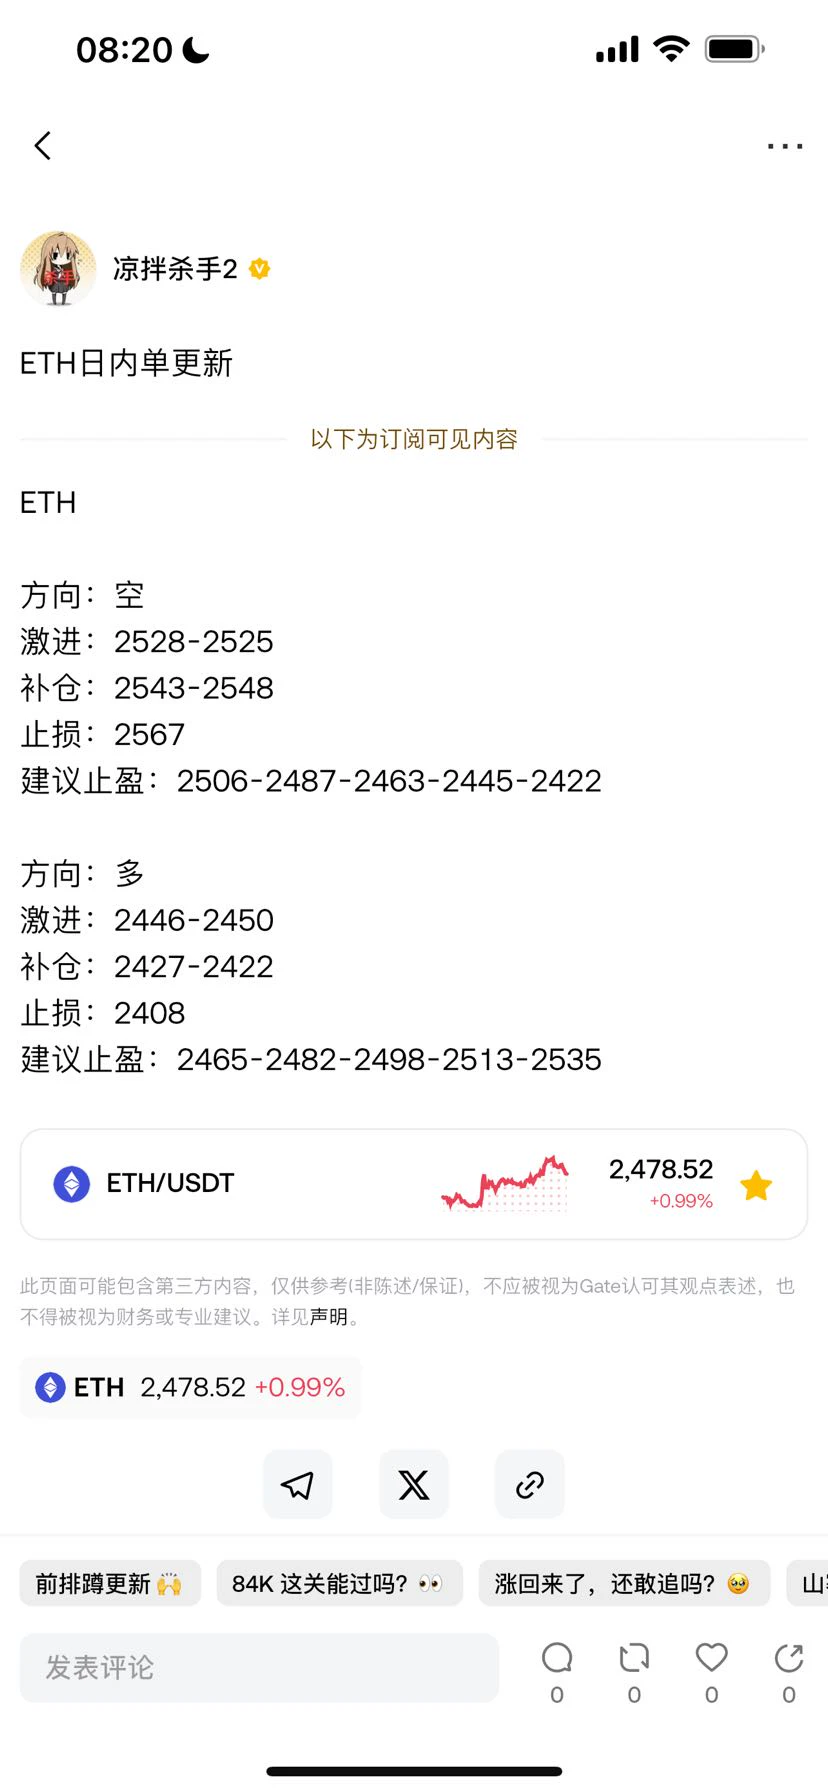
10.17$ETH
Last night's market action was like riding a roller coaster
Longs launched a fierce attack, then suddenly collapsed, smashing straight through 2400
Upside momentum faded; I cut losses decisively in time, exited at breakeven, and avoided a deep pullback
Price is now stuck in a narrow 2415-2425 range
Moving averages are converging near 2420, with bulls and bears evenly matched
Volatility is under 10 points—the calm before the storm!
The range is tightening and building momentum, with a major one-way breakout imminent
Watch the range closely; once volume expands and direction emerges,
post-image
ETH-0.51%
BTC UPDATE
live-cover
LIVE77
#NEARJumpsNearly10% #ShareWeekly
INFLATION SHOCK, BITCOIN AT $82K, NEAR’S RALLY, AND NVIDIA: WHAT COMES NEXT FOR THE CRYPTO MARKET?
The financial markets are entering a critical phase where inflation, Federal Reserve policy, technological innovation, and speculative trading are shaping investor sentiment. The latest U.S. Producer Price Index (PPI) data has challenged expectations of a smooth monetary easing cycle, while Bitcoin’s recovery toward $82,000, NEAR Protocol’s nearly 10% surge, and renewed meme-coin speculation reveal a market full of contrasting signals.
1. U.S. PPI: Inflation Rema
BTC+0.13%
NVDA-1.42%
MEME-3.02%
TSLAX-0.39%
TOKEN-1.44%
Sunday morning—time for a cup of coffee to wake you up!
SpaceX’s first full quarterly earnings report is about to be released. What the market really cares about isn’t how fast revenue is growing, but when its AI investments will start translating into profits.
Second-quarter revenue rose 92% year over year to $7.81 billion, but the company still posted a net loss of $541 million. The market expects third-quarter revenue of around $12.86 billion, with Starlink growth, AI revenue, and massive capital expenditures set to be key areas of focus.
My take: beating revenue expectations is just the fi
post-image
SPCX-1.74%
EIA data determines the short-term direction of crude oil
live-cover
LIVE1,424
At 5 a.m., Ethereum saw another sharp wick down, mainly as Brent crude broke above $106 in after-hours trading, up more than 4% intraday
Combined with the U.S. September CPI annual rate accelerating to 3.7%, markets repriced the rate-hike path and risk appetite contracted; continued net outflows from spot ETFs and declining exchange reserves amplified the drop, leaving the short-term outlook weak.
post-image
ETH-0.51%
BZ-0.76%
  • 2
  • 1
$EPIC It surged 18% in a day, briefly touching 0.3350 before dumping back to 0.2884. That long upper wick is no joke.
First, the signal: this is a classic high-volume spike and retracement. The 24-hour trading volume of 72.2M alongside an 18.29% gain shows the volume is real, but that wick at 0.3350 indicates very heavy overhead selling pressure. From the low of 0.2182 to 0.3350, the price gained 53%, so profit-taking at this level is perfectly normal. Technically, 0.2884 sits just below the midpoint of the intraday gain, putting it in the pullback confirmation phase—not a breakout entry poin
EPIC+20.73%
#每周来晒 #USSeptemberPPIDataRelease
#USSeptemberPPIBeatsExpectations
September PPI beat expectations by a wide margin, and the market's reaction tells a more interesting story than the number itself. The report came out at 20:30 Beijing time on Thursday, October 15. Producer prices rose 1.3% on the month against about 0.6% expected, and the annual rate hit 6.3% against a consensus of 5.5%, with energy up 10.8%. That makes the monthly gain more than double the forecast, so the answer to whether it exceeded expectations is a clear yes.
Inflationary pressure on the production side is strong, and i
CME+1.49%
US500-1.06%
BTC+0.13%
The morning sunlight shines on the flower’s center,
making it especially radiant.
May your mood bloom like a flower
🐷🐷🐷🐷
post-image
Down 20.9% in forty hours; the rebound took just three hours.
Someone asked: Is the sell-off over?
I said: Look at the volume first.
The 05:00 candle plunged to 86.7, with 16.34 million traded in a single hour.
The previous candle had only 850k.
Nineteen times.
Then they asked: Can I buy in?
I said: Before buying in, first look at why I’m not.
$SOXL Now at 91.92, with 93.70 overhead and 5.7% downside to 86.7.
There are no signals in this range, only noise.
Then they asked: How long should I wait?
Wait for a retest of 86.7 that holds, or for the price to reclaim 93.70—one of the two has to hap
post-image
SOXL-2.06%
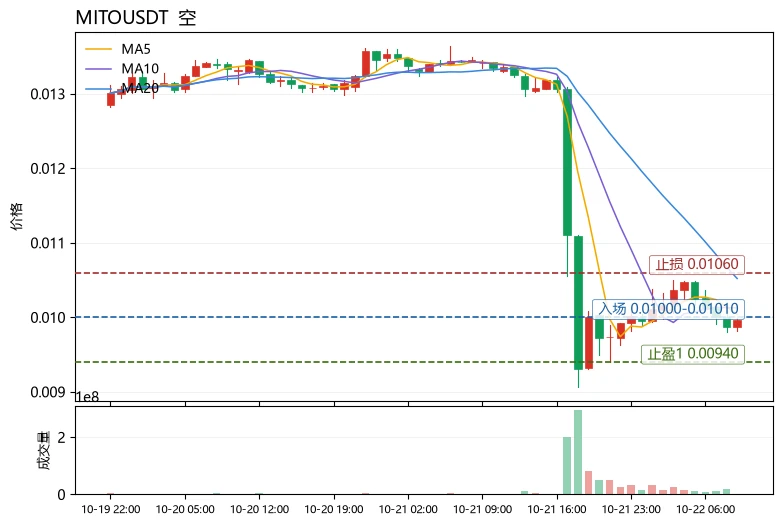
AVAX keeps sliding, bears are in control, heading straight for 9.30! Short $AVA .
Entry: 9.727 - 9.776 Take profit: 9.277 - 8.897 Stop loss: 10.069 Note: If the 9.55 support level suddenly rebounds, it could trap people chasing shorts. Don't go all in, buddy. Position size should suit your own account. Watch the downtrend. 👇👇👇 Continue to follow $AV and $BTC .
post-image
BTC+0.13%
#每周来晒 #美国9月PPI大超预期 #沃什IMF讲话 Brent crude has surged past $110. U.S. stocks and Bitcoin should be on alert ahead of November 3
What happens if oil prices keep rising, AI stocks begin to correct, and U.S. inflation refuses to come down?
Any one of these factors on its own may not trigger a major sell-off. But if they converge around the November 3 U.S. midterm elections, the market could face a difficult stress test.
01 The real trouble is oil pushing inflation higher again
Brent crude has broken above $110 per barrel. This price warrants caution because crude oil is no ordinary commodity: its
post-image
ThisIsTranslateContent:
#美国9月PPI大超预期 #沃什IMF讲话 Brent crude breaks above $110; U.S. stocks and Bitcoin should be cautious before November 3
What happens if oil prices keep rising, AI stocks start correcting, and U.S. inflation remains stubbornly high?
Each of these factors alone may not necessarily trigger a major sell-off. But if they converge around the November 3 U.S. midterm elections, the market could face a challenging stress test.
01 The real problem is oil pushing inflation higher again
Brent crude has broken above $110 per barrel. This price warrants caution because crude oil is not an ordinary commodity: its effects ripple throughout the economy through transportation, production, chemicals and consumer spending.
More importantly, U.S. CPI rose 3.7% year over year in September, while gasoline prices jumped 9.1% month over month. The simultaneous rebound in inflation and rise in energy prices have prompted markets to reconsider whether the Federal Reserve needs to maintain its restrictive policy. Here lies a key tension. If oil prices spike briefly and then fall, markets may quickly absorb the negative impact; but if geopolitical conflicts persist and oil prices remain elevated, inflation could prove more persistent than expected.
This would make the Fed's choices more difficult: cutting rates could prolong inflationary pressures, while keeping rates high could weigh on the economy and asset valuations. So what concerns us more than oil rising 3.6% on any given day is whether high oil prices will change market expectations for interest rates over the coming months.
02 AI valuations and high interest rates could reinforce each other
AI has been one of the most important drivers of the latest U.S. stock market rally. The market has been willing to assign high valuations to companies involved in chips, cloud computing and data centers because investors believe their revenue and profits will continue to grow.
But two questions need answering now: How much return will AI investment actually generate? If financing costs keep rising, are those returns still worth today's stock prices?
Reuters reported on October 15 that confidence in further gains for U.S. stocks depends heavily on strong earnings from large technology companies. Meanwhile, rising oil prices and Treasury yields are also putting pressure on high-valuation assets. This means that even if the AI industry's long-term direction remains unchanged, stock prices could first go through a valuation contraction. If technology companies report better-than-expected results, the market could still recover; if earnings disappoint while interest rates rise, the correction may be more than a short-term swing in sentiment.
03 Could the November 3 midterm elections become a black swan?
The election itself is not necessarily a black swan; the real risk to watch for is a gap between the election outcome and market expectations.
The U.S. midterm elections will determine control of Congress. Different outcomes could affect fiscal policy, tariffs, AI regulation and the progress of cryptocurrency legislation. For the crypto industry in particular, the pace of digital asset regulatory policy is worth watching.
But changes in congressional seats do not mean all U.S. policies will change immediately. The executive branch still has considerable policy tools at its disposal, and the specific impact will also depend on subsequent legislation and implementation.
What could truly catch markets off guard is a scenario in which investors expect the election to bring policy moderation, but the result instead creates greater policy uncertainty; or in which energy prices keep rising, increasing pressure on the government over inflation and the cost of living. If markets have already bet on a particular election outcome and the result fails to meet expectations, crowded positions could be unwound all at once.
04 What could happen to Bitcoin?
In the short term, Bitcoin should not simply be treated as a safe-haven asset. If oil prices continue to rise, inflation rebounds and the Fed sends a more hawkish signal, both technology stocks and crypto markets could come under pressure.
Bitcoin also faces an additional risk: liquidations of leveraged positions could amplify a decline. Conversely, if geopolitical tensions ease, oil prices fall and markets confirm that the Fed will not tighten policy further, risk assets could rebound quickly.
So, over the coming weeks, focus on four indicators: Brent crude prices, U.S. two-year Treasury yields, U.S. technology companies' earnings performance, and Bitcoin ETF flows and changes in futures-market leverage. These are more useful than simply guessing the outcome of a particular election.
05 How should you respond?
Volatility risks in U.S. stocks and crypto markets may rise for a while, but that does not mean a bear market is inevitable. If oil prices fall, yields stabilize and companies deliver on earnings, the market could still recover; if oil prices stay high, rate expectations continue to rise and AI earnings fall short of expectations, the market could face a deeper correction.
For investors, keep some cash on hand, manage leverage, and don't rush to buy the dip after a single decline or easily dismiss the value of long-term assets when markets panic.
The real risk to watch for is not any single negative factor, but several risks that could otherwise be absorbed separately happening at the same time. Treat the period before November 3 as an event window that warrants close attention, not as a predetermined market turning point. Going forward, watch oil prices, interest rates and earnings. The data will show where the market ultimately goes.
repost-content-media
BZ-0.76%
BTC-0.96%
GAS-2.41%
The Nasdaq has started a correction. A weekly bearish divergence is a correction signal, and this correction could be somewhat stronger. It is a multi-timeframe confluence signal, with support at 25,600-24,300-23,800
The question to consider here is: will a U.S. stock market correction spill over to other assets? ❓️
U.S. Treasury yields: The 10-year yield is around 5.09–5.10%, near its highest levels in recent years, putting sustained pressure on high-valuation, long-duration risk assets (tech stocks and crypto)
U.S. Dollar Index: Around 101.8, neutral to firm, with no extreme appreciation
S&P
post-image
SPYX-0.64%
BTC+0.13%
After going through forty-eight candles, there’s one I’m not comfortable fast-forwarding through.
A wick spike.
The 05:00 candle plunged to 1214.16, while the previous one was still above 1297.
Volume picked up: 1.17 million in a single hour, compared with just 35,000 in the previous one.
It rebounded to 1269.44 over the next three hours, but has now slid back to 1257.97.
The peak at 1408.95 was reached at 13:00 on 10-16; after that, each high kept moving lower.
$SNDK In forty hours, it went from 1408.95 to 1214.16, a drop of 13.8%.
As usual: a low formed on heavy volume only counts if it hold
post-image
SNDK-2.24%
#GateWCTCS9全球交易赛
This weekend’s market action has really worn both bulls and bears down.
Watching BTC hover around $81k feels like waiting for the other shoe to drop. Another huge bearish wick appeared overnight. It looked scary, but after breaking below $81k, the price was yanked back up, reclaiming $81.4k in under half an hour. Volume didn’t explode out of control, and a pile of buy orders at lower levels was absorbing the selling. To me, this looks more like a “liquidation-driven fakeout” than a downward trend reversal.
It feels like big money used the panic to carry out a massive rotation
post-image
ETH-0.49%
  • 8
  • 1
Are you going to meet your online date in person?
You’re dressed so cute.
Load More

Join 40 M users in our growing community

⚡️ Join 40 M users in the crypto craze discussion

💬 Engage with your favorite top creators

👍 See what interests you

Trending Topics

USSeptemberPPIBeatsExpectations

91.35k Views1.93k Discussing

US September PPI came in at 6.3% YoY, well above the 5.3% market expectation, pointing to renewed producer-side inflation pressure. Weekly jobless claims were 199K, broadly in line with forecasts. Could hotter inflation further reduce room for rate cuts, and what does it mean for $BTC, US stocks, and gold?

GateWCTCS9GlobalTradingCompetition

37.87k Views6.7k Discussing

GateBTCAndETHFuturesVolumeRanksTop3

53.8k Views1.82k Discussing

View More