Square
Following
Hot
News
Profile

Repanzal

vip
Active for: 1.7y
Peak Tier 5
No content yet
104
Following
3.4k
Followers
29.6k
Liked
#韩林博士受邀牛津大学辩论社演讲
🎓 From Crypto Innovation to the Future of Money: Dr. Han Lin at the Oxford Union
An extraordinary conversation is about to begin! Gate Founder and CEO Dr. Han Lin has been invited to speak at the prestigious Oxford Union on November 12, bringing the future of cryptocurrency, digital finance, and global value transfer into the spotlight.
With more than 200 years of debating history, the Oxford Union has hosted influential thinkers and world-changing figures. Dr. Han Lin’s upcoming appearance represents an important opportunity to discuss how blockchain technology can reshape t
GateSquare
🎓 Gate founder and CEO Dr. Han Lin was invited to speak at the Oxford Union
This debating society with over 200 years of history has welcomed world-changing figures such as Einstein, Hawking, and Churchill. World leaders, Nobel Prize winners, and representatives from various fields have all shared their views here.
This time, Dr. Han Lin will discuss the future of crypto and money, as well as how Gate Money will impact the way value flows around the world.
💬 If you were sitting in the audience and had only one chance to ask a question, what would you ask Dr. Han Lin?
Come to Gate Square, post with the topic #韩林博士受邀牛津大学辩论社演讲 , and share your questions and expectations. The speech has not yet begun, but the conversation has already started in the Square.
📍 November 12 | University of Oxford
👉 Event details
https://oxford-union.org/event-6845310
repost-content-media
#韩林博士受邀牛津大学辩论社演讲 #韩林博士受邀牛津大学辩论社演讲
🎓 From Crypto Innovation to the Future of Money: Dr. Han Lin at the Oxford Union
An extraordinary conversation is about to begin! Gate Founder and CEO Dr. Han Lin has been invited to speak at the prestigious Oxford Union on November 12, bringing the future of cryptocurrency, digital finance, and global value transfer into the spotlight.
With more than 200 years of debating history, the Oxford Union has hosted influential thinkers and world-changing figures. Dr. Han Lin’s upcoming appearance represents an important opportunity to discuss how blockchain technol
Repanzal | Short Trades Hit Take Profit as the Market Pulls Back
Finally, the market moved downward as expected, and our short strategies delivered results.
Trade Recap:
- SOL: Shorted at 108.5 — Take profit hit.
- BTC: Shorted at 84,100 — Take profit hit.
- ETH: Shorted at 2,518 — Take profit hit.
- ETH Additional Entry: Added to the short at 2,533 — Take profit hit.
Another reminder that patience and disciplined execution matter. Waiting for the right setup and respecting the trading plan can make all the difference when the market finally moves in the anticipated direction.
Congratulations
SOL-3.70%
BTC+0.18%
ETH-1.44%
  • 1
Crypto ETFs Record $1.25B in Weekly Outflows: Why Are XRP and NEAR Moving Against the Trend?
1. Institutional Capital Is Shifting, Not Simply Disappearing
The crypto ETF market is sending a significant signal as of October 13, 2026. Approximately $1.25 billion flowed out of major crypto spot ETFs during the reported period, highlighting growing caution among institutional investors amid macroeconomic uncertainty and changing risk expectations.
Bitcoin spot ETFs recorded $681.1 million in weekly net outflows, while Ethereum spot ETFs saw $542.07 million in net outflows. Ethereum’s cumulative ou
#TomLeeWarnsKoreanStockSelloffMaySpillIntoCrypto
South Korea’s Market Shock: $803M Crypto Liquidations and a Global Risk-Off Warning
1. South Korea’s Stock Market Sell-Off Raises Global Risk Concerns
South Korea’s stock market suffered a sharp sell-off on October 13, 2026, as mounting concerns over semiconductor valuations, AI financing, and foreign capital outflows intensified selling pressure.
The KOSPI plunged 5.46% to close at 6,035.35, while the Korea Exchange activated its sell-side sidecar mechanism at 9:47:58 a.m., temporarily suspending program trading for five minutes after KOSPI 20
post-image
Repanzal | October 13 BTC & ETH Market Analysis: Long and Short Strategies Deliver Profits
Market Review: Short First, Then Long
Yesterday’s strong rebound in Bitcoin and Ethereum created opportunities in both directions. As previously anticipated, the market pulled back toward 81,000 for BTC and 2,410 for ETH during the early session, allowing short positions to capture gains.
After closing the shorts, the strategy shifted to long positions to take advantage of the subsequent recovery. Ethereum positions were closed around 2,490, meaning the entire upward move was not captured. Nevertheless,
BTC+0.18%
ETH-1.44%
SNDK-5.98%
  • 2
#每周来晒
#每周来晒 #GateX红牛F1新加坡站夺冠
Verstappen Breaks the Singapore Curse, While Gate Shows Its Strategic Vision
1. A Long-Awaited Victory: Verstappen Conquers Marina Bay
Singapore’s Marina Bay Street Circuit has long been one of the most challenging venues on Max Verstappen’s Formula 1 calendar. This time, he delivered a commanding performance, converting pole position into victory and adding another milestone to his remarkable Grand Prix career.
The opening laps brought immediate pressure. Charles Leclerc launched an aggressive challenge, testing Verstappen’s defensive skills and race control. How
post-image
#每周来晒 #GateX红牛F1新加坡站夺冠 #WCTCS9
Gate Singapore is going viral again—can Max take my GT to the moon?
When Verstappen crossed the finish line at the Singapore Grand Prix, securing the 73rd race victory of his career and his first-ever Singapore Grand Prix win, the news spread throughout the global motorsport community. At the same time, images of Gate founder Dr. Han celebrating this historic moment alongside Max and Isack Hadjar at the Red Bull Racing team venue also went viral across the Web3 industry and among motorsport enthusiasts. From the Red Bull driver meet-and-greet at TOKEN2049 Singap
LittleGodOfWealthPlutus
#每周来晒 #GateX红牛F1新加坡站夺冠 #WCTCS9
Gate Singapore is going viral again—can Max take my GT to the moon?
When Verstappen crossed the finish line at the Singapore Grand Prix, securing the 73rd race victory of his career and his first-ever Singapore Grand Prix win, the news spread throughout the global motorsport community. At the same time, images of Gate founder Dr. Han celebrating this historic moment alongside Max and Isack Hadjar at the Red Bull Racing team venue also went viral across the Web3 industry and among motorsport enthusiasts. From the Red Bull driver meet-and-greet at TOKEN2049 Singapore to accompanying the team throughout its run to this highly significant championship trophy, Gate, as Red Bull Racing’s long-term official partner, has successfully taken its cross-sector visibility beyond its original circle. As the platform ecosystem continues to unlock value, the logic underpinning GT’s value is also being reassessed by the market.
From breaking out through racing to ecosystem integration: Gate’s cross-sector collaboration is more than simple brand exposure
Many initially viewed Gate’s partnership with the Red Bull F1 team as ordinary sports marketing, but from the driver meet-and-greet at TOKEN2049 to its deep involvement throughout the Singapore Grand Prix celebrations, the value of this partnership has long extended far beyond “advertising.”
At the TOKEN2049 Singapore event, Gate had already created the first deep connection between Web3 users and the world’s top motorsport community: World Champion Verstappen and his teammate Isack Hadjar visited Gate’s exclusive Lounge, interacting face-to-face and taking signed photos with industry users and racing fans from around the world. This directly opened up top-tier resources that had previously been limited to the F1 paddock to Gate platform users. Gate’s core team attending the Red Bull team’s P room and celebrating the Singapore victory together further elevated the depth of the partnership to a new level—this was not a brief appearance during the event, but rather a long-term partner standing alongside the team during its moment of victory and sharing in this historic honor.
This level of cross-sector collaboration brings Gate long-term and diverse benefits: it has enabled Gate’s brand influence to break completely out of the traditional niche crypto industry and penetrate the global F1 audience of hundreds of millions, turning the combined strengths of a “Web3 platform + top-tier sports IP” into a unique differentiated brand asset for the platform. The influx of new users and increased brand trust generated by this expansion will ultimately translate into tangible improvements in platform activity, laying a solid foundation for value growth across the entire ecosystem.
The ecosystem’s fundamentals continue to strengthen, and GT’s value support has long gone beyond a single narrative
As the core native asset of the Gate ecosystem, GT’s value has never been supported merely by speculation around hot events. Its underlying fundamentals have already formed a solid, multi-layered support system through years of operations.
From the perspective of its core tokenomics framework, GT’s deflationary strength has consistently ranked among the top platform tokens: as of September 2026, more than 189 million GT had been burned, accounting for 63.32% of the initial total supply, with the total value of burned tokens exceeding $1.3 billion. This dual-engine mechanism of “quarterly platform-profit buybacks + simultaneous burning linked to on-chain gas consumption” will continue to reduce GT’s actual circulating supply as the platform’s business expands, creating a long-term deflationary floor.
In terms of practical use cases, GT has long moved beyond its positioning as a mere “platform benefits credential”: it is the core asset that enables users on the Gate.io exchange to unlock VIP trading-fee discounts, gain priority access to early-stage projects, and participate in platform airdrops. It is also the native fuel of the GateChain public blockchain and Gate Layer2 network, supporting smart-contract execution, asset transfers, and staking yields throughout the decentralized ecosystem. Spanning the two major use cases of centralized trading services and decentralized Web3 infrastructure, its real-world demand has continued to grow steadily.
GT’s previous price performance has also confirmed the resilience of these fundamentals: GT was priced at approximately $6.42 in June 2026, but had climbed above $10 by September, gaining more than 70% in just three months. This steadily rising market action was essentially the market pricing in advance the continued improvement of the Gate ecosystem.
The championship win’s hot momentum combines with ecosystem benefits, opening a new round of GT value reassessment
The attention generated by this Singapore victory has effectively added another boost to the Gate ecosystem, which had already been steadily strengthening.
F1’s audience of hundreds of millions worldwide will gain its first deep exposure to the Gate brand through this high-profile championship moment, bringing a large influx of new users to the platform and directly driving further growth in platform trading volume and activity. In turn, increased platform revenue will further expand the scale of GT’s quarterly buybacks and burns, creating a positive cycle of “business growth—increased burns—reduced circulating supply.”
At the same time, Gate can fully leverage the championship IP created by its deep partnership with Red Bull Racing to launch a series of Web3 innovations related to F1 events: for example, championship-themed digital collectibles, GT-exclusive holding campaigns tied to event benefits, and racing-themed on-chain interactive experiences. These new use cases will generate substantial additional demand for GT and further expand the boundaries of its utility.
Over the long term, the value of partnerships with top-tier sports IP has never been limited to a one-off short-term trend. They bring platforms years of sustained brand premium and user retention. As the Gate ecosystem reaches another level following this expansion beyond its original audience, the logic underpinning GT’s value will become even more robust, and the market’s assessment of its value will naturally rise to a new level.
It should of course be made clear that the crypto asset market always carries volatility risks. The sentiment-driven momentum generated by major events must resonate with the continued delivery of fundamental value to support a long-term market trend. However, given Gate’s current ecosystem strategy, the continued advancement of its deflationary mechanism, and the expansion benefits generated by this Red Bull partnership, GT’s value-growth narrative has entered an entirely new phase of realization.$GT
repost-content-media
GT-2.90%
  • 1
#GateXRedBullWinsSingaporeGP
#GateX红牛F1新加坡站夺冠
Gate × Red Bull F1: Turning Global Exposure into Lasting Brand Value
Beyond Sponsorship: Building a Global Brand Through Trust and Performance
Gate’s partnership with Oracle Red Bull Racing represents far more than a conventional sports sponsorship. It reflects a broader strategic shift from purchasing advertising visibility to building long-term brand credibility, strengthening user engagement, and establishing a stronger presence in mainstream global culture. By aligning itself with one of motorsport’s most recognizable teams, Gate is positionin
GT-2.90%
ORCL-2.88%
🏎️ 100% Win! Gate Square “Share Weekly” Special Topic is Ongoing!
💰️ Post with hashtags for red packets, Up to 2 USDT per user!
Up to 100 USDT on the weekly leaderboard!
📌 How to Join
1️⃣ Register: https://www.gate.com/campaigns/6244
2️⃣ Post with #ShareWeekly and #GateXRedBullWinsSingaporeGP
💬 Topic
Max takes his 73rd career win at Marina Bay! Gate celebrates this F1 milestone with Red Bull Racing.
💡 Share Your Thoughts
1️⃣ How do you rate Max’s performance?
2️⃣ What F1 × Web3 ideas would you like to see from Gate?
Limited red packets, first come, first served!
👉 https://www.gate.com/
Gate_Square
🏎️ 100% Win! Gate Square “Share Weekly” Special Topic is Ongoing!
💰️ Post with hashtags for red packets, Up to 2 USDT per user!
Up to 100 USDT on the weekly leaderboard!
📌 How to Join
1️⃣ Register: https://www.gate.com/campaigns/6244
2️⃣ Post with #ShareWeekly and #GateXRedBullWinsSingaporeGP
💬 Topic
Max takes his 73rd career win at Marina Bay! Gate celebrates this F1 milestone with Red Bull Racing.
💡 Share Your Thoughts
1️⃣ How do you rate Max’s performance?
2️⃣ What F1 × Web3 ideas would you like to see from Gate?
Limited red packets, first come, first served!
👉 https://www.gate.com/post/topic/GateXRedBullWinsSingaporeGP?topic_id=205782
repost-content-media
81150/2415 precisely secured a strong opening
live-replay-cover
658 views10-13 05:40
00:56:10
BTC Market Update: Rebound Faces Strong Resistance
Markets never move in a straight line, and other people’s analysis should serve only as a reference. Every trading decision ultimately comes with personal responsibility. Staying calm and following your own strategy is more important than reacting to market noise.
BTC rebounded strongly after dropping to 80,900, showing signs of a short-term recovery. However, overhead resistance remains significant.
On the 1-hour chart, BTC continues to trade below its short-term moving averages, which remain bearishly aligned. Momentum indicators are still w
BTC+0.16%
  • 4
Is the Bullish Trend Real? Then Why the Wick?
According to analyst Murphy, new Bitcoin buyers accumulated around 400,000 BTC over the past two months, bringing their total holdings to 4.27 million BTC. Momentum buyers also returned in September after an eight-month absence.
These figures suggest that buying interest may be recovering, but why is BTC still showing sharp price rejections?
The answer is simple: accumulation does not mean prices can only rise. Profit-taking, resistance, and leveraged liquidations can trigger sudden pullbacks even when long-term demand remains strong.
The key is to
BTC+0.16%
  • 4
#GateWCTCS9GlobalTradingCompetition
#WCTCS9 #BTC Bitcoin Pulls Back Again: Is the Short-Term Rally Losing Momentum?
1. Long-Term Potential Remains, but Short-Term Risks Are Rising
Bitcoin has once again come under selling pressure, raising concerns about whether its recent rebound can continue. While the long-term outlook remains a subject of optimism among some analysts, short-term market conditions suggest that investors should remain cautious.
Some market observers believe Bitcoin could reclaim its all-time high before mid-2027 and potentially establish a new cycle peak in 2028. Historical
post-image
BTC+0.16%
  • 4
#韩股大跌你会抄底吗
Korean Stocks: A Spectacular Rally, a Brutal Crash — Is It Time to Buy the Dip?
#每周来晒
From Market Euphoria to a Sudden Reversal
South Korea’s stock market has experienced an extraordinary boom-and-bust cycle, exposing the risks hidden beneath one of the year’s most powerful market rallies. The KOSPI’s rapid ascent to record territory was fueled by enthusiasm surrounding artificial intelligence, booming memory-chip demand, and the global importance of Samsung Electronics and SK hynix. Yet the subsequent sell-off has raised a much more fundamental question: Was the market simply over
  • 3
#韩股大跌你会抄底吗
Korean Stock Market Plunge: Is It Time to Buy the Dip?
Short-Term Risks Remain Elevated
South Korea’s KOSPI Index has experienced a sharp decline, putting major semiconductor companies, including Samsung Electronics and SK hynix, under considerable pressure. While the sell-off may create attractive entry opportunities, investors must determine whether it represents a temporary market correction or a more fundamental shift in the semiconductor industry.
Several factors have contributed to the downturn, including weakness in U.S. semiconductor stocks, continued net selling by foreign
  • 5
#BTCUp1.17%
BTC MARKET ANALYSIS: 1.17% GAIN, CPI COUNTDOWN, AND THE NEXT BIG MOVE
Market Date: October 12, 2026
Bitcoin is approaching a critical market decision as traders prepare for the US CPI inflation report scheduled for October 14. BTC's recent 1.17% increase suggests improving short-term momentum, but the real question is whether buyers can sustain the recovery and push the market toward higher resistance levels.
My trading view is cautiously bullish, provided Bitcoin holds support, buying volume strengthens, and the upcoming inflation data does not trigger a major deterioration in ma
HighAmbition
#BTCUp1.17%
BTC MARKET ANALYSIS: 1.17% GAIN, CPI COUNTDOWN, AND THE NEXT BIG MOVE
Market Date: October 12, 2026
Bitcoin is approaching a critical market decision as traders prepare for the US CPI inflation report scheduled for October 14. BTC's recent 1.17% increase suggests improving short-term momentum, but the real question is whether buyers can sustain the recovery and push the market toward higher resistance levels.
My trading view is cautiously bullish, provided Bitcoin holds support, buying volume strengthens, and the upcoming inflation data does not trigger a major deterioration in market sentiment.
BITCOIN'S CURRENT MARKET POSITION
Recent market snapshots placed BTC near $83,900, with one reported reading around $83,919 and a 24-hour gain of approximately 1.25%.
The same snapshot reported a market capitalization near $1.69 trillion and 24-hour trading volume of approximately $13.15 billion. These figures are time-sensitive and may differ across data providers.
Bitcoin's broader performance provides important context. A recent snapshot showed BTC down approximately 3.16% over seven days while remaining more than 8% higher over 30 days.
This suggests that the market has experienced a meaningful monthly recovery but is still facing short-term selling pressure. Buyers are attempting to stabilize the price, yet a sustained bullish reversal requires stronger confirmation.
WHAT DOES BTC'S 1.17% INCREASE MEAN?
A 1.17% increase means Bitcoin has moved higher relative to its starting price. This can reflect increased buying demand, short covering, or improving investor confidence.
For example, if BTC starts at $85,000, a 1.17% gain adds $994.50, bringing the price to approximately $85,994.50.
This is a mathematical example, not Bitcoin's current price.
A percentage gain alone cannot confirm a sustained bullish trend.
Rising spot volume, stronger market structure, and a successful resistance breakout would provide more convincing evidence.
If BTC rises on weak volume and quickly loses its gains, the move could be a temporary recovery rather than the beginning of a stronger rally.
KEY SUPPORT AND RESISTANCE LEVELS
The following are analytical reference zones based on recent price structure, not guaranteed turning points.
Current decision zone: $83,000-$84,500.
Holding this region would help buyers preserve short-term momentum. A decisive breakdown could weaken the recovery.
First resistance: $85,000.
A sustained breakout above this level with stronger volume could attract additional buyers and open the way toward higher resistance.
Higher resistance: $86,000-$87,400.
If BTC clears $85,000 and holds the breakout, this zone becomes the next area to monitor. A successful retest would strengthen the bullish setup.
Potential downside support: $82,000-$82,700.
If Bitcoin loses its nearby support, this region could become relevant as the next potential demand area.
Major historical reference: Around $80,300.
Recent market data recorded a low near this level on October 8. A return toward it would suggest that selling pressure has increased.
The key signal is not simply touching resistance. Bitcoin needs to break above it, maintain a strong close, and demonstrate that buyers can defend the reclaimed level.
OCTOBER 14 CPI: WHY IT MATTERS
The US Bureau of Labor Statistics has scheduled the September 2026 Consumer Price Index release for October 14 at 8:30 a.m. Eastern Time, equivalent to 5:30 p.m. Pakistan time.
Recent reporting cited expectations for headline inflation to rise to approximately 3.7% year over year from 3.4%, while core inflation was forecast near 2.5%, compared with 2.4% previously. These are reported forecasts, not actual results.
CPI matters because inflation influences expectations for Federal Reserve policy.
If inflation comes in cooler than expected, investors may anticipate less restrictive monetary policy.
Treasury yields could decline, risk appetite could improve, and Bitcoin could benefit.
If inflation comes in hotter than expected, markets may anticipate higher interest rates for longer.
Rising Treasury yields and a stronger US dollar could put pressure on BTC.
Markets respond to the difference between actual data and expectations, not simply whether the headline number appears high or low.
THREE POSSIBLE BTC SCENARIOS AFTER CPI
BULLISH SCENARIO: COOLER INFLATION
A cooler CPI reading could improve risk sentiment and support Bitcoin's recovery. If BTC holds $83,000-$84,000 and breaks $85,000 with strong volume, the next areas to monitor would be $86,000-$87,400.
If momentum remains strong beyond that region, $90,000 could become a broader upside objective.
This would require continued buying demand and confirmation from the market.
BEARISH SCENARIO: HOTTER INFLATION
A hotter CPI reading could increase concerns about persistent inflation and delay expectations for monetary easing.
If BTC decisively breaks below $83,000, the $82,700 area could come into focus, followed by the broader $80,300-$82,000 region if selling accelerates.
A temporary decline does not automatically confirm a long-term bearish trend, but losing support would weaken the immediate bullish outlook.
NEUTRAL SCENARIO: CPI MATCHES EXPECTATIONS
If inflation matches forecasts, Bitcoin could initially move in either direction. Traders may then focus on core inflation, Treasury yields, dollar strength, institutional flows, and derivatives positioning.
In this situation, confirmed technical breakouts may provide clearer directional signals than the headline number alone.
VOLUME, LIQUIDITY, AND MARKET STRUCTURE
Spot volume is essential for evaluating the quality of Bitcoin's recovery. Rising prices accompanied by stronger spot volume would support the bullish case, while a rally on declining volume would require caution.
Liquidity around previous highs and lows can trigger rapid price movements as stop orders and leveraged positions are activated. A brief move above resistance is not necessarily a breakout; price must sustain itself above the level.
Higher highs and higher lows would strengthen the bullish structure. Lower highs followed by a decisive support breakdown would suggest that sellers are regaining control.
CPI can also create sudden volatility, wider spreads, and quick reversals, making confirmation particularly important.
FUTURES, OPEN INTEREST, FUNDING, AND LIQUIDATIONS
A recent market snapshot reported BTC futures open interest near $51.88 billion and a funding rate around 0.0013% per four hours. These are snapshot figures, not verified live readings.
Rising open interest alongside price can indicate new positions entering the market, but it does not independently establish whether those positions are bullish or bearish.
If price rises while open interest declines, short covering may be contributing to the rally. Excessively positive funding can indicate crowded long positioning, while negative funding alongside price stabilization may create conditions for a short squeeze.
Long liquidations can accelerate declines, while short liquidations can intensify upside moves. I would prefer to see a resistance breakout supported by healthy spot volume and sustainable derivatives positioning.
ETF FLOWS AND INSTITUTIONAL DEMAND
Recent reporting indicated approximately $21.1 million in net inflows into US spot Bitcoin ETFs on October 9, although cumulative October flows remained negative in the cited period.
This mixed picture means institutional demand still needs confirmation. Consistent ETF inflows alongside rising BTC prices would strengthen the recovery narrative.
If Bitcoin rises while institutional flows remain weak, the rally may be more vulnerable to profit-taking.
Treasury yields, dollar strength, geopolitical developments, and energy prices should also be monitored because they can influence broader risk appetite.
MY BTC TRADING STRATEGY
My directional bias is cautiously bullish, provided Bitcoin maintains support and confirms strength above resistance.
I would monitor three conditions:
First, BTC should hold the $83,000-$84,000 region rather than immediately surrendering its recovery.
Second, buyers should push above $85,000 with stronger volume and a sustained price close.
Third, the October 14 CPI release should not trigger a significant deterioration in liquidity, Treasury yields, or investor sentiment.
If these conditions align, $86,000-$87,400 becomes an important upside area, with $90,000 a possible higher objective if the breakout continues.
If BTC decisively loses $83,000, I would reduce confidence in the bullish setup and monitor $82,700 and $80,300 for potential support.
Around CPI, excessive leverage and chasing the first price spike can be risky. Waiting for confirmation and managing position size are more disciplined approaches.
These levels are scenario-based references, not guaranteed targets or personalized financial advice.
FINAL OUTLOOK: WHERE COULD BITCOIN GO NEXT?
Bitcoin's 1.17% increase is an encouraging short-term signal, but it does not guarantee another rally.
The market still needs confirmation from technical structure, spot demand, derivatives positioning, institutional flows, and macroeconomic conditions.
My base case remains cautiously bullish if BTC holds support and reclaims $85,000 with convincing volume.
Cooler-than-expected inflation combined with sustained buying could help Bitcoin challenge $86,000-$87,400 and potentially move toward $90,000. Hotter inflation could weaken the recovery and expose lower support levels, while an in-line reading may leave the market trading according to positioning and technical structure.
For Gate traders, the priority is to monitor price action, volume, liquidity, and macroeconomic developments instead of relying on a single percentage gain or an unconfirmed prediction.
The October 14 CPI report could become a major catalyst, but Bitcoin's reaction after the release will matter more than speculation beforehand. Stay disciplined, verify live market data, and let price confirmation guide your trading decisions.#WCTCS9 #GateWCTCS9GlobalTradingCompetition #PlanYourTradesThisWeek
repost-content-media
  • 3
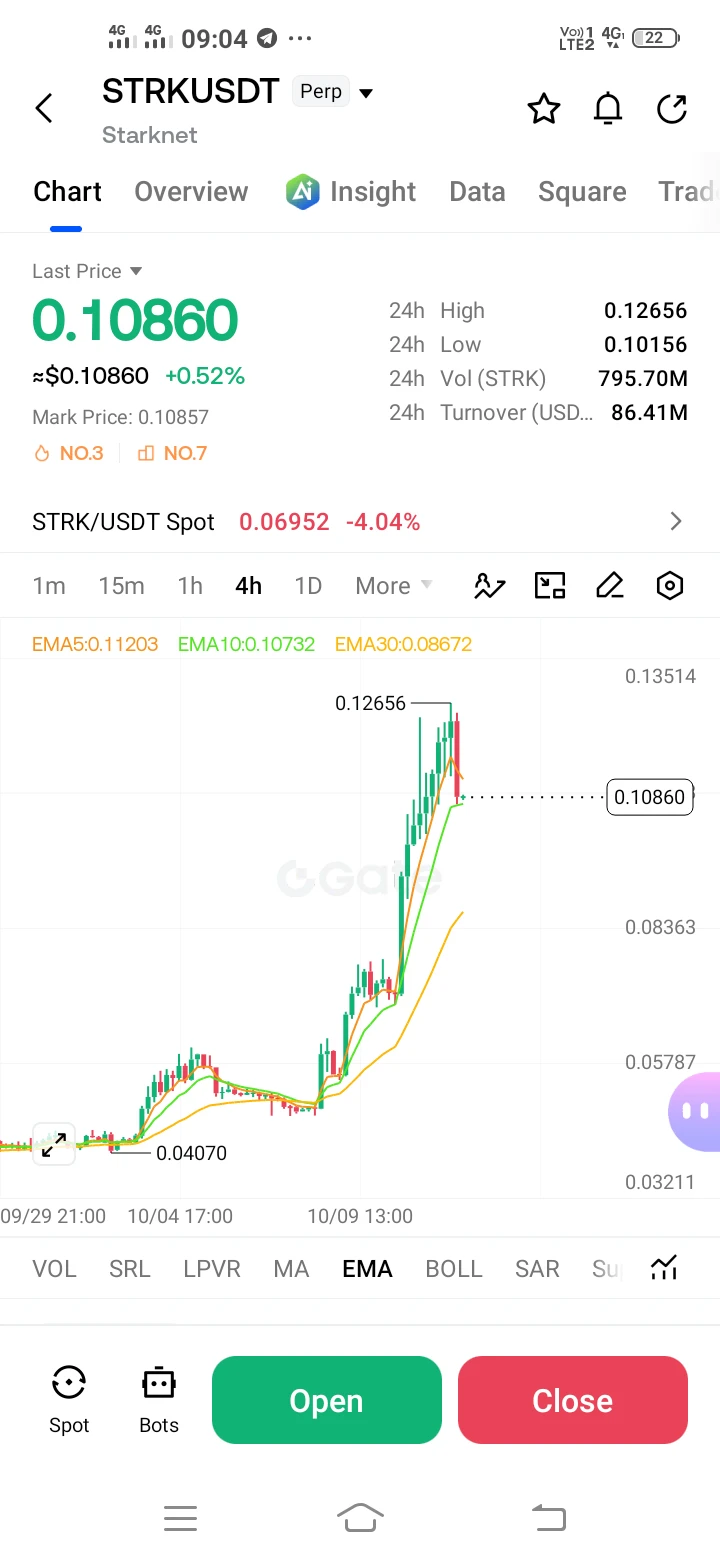
#STRKUpOver55%in24Hours
Starknet (STRK) has attracted renewed market attention after a sharp upward move. The key question now is whether buyers can maintain momentum and push the price through resistance, or whether short-term traders will begin taking profits after the rally.
My analysis focuses on STRK’s 24-hour price range, trading activity, important support and resistance levels, bullish and bearish scenarios, and a practical trading strategy. The objective is to understand what the market is communicating instead of blindly following a green candle.
STRK PRICE SNAPSHOT
Current price: A
HighAmbition
#STRKUpOver55%in24Hours
Starknet (STRK) has attracted renewed market attention after a sharp upward move. The key question now is whether buyers can maintain momentum and push the price through resistance, or whether short-term traders will begin taking profits after the rally.
My analysis focuses on STRK’s 24-hour price range, trading activity, important support and resistance levels, bullish and bearish scenarios, and a practical trading strategy. The objective is to understand what the market is communicating instead of blindly following a green candle.
STRK PRICE SNAPSHOT
Current price: Approximately $0.115–$0.116 24-hour high: $0.1227 24-hour low: $0.1008 24-hour trading volume: Approximately $726 million 24-hour performance: The exact percentage varies by data snapshot, so confirm the latest figure before publishing.
These figures show that STRK has experienced a wide trading range. The difference between the 24-hour low of $0.1008 and the high of $0.1227 is approximately 21.73% relative to the low. This highlights the potential opportunity and risk involved in trading a volatile asset.
Prices and volume can change quickly across market data providers. Treat this snapshot as a reference rather than a guaranteed live execution quote.
WHAT DOES STRK’S PRICE ACTION TELL US?
STRK’s move from $0.1008 toward $0.1227 suggests that buyers were willing to pursue higher prices during the observed period. However, a strong move alone does not prove that a sustainable uptrend has started.
The most important question is how STRK behaves near resistance. If buyers continue entering the market and price holds above reclaimed support levels, the rally may have room to extend. If volume weakens and price repeatedly fails near the recent high, profit-taking could lead to a pullback.
My trading view is to remain cautiously bullish while the price structure holds above nearby support, but I would not treat the 24-hour rally as a guarantee of further gains.
KEY SUPPORT AND RESISTANCE LEVELS
Immediate resistance: $0.1200–$0.1227
This is the first important zone to monitor. STRK has already reached $0.1227 during the observed 24-hour period. A decisive breakout above this area, supported by strong volume and a successful retest, would strengthen the bullish case.
First support: $0.1120–$0.1100
This is a nearby area to watch for potential consolidation. If STRK pulls back and buyers defend this zone, the market may establish a stronger base for another attempt at resistance. These are monitoring levels, not confirmed support.
Major reference support: $0.1008
This is the reported 24-hour low. A return to this level would indicate that a substantial portion of the recent advance had been surrendered. A clean breakdown below it could increase selling pressure and weaken the bullish structure.
Potential upside checkpoints: $0.1250 and $0.1300
These are conditional reference targets, not guaranteed outcomes. STRK would first need to break and sustain movement above $0.1227. Without confirmation, these levels should not be treated as inevitable destinations.
BULLISH SCENARIO: WHAT COULD HAPPEN NEXT?
My bullish scenario depends on confirmation rather than excitement.
First, STRK needs to maintain buying interest above the $0.1100–$0.1120 area. Second, trading volume should remain supportive as price approaches $0.1200. Third, buyers need to break the $0.1227 high and demonstrate that the former resistance can act as support.
If these conditions develop, $0.1250 becomes an initial upside reference, followed by $0.1300 if momentum continues. A sustained breakout with expanding volume would make this scenario more convincing.
However, if STRK reaches resistance on declining volume or produces repeated upper wicks, I would be cautious about entering late. A breakout that immediately falls back below resistance may become a false breakout.
BEARISH SCENARIO: WHEN SHOULD TRADERS BE CAREFUL?
The bearish scenario begins if STRK fails to hold its nearby support and selling pressure increases.
A sustained move below $0.1100 would weaken the short-term structure and could expose lower prices. If the $0.1008 low is also broken decisively, the recent rally would face a more serious technical challenge.
Traders should also watch for a rapid price rise accompanied by weakening volume, excessive leverage, or a sudden increase in volatility. These conditions can lead to sharp reversals.
A pullback does not automatically mean the entire trend has turned bearish. The key is whether price finds support and forms a credible recovery, or continues producing lower highs and lower lows.
STRK TRADING STRATEGY
For spot traders: Avoid buying simply because the price has already risen sharply. Consider waiting for a confirmed breakout above $0.1227 or a controlled pullback that holds a support area. Use position sizing appropriate to your risk tolerance.
For futures traders: Leverage increases both potential gains and potential losses. Wait for confirmation from price action and volume, define your invalidation level before entering, and avoid risking too much capital on a single trade.
For breakout traders: A candle moving above $0.1227 is not enough on its own. Watch whether price sustains the breakout and whether a retest attracts buyers. Failed breakouts can trap late buyers.
For pullback traders: Monitor the $0.1120–$0.1100 region. A bounce is more meaningful when buyers defend the area and price begins forming higher lows. If support fails, reassess rather than averaging down automatically.
Risk management matters more than predicting every short-term move. There is no guaranteed entry, target, or profit in a volatile market.
WHY VOLUME MATTERS
The reported 24-hour trading volume of approximately $726 million indicates substantial activity in the observed snapshot. Volume can help traders evaluate whether a price move has meaningful participation, but it does not reveal market direction by itself.
Rising price with expanding volume can support a breakout. Rising price with fading volume may suggest that momentum is losing strength. Heavy volume during a decline can indicate strong selling pressure, although the broader price structure must also be considered.
Volume figures can differ between exchanges, trading pairs, and data providers. Always compare figures from the same source when assessing changes over time.
WHAT SHOULD STRK HOLDERS WATCH?
STRK traders should follow broader cryptocurrency market sentiment, Bitcoin’s direction, liquidity conditions, and Starknet ecosystem developments. News about network adoption, ecosystem activity, token supply, or unlock schedules may influence expectations, but the market response depends on what is already priced in.
A positive headline does not automatically create a sustainable rally. Likewise, a temporary correction does not necessarily invalidate a strong structure. Price confirmation remains essential.
I would focus on three questions: Is STRK holding support? Are buyers defending higher lows? Can price break $0.1227 with convincing volume? The answers will help determine whether the rally is strengthening or losing momentum.
MY FINAL STRK MARKET VIEW
My short-term view is cautiously bullish while STRK holds above the nearby $0.1100–$0.1120 support area. The reported $0.1227 high is the immediate breakout level, while $0.1008 remains the key reference from the latest 24-hour range.
A confirmed breakout could open a path toward $0.1250 and potentially $0.1300. On the other hand, rejection at resistance followed by a loss of support could trigger a deeper correction.
I would not chase the market blindly. I would wait for a clear setup, confirm the price action, monitor volume, and manage risk carefully.
The most important lesson is simple: a strong rally creates opportunity, but discipline determines how traders respond to it.
STRK is worth monitoring, but the next move must be confirmed by the market. Trade the structure, respect volatility, and never assume that yesterday’s momentum guarantees tomorrow’s direction.
Data note: The price snapshot used here lists STRK near $0.115–$0.116, a 24-hour high of $0.1227, a low of $0.1008, and approximately $726 million in volume. #ShareWeekly #PlanYourTradesThisWeek
repost-content-media
  • 3
#WillYouBuyDipInKoreanStocks
KOREAN STOCKS IN A DEEP CORRECTION: SAMSUNG AT 188 USDT, SK HYNIX AT 1,202 USDT — THE BUY-THE-DIP OPPORTUNITY OR A WARNING SIGN?
The Korean stock market has reached a defining moment. Two of the world's most important semiconductor companies, Samsung Electronics and SK Hynix, have come under heavy selling pressure. The KOSPI has fallen sharply, foreign investors are reducing exposure, and the market is questioning whether the AI-driven semiconductor rally can maintain its momentum.
But here is the question every serious investor should ask: When strong companies f
HighAmbition
#WillYouBuyDipInKoreanStocks
KOREAN STOCKS IN A DEEP CORRECTION: SAMSUNG AT 188 USDT, SK HYNIX AT 1,202 USDT — THE BUY-THE-DIP OPPORTUNITY OR A WARNING SIGN?
The Korean stock market has reached a defining moment. Two of the world's most important semiconductor companies, Samsung Electronics and SK Hynix, have come under heavy selling pressure. The KOSPI has fallen sharply, foreign investors are reducing exposure, and the market is questioning whether the AI-driven semiconductor rally can maintain its momentum.
But here is the question every serious investor should ask: When strong companies fall, is the market offering a discount—or warning us that expectations have become too high?
My view: The long-term AI and memory-chip opportunity remains important, but the next entry deserves careful analysis. I am interested in the dip, not blindly bullish on every falling candle.
1. THE LATEST MARKET NUMBERS: SELLING PRESSURE IS REAL
South Korea's October 12 session delivered a clear warning to investors.
KOSPI Index
Closing level: 6,384.24
Daily change: -3.65%
Points lost: 241.69
Intraday low: 6,368.49
Losing streak: Four consecutive sessions
Trading value: Approximately 21.33 trillion KRW
Foreign investor net selling: Approximately 2.02 trillion KRW
Samsung Electronics
Gate reference price: 188 USDT
Korean-market daily change: -4.39%
SK Hynix
Gate reference price: 1,202 USDT
Korean-market daily change: -4.52%
The comparison matters. Samsung fell 4.39%, SK Hynix lost 4.52%, and the KOSPI declined 3.65%. Both semiconductor leaders experienced greater selling pressure than the broader benchmark.
These are significant moves for companies at the center of the AI hardware investment story. They show that strong industry narratives do not protect stocks from sudden repricing.
Important pricing note: The 188 USDT Samsung price and 1,202 USDT SK Hynix price are the Gate reference prices supplied for this post. The daily percentage changes above refer to the Korean-market session, not verified percentage changes on Gate. The two markets should not be treated as having identical price movements.
2. WHY ARE KOREAN SEMICONDUCTOR STOCKS FALLING?
The decline reflects a combination of profit-taking, changing expectations, competition concerns, and macroeconomic uncertainty.
First, the market is reassessing the AI trade.
Artificial intelligence requires advanced processors, high-bandwidth memory, data-center infrastructure, and enormous computing capacity. This has supported demand for semiconductor products and helped investors become more optimistic about industry earnings.
However, when expectations rise dramatically, even impressive financial results may not be enough to keep share prices climbing. Investors are asking how much future growth is already reflected in valuations and whether today's demand can be sustained.
Second, competition is becoming more important.
Chinese memory-chip producer ChangXin Memory Technologies has reported progress in memory technology. Greater competition could eventually affect pricing power, market share, and profit margins across the industry. This does not automatically mean that established leaders will lose their positions, but it gives investors another risk to evaluate.
Third, macroeconomic pressure is influencing sentiment.
Elevated oil prices and inflation concerns can affect interest-rate expectations and technology valuations. Foreign investors also sold approximately 2.02 trillion KRW of Korean equities on October 12, adding pressure to the market.
My interpretation is that this is a battle between two forces: the long-term demand for AI infrastructure and the short-term risk of excessive expectations, profit-taking, and market uncertainty.
3. SAMSUNG AT 188 USDT: A POTENTIAL RECOVERY STORY
Samsung is a major technology business with exposure to memory chips, smartphones, consumer electronics, and other semiconductor products. Its diversified operations distinguish it from companies focused more narrowly on memory.
The latest earnings guidance makes the situation particularly interesting.
On October 8, Samsung announced preliminary third-quarter 2026 guidance of approximately:
Revenue: 195 trillion KRW
Operating profit: 107.4 trillion KRW
Year-over-year operating-profit growth: Approximately 782.5%
These are extraordinary headline figures. Yet the market has continued to react to concerns about the durability of the AI-driven earnings boom, competition, currency effects, and future profitability.
That is the difference between a strong company and a strong entry price.
At the Gate reference price of 188 USDT, I would monitor whether Samsung can establish a stable base rather than assuming the decline has already ended.
My three confirmation signals are:
Price structure: Does the stock stop making lower lows and begin forming higher lows?
Buying participation: Does a recovery attract stronger volume rather than fading after a short bounce?
Earnings outlook: Does memory demand remain strong enough to support future profitability?
If these signals improve together, the potential risk-reward picture becomes more attractive. If selling continues and support breaks, patience may offer a better opportunity than rushing into the market.
4. SK HYNIX AT 1,202 USDT: THE HIGH-IMPACT AI MEMORY PLAY
SK Hynix is closely associated with advanced memory, including high-bandwidth memory used in AI computing systems. As AI infrastructure expands, memory performance and capacity become increasingly important.
That provides a powerful long-term investment narrative—but it does not eliminate valuation risk.
At the Gate reference price of 1,202 USDT, I would focus on three questions.
Can demand for advanced memory remain strong? Can SK Hynix maintain its competitive position as the industry evolves? And can the stock stabilize after its 4.52% Korean-market decline?
A sustained rebound would be more convincing if accompanied by stronger buying volume, improving price structure, and supportive industry developments.
A brief green candle alone would not be enough for me to declare that the correction is over.
My comparison is straightforward: Samsung offers broader technology exposure, while SK Hynix provides a more concentrated investment case around memory and AI infrastructure. Both have potential, but their valuations, business risks, and price behavior must be considered separately.
5. WHAT IF THE STOCKS REBOUND BY 5% OR 10%?
Let's calculate possible price scenarios from the reference prices provided.
SAMSUNG — Starting reference: 188 USDT
A 3% rise: 193.64 USDT
A 5% rise: 197.40 USDT
A 10% rise: 206.80 USDT
A 15% rise: 216.20 USDT
SK HYNIX — Starting reference: 1,202 USDT
A 3% rise: 1,238.06 USDT
A 5% rise: 1,262.10 USDT
A 10% rise: 1,322.20 USDT
A 15% rise: 1,382.30 USDT
Now consider the opposite scenario.
SAMSUNG
A 3% decline: 182.36 USDT
A 5% decline: 178.60 USDT
A 10% decline: 169.20 USDT
SK HYNIX
A 3% decline: 1,165.94 USDT
A 5% decline: 1,141.90 USDT
A 10% decline: 1,081.80 USDT
These are mathematical scenarios, not predictions, confirmed targets, or support levels. They demonstrate why investors should calculate both potential gains and potential losses before entering a position.
A 10% rebound may look attractive, but a further 10% decline is also possible. Risk management must come before excitement.
6. MY BUY-THE-DIP STRATEGY
I would divide my decision into three stages.
Stage One: Watch the price structure.
I want to see selling pressure ease, the market stop creating fresh lows, and buyers begin defending important price areas. I would also compare the recovery with the broader semiconductor sector.
Stage Two: Enter gradually.
If confirmation improves, a staged entry can reduce the risk of committing all available capital at the wrong moment. I would define my acceptable loss before opening a position and avoid using excessive leverage.
Stage Three: Review the thesis.
If prices break down again, earnings expectations deteriorate, or competition changes the business outlook, I would reassess rather than automatically buying more. Averaging down without a plan can turn a manageable position into an oversized risk.
For short-term traders, volatility creates opportunities but also increases the possibility of rapid losses. For long-term investors, business quality, earnings durability, valuation, and competitive advantages should matter more than one red trading session.
7. THE SIGNALS I WOULD WATCH NEXT
Before becoming more confident in a recovery, I would monitor:
Price action: A higher low and a sustained move above recent short-term resistance.
Volume: Strong participation during rebounds and less aggressive selling during pullbacks.
Foreign flows: Whether overseas investors reduce their selling pressure or return as net buyers.
Memory-market fundamentals: Whether demand, pricing, and advanced-memory orders remain supportive.
Competition: Whether new technology developments threaten margins or market share.
Macro conditions: Oil prices, inflation expectations, bond yields, and overall technology-sector sentiment.
No single indicator can guarantee a reversal. The strongest signal would be several of these factors improving together.
8. MY FINAL VERDICT: BUY THE OPPORTUNITY, NOT THE PANIC
I remain constructive on the long-term importance of AI computing and advanced memory. Samsung and SK Hynix occupy important positions in an industry that supports modern data centers and increasingly demanding computing workloads.
But I would separate my long-term business outlook from my short-term trading decision.
The KOSPI's 3.65% decline, Samsung's 4.39% drop, and SK Hynix's 4.52% decline show that market pressure is serious. Strong earnings expectations have not prevented a sell-off, and investors still need to assess valuation, competition, and sustainability.
My approach is cautiously bullish on the longer-term opportunity but selective about the entry. I would rather wait for evidence of stabilization than buy purely because prices have fallen.
Gate's USDT-denominated stock markets give traders a way to follow stock-linked opportunities within the Gate ecosystem. Before trading, check the current instrument quote, liquidity, contract specifications, and risk requirements.
Now it is your turn:
Would you buy Samsung at 188 USDT, choose SK Hynix at 1,202 USDT, or wait for further downside and stronger confirmation?
Which company has the better long-term position in the AI era—and what percentage recovery would make you confident enough to enter?
Share your analysis and join the discussion.
#ShareWeekly #WouldYouBuyTheDipInKoreanStocks
repost-content-media
  • 3
#GateWCTCS9GlobalTradingCompetition
🏆 GATE WCTC S9: 6,000,000 USDT IN POTENTIAL PRIZES, A 50,000 USDT GATE SQUARE CARNIVAL, AND A GLOBAL TRADING COMMUNITY!
🌍 Trade Beyond Boundaries, Rise to the Top!
Gate WCTC S9 is bringing global traders together for a competition that combines market strategy, teamwork, trading performance, and community participation. What makes this season especially exciting is the combination of the main trading tournament and the WCTC S9 Gate Square Carnival.
The headline competition prize pool can reach 6,000,000 USDT, depending on the number of qualifying particip
HighAmbition
#GateWCTCS9GlobalTradingCompetition
🏆 GATE WCTC S9: 6,000,000 USDT IN POTENTIAL PRIZES, A 50,000 USDT GATE SQUARE CARNIVAL, AND A GLOBAL TRADING COMMUNITY!
🌍 Trade Beyond Boundaries, Rise to the Top!
Gate WCTC S9 is bringing global traders together for a competition that combines market strategy, teamwork, trading performance, and community participation. What makes this season especially exciting is the combination of the main trading tournament and the WCTC S9 Gate Square Carnival.
The headline competition prize pool can reach 6,000,000 USDT, depending on the number of qualifying participants. Separately, the Gate Square Carnival offers a 50,000 USDT community reward pool, alongside GT rewards, Position Trial Vouchers, Gate merchandise, and opportunities for additional visibility.
My view is that this is an opportunity to do more than compete on a leaderboard. It is a chance to build connections, share meaningful analysis, develop better trading habits, and participate in a global event through the Gate ecosystem.
🔥 1. THE MAIN COMPETITION: THREE WAYS TO PARTICIPATE
Team Competition: Up to 3,200,000 USDT.
Individual Competition: Up to 400,000 USDT.
Event Contracts PK: Fast-paced 30-minute prediction rounds, with a potential prize pool of up to 400,000 USDT.
The advertised maximum is conditional, not a guaranteed payout. Actual rewards depend on qualifying participation, the prize-pool unlocking rules, rankings, and eligibility.
My personal preference is the Team Competition because I believe collaboration can make the experience more valuable. A strong team can exchange market insights, discuss technical levels, evaluate risk, and learn from different trading approaches.
However, teamwork should never mean taking unnecessary risks. My goal would be to compete with discipline, share useful knowledge, and focus on improving decision-making rather than chasing volume at any cost.
📣 2. MY PLAN FOR THE GATE SQUARE CARNIVAL
I want to use Gate Square to connect with other traders, discuss market conditions, share my analysis, and help create a community built around learning and responsible competition.
My approach includes three priorities:
First, team building. I want to connect with traders who value consistency, market research, communication, and sensible risk management.
Second, sharing results. I believe trading updates should explain the reasoning behind a decision, not simply celebrate a profitable trade. Lessons from difficult market conditions can be just as valuable.
Third, daily discussions. I want to exchange views on Bitcoin, Ethereum, price movements, volume, liquidity, support and resistance, and the factors that can change market sentiment.
Gate says quality recruitment posts may receive featured placement and additional visibility. This is an opportunity, not a guarantee, and the campaign's official eligibility rules apply.
💰 3. LIVE MARKET CONTEXT: BITCOIN AND ETHEREUM
The market provides an important backdrop to WCTC S9. Prices and volumes can change quickly, so I prefer to use dated figures rather than pretend that a historical snapshot is an exact live execution quote.
Bitcoin (BTC): According to the available October 11 market snapshot, BTC closed near $83,679.46. Its reported October 11 trading range was approximately $82,722.11–$84,103.63, with reported daily volume of around $12.54 billion.
For additional context, BTC closed near $82,546.32 on October 9 after a reported daily range of $81,557.70–$83,418.30. Reported volume that day was approximately $24.52 billion. On October 8, reported volume was substantially higher, at approximately $46.22 billion, during a volatile session.
These figures show why volume must be interpreted alongside price action. Higher turnover can accompany a breakout, a sell-off, or intense two-sided trading. Volume alone does not establish direction.
My BTC trading view: I would look for a confirmed recovery above nearby resistance, supported by stronger buying volume, before treating a rebound as a sustainable bullish move. If support fails, I would reassess the setup rather than automatically buy the dip. My preference is confirmation over prediction.
Ethereum (ETH): Available historical exchange data shows ETH closed near $2,495.90 on October 12, down approximately 1.61% for the day. Its reported daily high was $2,579.20, and its low was $2,485.32. Reported exchange volume was approximately 244,160 ETH.
The same data shows ETH rising about 1.21% on October 11 before reversing on October 12. This is a useful reminder that short-term recoveries can fail when buyers cannot maintain momentum.
My ETH trading view: I would monitor whether ETH can recover resistance with improving volume or whether sellers continue to defend higher prices. A recovery supported by stronger demand would be more convincing than a price increase on weakening participation.
These are dated market observations, not guaranteed live prices. Before entering a trade, I would check Gate's current BTC and ETH prices, percentage changes, volume, order-book liquidity, and relevant technical levels.
📊 4. WHY VOLUME, LIQUIDITY, AND VOLATILITY MATTER
Trading volume tells us how much trading activity occurred during a period. Liquidity tells us how easily orders can be executed without significantly moving the price.
For competition participants, both deserve attention.
A market with deeper liquidity may allow more efficient execution, while thin liquidity can increase spreads and slippage. During sharp moves, liquidity can change quickly, and even a seemingly attractive setup may become costly.
My checklist is straightforward:
Volume: Is trading activity supporting the move?
Liquidity: Are spreads and order-book depth reasonable?
Price structure: Where are support, resistance, and invalidation levels?
Risk: What is the maximum acceptable loss?
Costs: Have I considered fees, funding, and potential slippage?
My opinion is that good trading is not simply about generating the highest volume. It is about making informed decisions while understanding the risks.
🚀 5. ANSWERING THE GATE SQUARE COMMUNITY QUESTIONS
Which WCTC S9 format interests me most?
My first choice is the Team Competition. I appreciate the opportunity to exchange ideas, coordinate strategies, and learn with other traders. Individual competition is also attractive because it tests personal discipline, while Event Contracts PK adds a fast-paced challenge. Nevertheless, I prefer building a strong team and competing responsibly.
Am I planning to recruit a team, join a squad, or share daily analysis?
My plan is to connect with traders on Gate Square, build a team, and share market analysis throughout WCTC S9. I want to discuss BTC and ETH, market liquidity, trading volume, technical levels, and changing sentiment. I also want to learn from other participants and contribute meaningful discussions rather than publish unsupported predictions.
What does my team stand for?
My team stands for discipline, teamwork, knowledge sharing, consistency, and responsible trading. We should aim to improve together, evaluate opportunities carefully, and respect risk limits. A strong team is not defined only by its ranking; it is also defined by the quality of its decisions and the lessons its members learn.
Why am I excited about WCTC S9 and the Gate Square Carnival?
The combination of global trading and community participation makes this event particularly interesting.
The main competition offers a potential prize pool of up to 6,000,000 USDT, while the separate Gate Square Carnival adds 50,000 USDT in community rewards, GT rewards, Position Trial Vouchers, merchandise, and potential visibility benefits under the campaign rules.
I appreciate Gate for creating opportunities for traders to compete, connect, and share their knowledge in one ecosystem.
Which markets will I watch most closely?
My primary focus will be BTC and ETH, followed by other crypto assets and supported markets. I will monitor price structure, volume, liquidity, volatility, and broader sentiment. I prefer waiting for confirmation rather than entering a trade simply because the market is moving quickly.
What is my trading strategy?
My strategy is to identify clear setups, plan entries and exits, control position size, and define risk before entering a trade. I will avoid increasing leverage simply to improve my leaderboard position. Trading fees, funding costs, and liquidation risk deserve particular attention when using derivatives.
How can Gate Square help participants?
Gate Square provides a place to recruit teammates, share results, discuss market conditions, and exchange strategies. Quality content may receive additional visibility under the campaign rules. I believe useful discussions can help traders understand different perspectives and improve their analysis.
What is my message to the global trading community?
Let's build strong teams, share knowledge, respect market risks, and compete with discipline. WCTC S9 is an opportunity to challenge ourselves, improve our skills, and connect with traders worldwide. I appreciate Gate for bringing trading and community participation together.
📅 6. IMPORTANT DATES AND PARTICIPATION
According to Gate's official announcement, registration runs from October 9 to October 26, 2026, with the main competition continuing from October 26 to November 25, 2026. The competition is divided into two halves.
The Gate Square Carnival includes team recruitment, trading-result sharing, and daily trading discussions. Recruitment content should include the #WCTCS9 hashtag, a team introduction or recruitment card, the team's rallying message, and clear instructions for interested members
Official WCTC S9 competition: https://www.gate.com/competition/wctc-s9
Official Gate Square Carnival: https://www.gate.com/campaigns/6559
Participants should review both pages carefully because the main competition and community campaign have separate rules, requirements, and reward conditions.
🏆 MY FINAL TAKE: BUILD TOGETHER, TRADE SMARTER, AND RISE TO THE TOP!
WCTC S9 brings together global competition, a potential 6,000,000 USDT main prize pool, team and individual challenges, and 30-minute event-contract rounds. The Gate Square Carnival adds another opportunity to connect with traders through a separate 50,000 USDT community reward pool and additional eligible rewards.
For me, the real value goes beyond prizes. It is about building connections, exchanging market insights, learning from results, and improving trading discipline.
repost-content-media
  • 5