Square
Following
Hot
News
Profile
Share your thoughts
placeholder
Article
🚨 CPI and PPI Are About to Be Released! Between Bitcoin and Gold, Who Will Be the Winner in the Next Round of Capital Flows?
BTC has rebounded, but has the real big money actually returned?
As of the morning snapshot on October 12:
📌 BTC: $83,816, up 1.01% over 24 hours
📌 Over the past five trading days, U.S. spot BTC ETFs saw cumulative net outflows of approximately $679 million
📌 BTC perpetual futures funding rates are close to zero
What does this mean?
Prices have recovered, but institutional capital has not yet confirmed a sustained return.
Next, the October 14 CPI and October 15 PPI w
post-image
BTC+0.66%
GLDX+0.12%
Trying a healthy breakfast in the morning 🤏
post-image
U Jie 10.12 Monday $BTC Strategy
Entry conditions: If the rebound reaches the 83700‑84000 range, the 4-hour candlestick shows a long upper wick, buying volume fails to keep up, and signs of stalled gains appear, wait for confirmation of resistance before testing a short position with a small allocation.
Stop-loss: If the price firmly holds above 84700, indicating a resistance breakout, abandon the bearish setup and exit immediately.
First take-profit target: 82800
Second take-profit target: 82300
A downward move began from the previous high of 87249, with the price dropping to a low of 80344.
post-image
BTC+0.80%
live market update
live-cover
LIVE1,872
$100,000 bitcoin is a magnet.
post-image
BTC+0.78%
  • 1
#LedgerLossesNear90Million Ledger’s latest crisis hits nearly $90–94 million — and it forces a hard reset on how we think about “safe” crypto storage.
Over the past few days the crypto community has been shaken by reports of large-scale fund drains linked to Ledger hardware wallets. On-chain investigators tracked roughly $90–94 million stolen from hundreds of wallets across Bitcoin, Ethereum, TRON, BNB Chain, Polygon and others. The common thread? Devices purchased through a Southeast Asian authorized reseller (CryptoBilis). Ledger has confirmed that at least one affected device contained an u
post-image
BTC+0.78%
ETH+1.15%
TRX+0.03%
BNB+0.34%
  • 6
  • 1
Nobody is talking about this bearish setup forming right now on $DOGE /USDT.

$DOGE /USDT - SHORT

Trade Plan:
Entry: 0.08636 – 0.08662
SL: 0.08771
TP1: 0.08558
TP2: 0.08497
TP3: 0.08406

Why this setup?
Why now? The daily trend is bearish and the 4h bias is SHORT with 95% confidence, meaning the market structure is clearly rolling over. The 1h ATR of 0.000507 shows enough volatility to reach the targets from the entry zone of 0.08636 to 0.08662. The 15m RSI sitting at 46.36 signals weakening momentum without being oversold yet, so the move down is still intact. TP1 at 0.08558 and TP2 at 0.
DOGE+0.63%
Pepe top call outs on @pumpfun app is
solana:2j5SaS7xy776qCBpyPQbZjyQSAtKiFgrwjfErthnW2ZM at 56x
$qi 50x
$si 23x
$hotbot 15x
$wod 8x
$agi 7x
#crypto
post-image
PEPE+3.77%
SOL+1.09%
SI-21.01%
Pressure around 2550 is extremely high, with the daily and 15-minute short-term cycles converging to exert pressure; a successful breakout requires support from positive external factors
U.S. stock futures are up slightly by 0.4% intraday, overall neutral to bullish; consider entering long near support below on a pullback, with specific entry levels available in the subscription updates
$APT
What a disgusting chart. It's very clear that $SUI won out against it.
There is some silver lining in PA if you're interested in a trade.
Good Luck.
post-image
APT+1.95%
SUI+0.17%
XAG+0.69%
$XAUT 10.12 Gold outlook
From the chart, gold prices have staged a low-level recovery rebound from the 4105 low. The current move is merely a technical correction after being oversold and does not represent a trend reversal.
On the daily timeframe, gold prices have rebounded from low levels, while the short-term moving averages are entangled with each other. Overall, the market remains in a range-bound recovery pattern. The MACD green histogram continues to contract, indicating some recovery in short-term bullish momentum; however, the RSI is gradually approaching the overbought zone, while se
post-image
XAUT+0.29%
Smart money is quietly loading RLC while everyone else is still sleeping on this setup.

$RLC /USDT - LONG

Trade Plan:
Entry: 1.0455 – 1.0699
SL: 0.9405
TP1: 1.1456
TP2: 1.2042
TP3: 1.2921

Why this setup?
Why now? The daily trend is bullish and the 1h price sits at 1.0577, which is also the entry reference point for a long bias. The 15m RSI at 40.92 signals room to run before overbought, while the 1h ATR of 0.04883 confirms enough momentum to push toward the first target at 1.1456. The higher time frame structure supports a move to TP2 at 1.2042, but the trade is invalidated if the invali
post-image
RLC+6.87%
Don’t rush to call the direction for $PUMP . The 1-hour and 4-hour charts are still at odds, and this is when a rebound is most easily mistaken for a reversal.
This time, I’m not looking at the gainers and losers list, only the levels. The current price is 0.005657, about 5.25% above the 1-hour support at 0.00536 and about 4.12% below the resistance at 0.00589.
My criteria are simple: only a breakout above 0.00589 followed by continuation would count as upside follow-through; a break below 0.00536 invalidates the original assessment. The 1-hour chart is relatively strong while the 4-hour chart
post-image
PUMP+1.56%
Layout: Bitcoin, Ethereum, Dogecoin
live-cover
LIVE880
  • 3
Week 73 check-in: I lost 11,000 this week. Target 1.5 million (500,000 + 1 million plan) - 325,000 in market value - 200,000 withdrawn + 200,000 deposited = 1.175 million.
🔴 GATE LIVE | XRP LEDGER SECURITY UPDATE 🚨
🔹 Today's Topic: XRP Ledger Fixes a Major Vulnerability That Existed for Nearly 11 Years!
Could this vulnerability have allowed attackers to create XRP out of thin air? What did developers do to fix it, and why does blockchain security matter?
🎙️ Join my livestream to discuss:
🔸 Understanding the XRP Ledger vulnerability
🔸 How developers addressed the security risk
🔸 What this means for XRP holders and the wider crypto community
🔸 Blockchain security and investor confidence
🔸 XRP market sentiment and risk management
💬 Question: Does fixing m
post-image
XRP+0.27%
  • 5
Hundreds of billions in market cap evaporated in one day
Friday was wall-to-wall with “SpaceX declares war on traditional telecom”
T-Mobile fell 13%, Verizon and AT&T collapsed along with it, and the comments section was already writing the carriers’ obituaries
But I noticed something that didn’t quite add up while watching the market
Tower companies were rising
Crown Castle and American Tower were both up that day
Think about it
If the market really believed satellites were going to wipe out cell towers, tower companies should have fallen too
The fact that they rose shows exactly what investo
post-image
T-9.93%
CCI+15.63%
  • 1
#CRCL领涨加密股 #作手分析
🔥 Pulled back from 103.28 to 84.51! CRCL forms a 1H wedge, the trader’s right-side long plan
Trade watch: $CRCL $COIN $HYPE
Over the past two days, CRCL (Circle, the USDC issuer) has become the focus of the U.S. stock crypto sector on GATE Square.
Reviewing this move, CRCL surged rapidly from $57.84 on August 3 to $103.28 on September 4, before entering an obvious pullback and consolidation phase.
As of the close on October 9, the price had fallen back to $84.51. During this adjustment, a very standard “potential descending wedge” has formed on the 1-hour (1H) candlestick
post-image
What’s your plan for CRCL when the U.S. stock market opens tonight?
A. Wait for confirmation of a false breakdown, then enter long positions on the right side 🚀
B. Wait for a breakout above the upper band and a pullback confirmation before going long 📈
C. Never catch a falling knife; continue to stay on the sidelines and observe ☕
D. Broke below the lower boundary of the wedge, seeking a deeper bottom 📉
0 Participants
Ends In 18 Day
CRCL+0.62%
COIN+1.06%
HYPE+1.08%
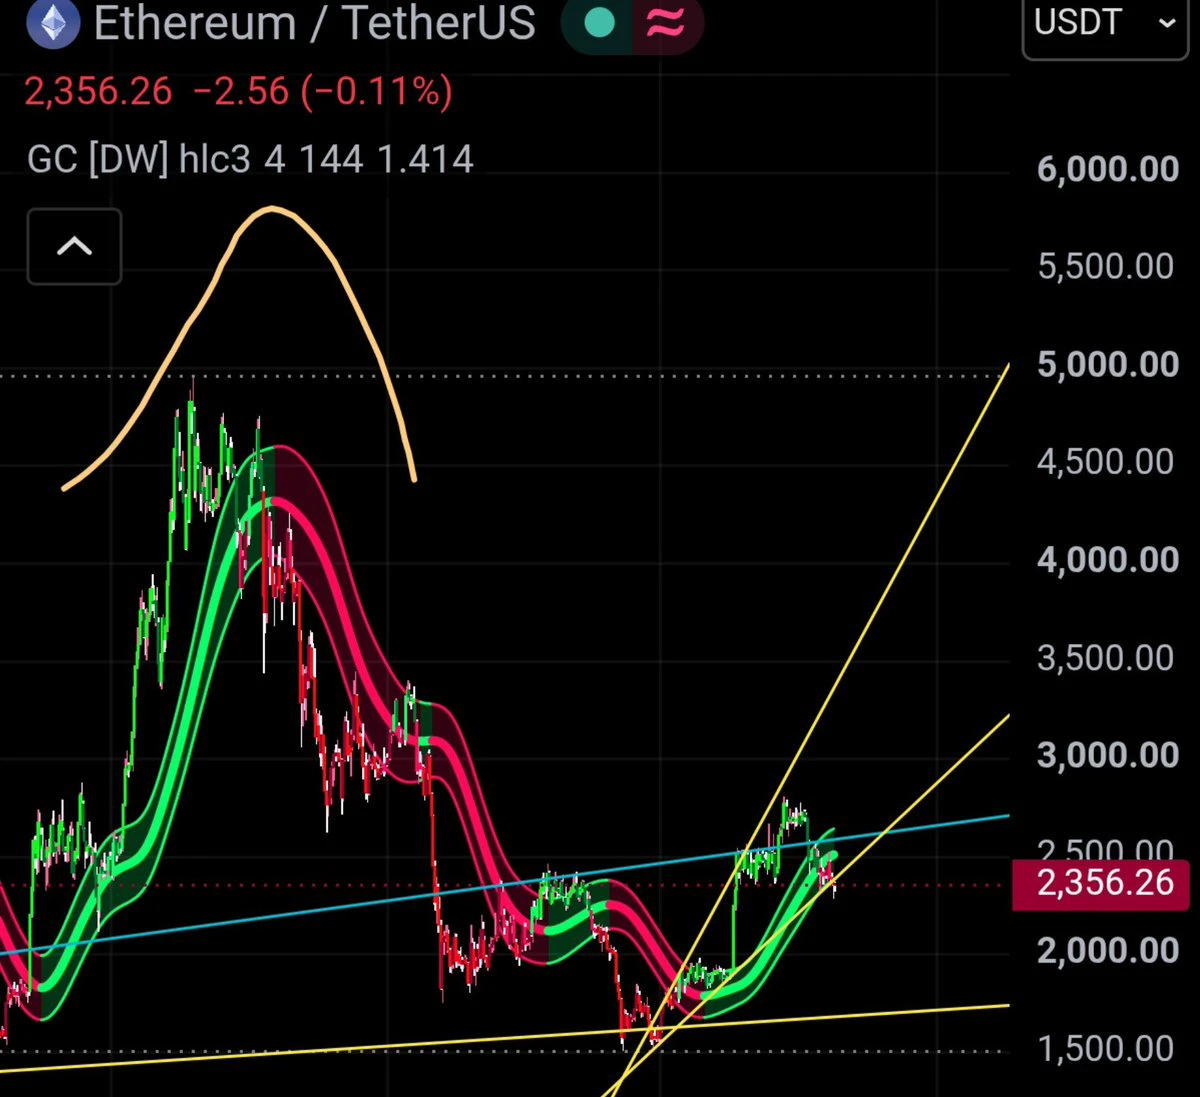
Accurate prediction; facts are always the best proof. $ETH Next, watch whether it will challenge the previous high and then pull back, or form a double bottom. Before a double bottom forms, however, note that if the attempt to challenge the previous high fails, a double top may form; alternatively, if the third upward push fails to exceed around 2550, a head-and-shoulders pattern may form. All of these patterns could lead to further price declines.
It appears that the first round of pullback has now been completed. A support level will subsequently form at the level retested this morning. The
ETH+1.20%
  • 1
Load More

Join 40 M users in our growing community

⚡️ Join 40 M users in the crypto craze discussion

💬 Engage with your favorite top creators

👍 See what interests you

Trending Topics

GateXRedBullWinsSingaporeGP

172.01k Views6.36k Discussing

Verstappen won the F1 Singapore Grand Prix from pole, claiming his 73rd career victory and his first at Marina Bay. Hadjar charged from the pit lane to finish P10. Red Bull swept both the Sprint and the Grand Prix this weekend. As the team's official sponsor, Gate is proud to be part of it — and this week, the Gate VIP team was in Singapore cheering for Red Bull. What's your take on Red Bull's late-season resurgence? [👉 Learn more](https://www.gate.com/brand-partnerships/gate-collaborates-with-oracle-red-bull-racing-in-f1)

GateAtTOKEN2049

41.64k Views21.91k Discussing

LedgerAttacksAllTracedToCryptoBilis

39.61k Views316 Discussing

View More