Square
Following
Hot
News
Notifications
Profile
Share your thoughts
placeholder
Article
#BTCBreaksBelow60K

BITCOIN BELOW $60,000: THE MARKET IS TESTING WHO IS STILL WILLING TO BUY

📊 BEFORE VS. NOW: WHAT HAS CHANGED?

Before November 20, Bitcoin was trading above the psychologically important $60,000 mark. That level represented more than a round number. It was also a point where market participants could measure confidence, demand and the strength of the ongoing recovery.

Now, the situation is different. Bitcoin has fallen below $60,000 for the first time since July, bringing a new challenge for buyers. The November 20 decline happened alongside weakness in technology stocks
post-image
BTC-0.67%
  • 2
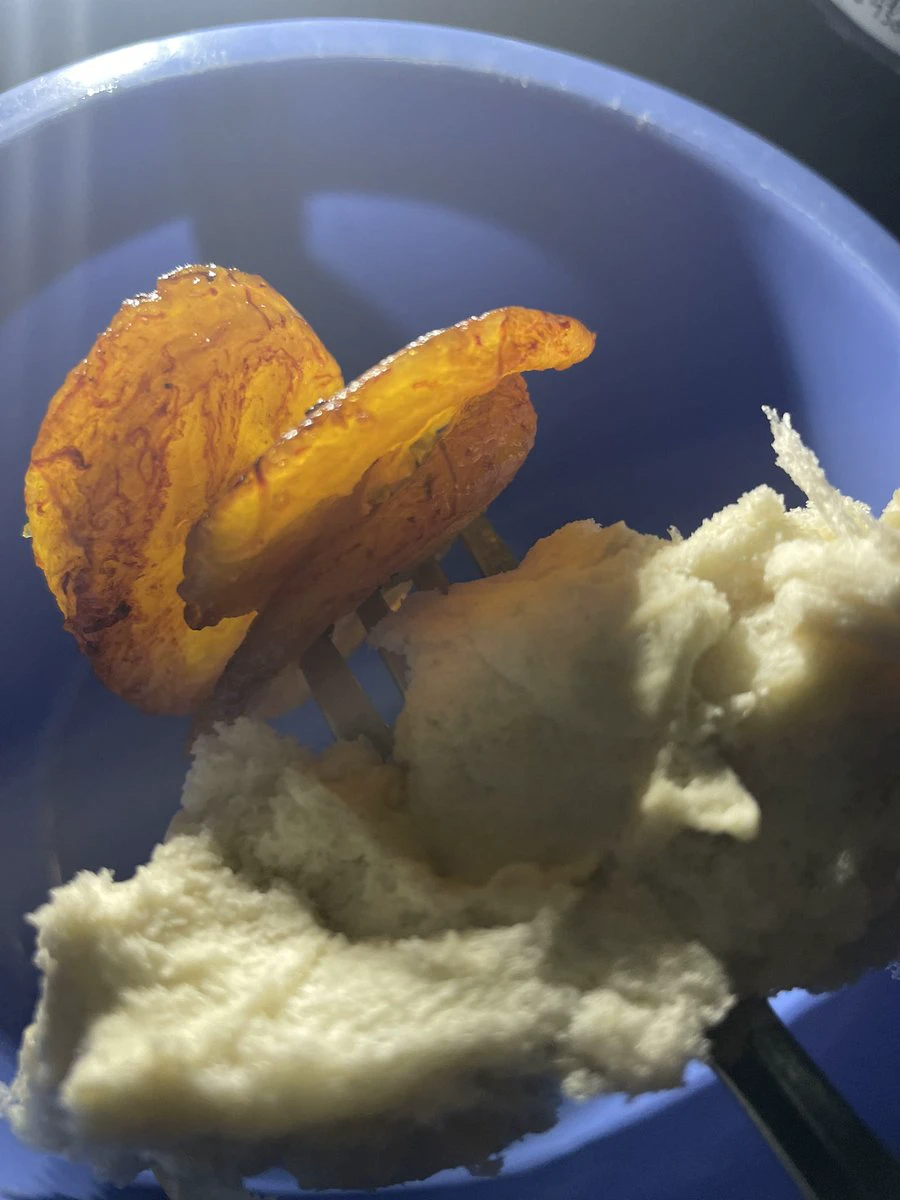
My new combo 😂
Have u tried Bread with plantain before ?
😂🤪🤪🤪
post-image
  • 1
Trenches
FIONA
F
bade
b
FIONA
B34n...pump
Market Cap
$.
Change
.
24h Vol
$.
Holders
.
PIEVERSE
P
bade
b
PIEVERSE
0x0e...25a9
Market Cap
$.
Change
.
24h Vol
$.
Holders
.
mihao
m
bade
b
mihao
4Cxj...pump
Market Cap
$.
Change
.
24h Vol
$.
Holders
.
CLAUDIA
C
bade
b
CLAUDIA
2j5S...W2ZM
Market Cap
$.
Change
.
24h Vol
$.
Holders
.
IDOL
I
bade
b
IDOL
0x3b...ab07
Market Cap
$.
Change
.
24h Vol
$.
Holders
.
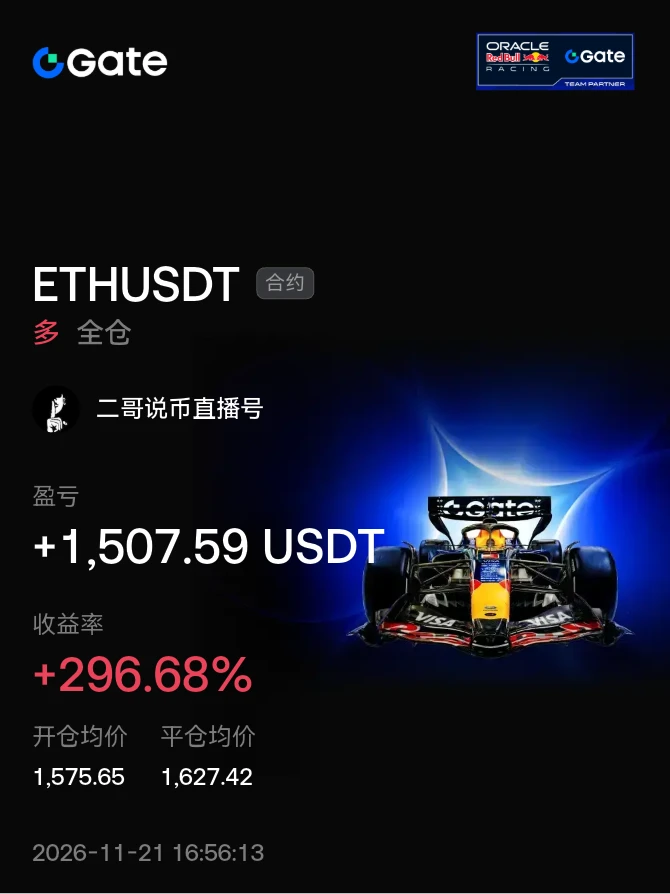
#晒出我的合约收益 Going live to help everyone make back some losses. Have a great weekend. See you Sunday night.
post-image
The sky is so blue today. Trade your positions less and go for a walk.
post-image
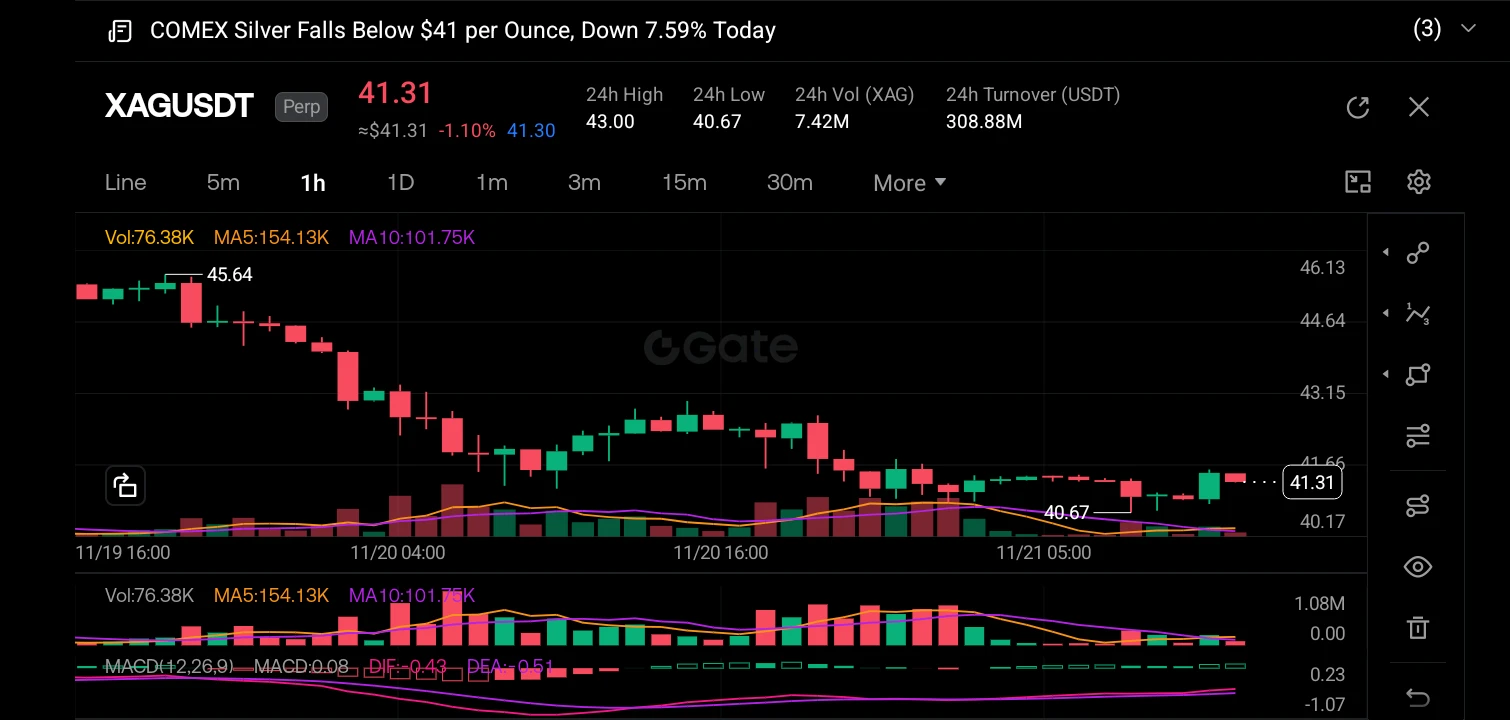
$XAGUSD ‌
A trading style blending technical analysis with on-chain data is particularly potent when observing whale accumulation. While technicals can show you when a price is consolidating, whale accumulation data tells you why it might soon break out. By tracking large wallet inflows and outflows alongside chart patterns (such as the current MACD convergence on the XAGUSDT chart), traders can distinguish between a retail-driven fake-out and institutional accumulation. This approach allows you to position early alongside "smart money" while using technical levels to define strict invalidati
post-image
XAGUSD-3.80%
  • 1
📉 BTC fell below $60,000—can it rebound this weekend?

On November 20, BTC briefly fell below $60,000, hitting its lowest level since July. Tech stocks also came under pressure, and selling sentiment continued to intensify.

The market had been discussing whether $60,000 could hold. Now the question is: after breaking below it, can BTC quickly reclaim that level? 👀

🔮 Weekend market predictions are live!

📈 Bullish camp: Quickly reclaim $60,000

📉 Bearish camp: Continue lower and search for new support

💬 Do you think BTC will reclaim $60,000 first, or fall further first?

Leave y
post-image
BTC-0.67%
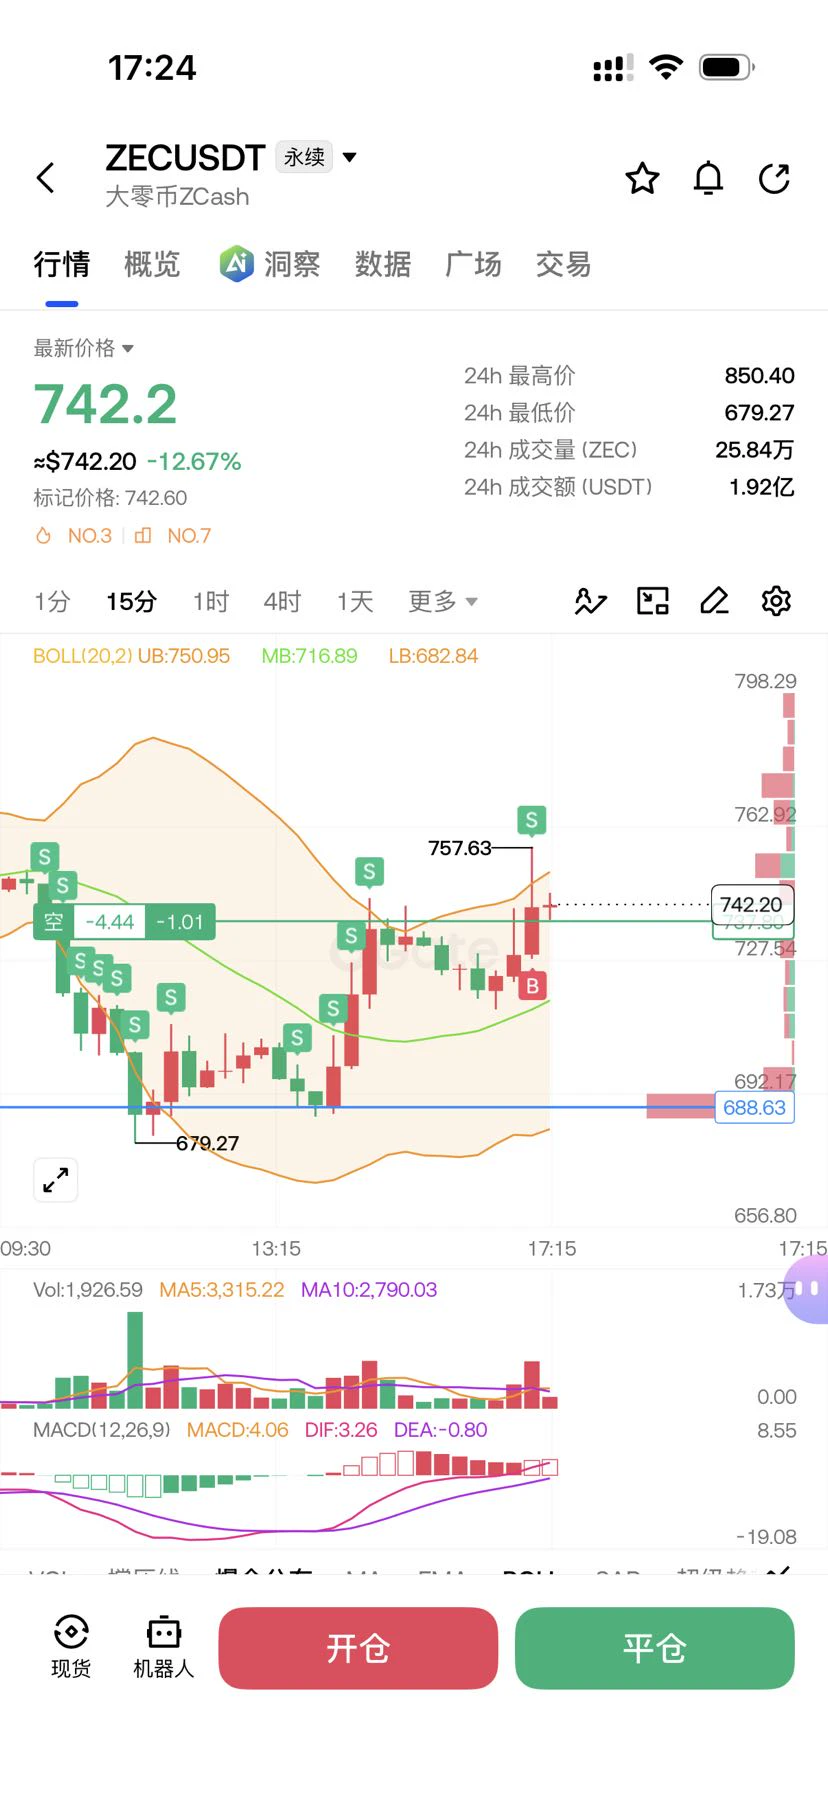
Aoying closed their position and the price immediately printed a wick, terrifying indeed
post-image
  • 2
$SOL It sits at the intersection of three things: the first step after the weekly low at 72.87 breaks, the 66.88 round-number floor, and the last day ETF net inflows haven’t turned negative.

In other words, this isn’t a bottom-fishing shot; it’s catching the first slowdown after the breakdown—the call is right in that sellers have been throttled by SDK’s 30 million tokens-per-epoch gate and the price can’t fall further; the mistake is that there’s an entire unstaking queue between “can’t fall further” and “about to rise.”

The 366 million-token unstaking band still has another ten days or so
SOL-0.74%
BTC-0.65%
ETH-1.23%
After all bullish plans were scrapped, what’s next for Bitcoin? People who were calling for a rally just two weeks ago have basically gone quiet. Yesterday Bitcoin was still at 62,000; today it plunged as low as around 55,600 before recovering to 58,268. The most infuriating part of this drop isn’t how far it fell, but that it hasn’t given us a single decent bounce—it rises above all the moving averages, then turns right back down, even kicking open the door to a new low.
First, the data (CoinGecko, around 15:25 on 2026-11-21): - BTC $58,268, 24h −5.70%, 7d −13.75%, market cap around $1,172B,
post-image
BTC-0.67%
ETH-1.26%
BNB-0.76%
SOL-0.77%
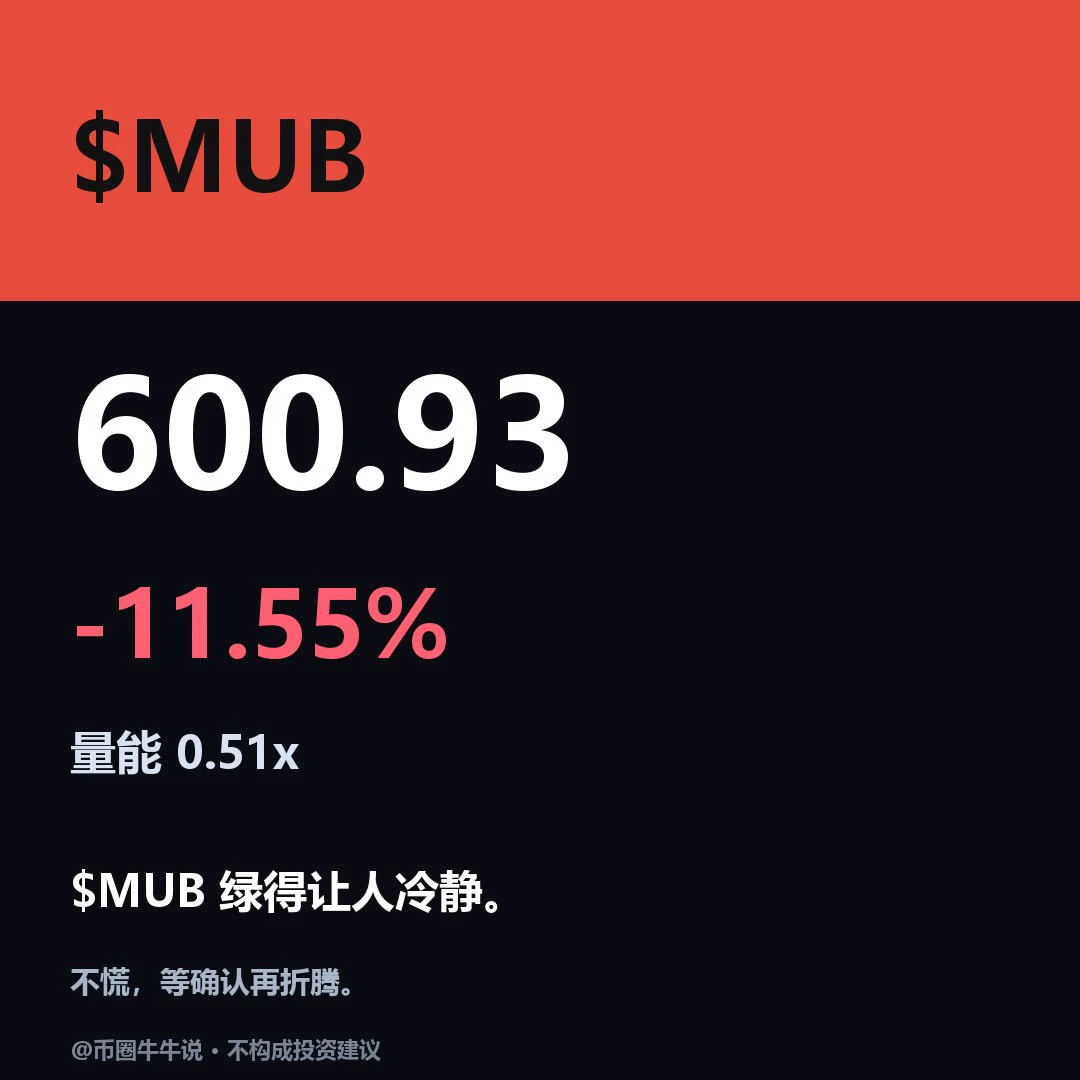
$MUB Currently trading at 600.93, down 11.55% over 24H. The 1h RSI is 42, so it’s not oversold yet. Volume is only 0.5x the average, making a rebound unlikely. Key support is 584.96; if it breaks, watch for the next downside level. Only if it holds can we consider a rebound to 675.06. Don’t rush to buy the dip—wait for volume confirmation before deciding. For now, keep an eye on 584.96 and reduce your position if it breaks. Without a surge in volume, any short-term rebound is likely to fizzle. Not investment advice
#MUB
post-image
That was a huge missed opportunity. Before ending the stream this morning, I had the guys place a BTC short at 59300 and an ETH short at 1650. I set the BTC take-profit at 58500. The good news is that the 59300 order was successfully placed. The bad news is, how did BTC drop as low as 55000? I missed out on 3000 points on BTC$BTC ‌$ETH ‌
post-image
BTC-0.65%
ETH-1.23%
  • 1
  • 1
WHALE ADD 10.2 MILLIONIN LONG SLIVER POSITION
live-cover
LIVE2,811
BTC-0.67%
1121 was directly labeled as an event.
Guys, how's everyone doing right now?
  • 1
  • 2
BTC Falls Below 58,000 USDT, Down 7.75 percentage in 24 Hours
live-cover
LIVE3,319
BTC-0.67%
ETH-1.26%
SOL-0.77%
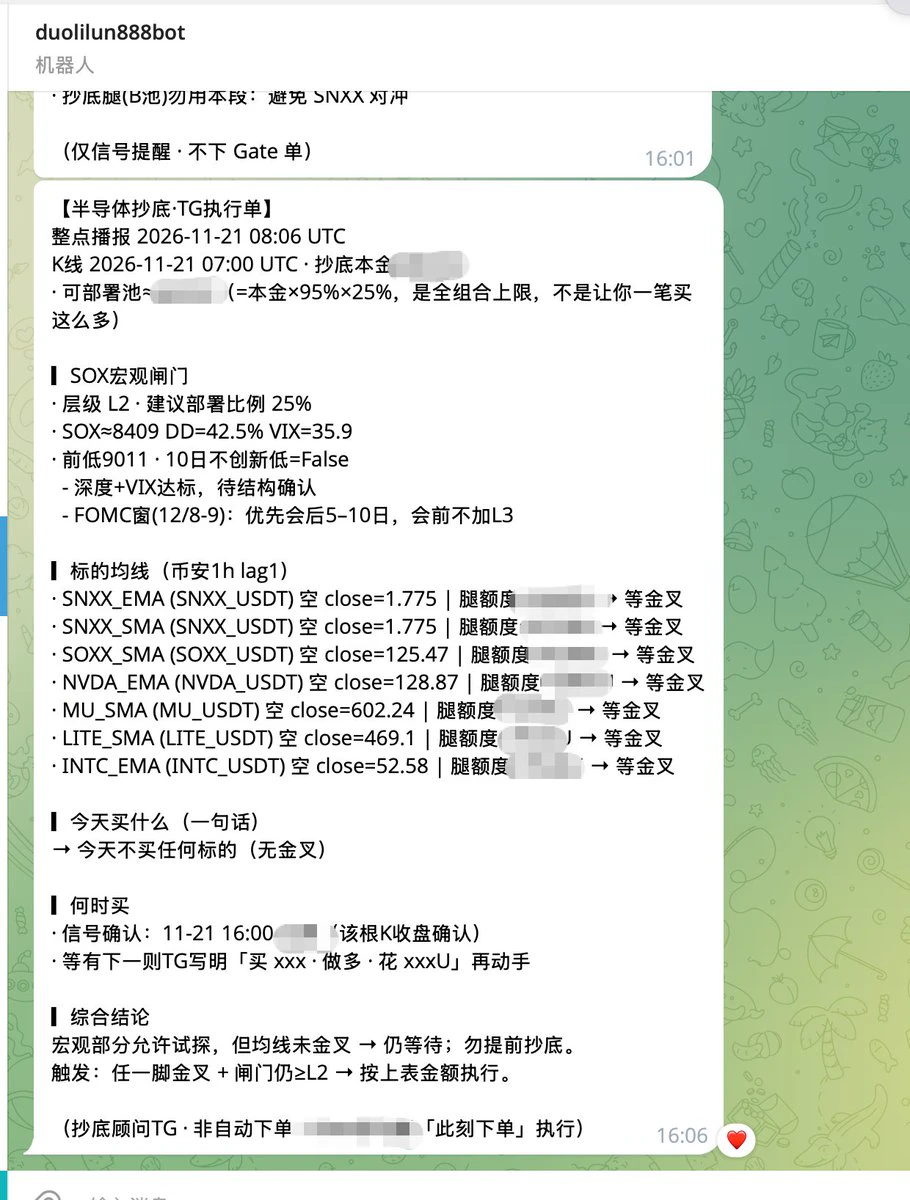
I built a US stock dip-buying advisor that reminds me every hour whether it’s time to buy the dip. The AI keeps telling me not to buy, so I’ll wait for its notification telling me when to buy
post-image
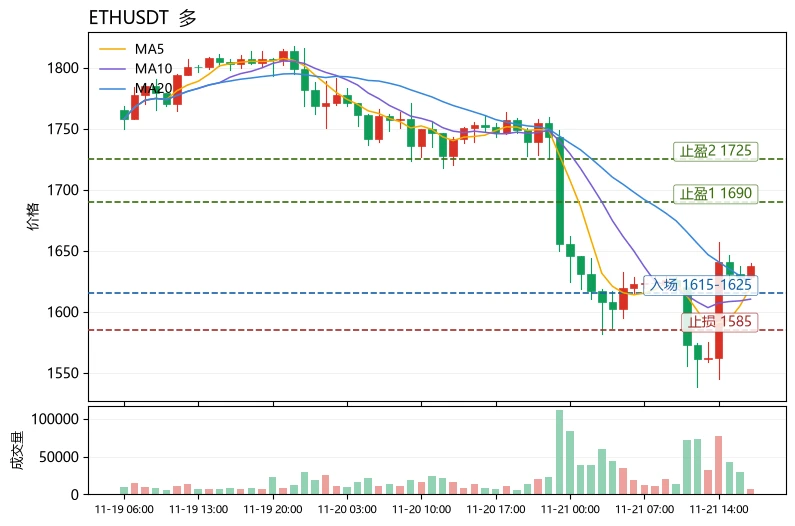
$ETH Short-term bullish, but this is a fragile rebound amid extreme fear and positive funding rates; only buy dips within the range, and don't chase prices higher. Rationale: The current price of 1637.91 is above the MA5 (1619.83), and the MACD histogram at +7.582 remains bullish, but the MA5 is still below the MA20 (1623.51), so the medium-term moving averages have yet to recover; RSI is only 46.6, nowhere near overbought; the Fear & Greed Index at 12 is in the extreme fear zone, with crowded bearish sentiment, which instead makes a short-covering rebound more likely. The key contradiction is
post-image
PEPE+0.97%
DODO+11.43%
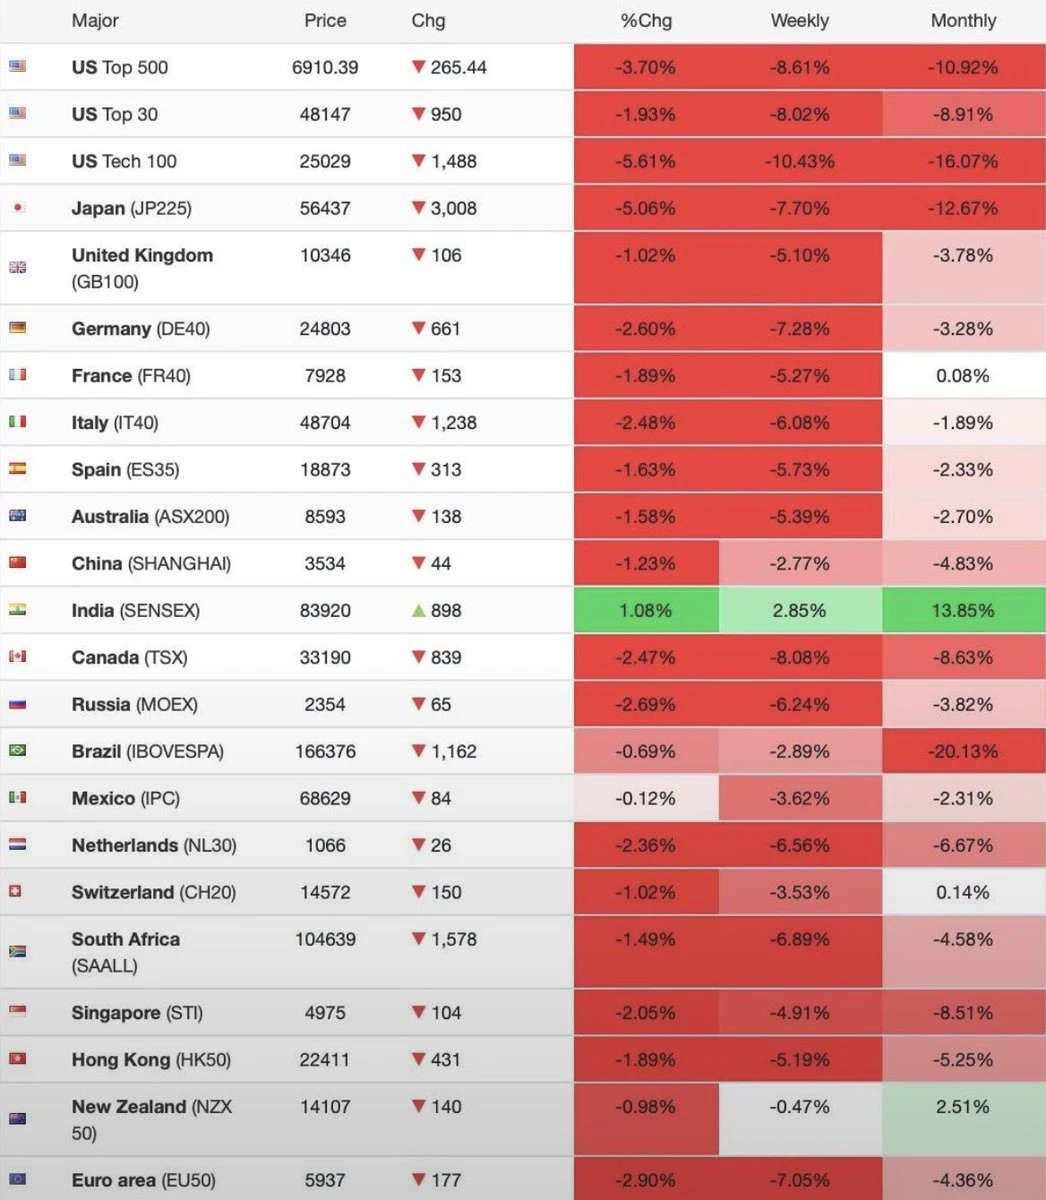
🇮🇳 INDIA STANDS GREEN WHILE GLOBAL MARKETS TURN RED!
post-image
A close friend gave it to me when I got married
Only during last night's sharp drop did I notice that 【Double Happiness】 is bitter:
post-image
$Lobster has moved back above the previous range. If it holds $0.01550 on a retest, I’ll go long. Take profit at $0.01596, stop loss at $0.01527.
post-image
龙虾-6.40%
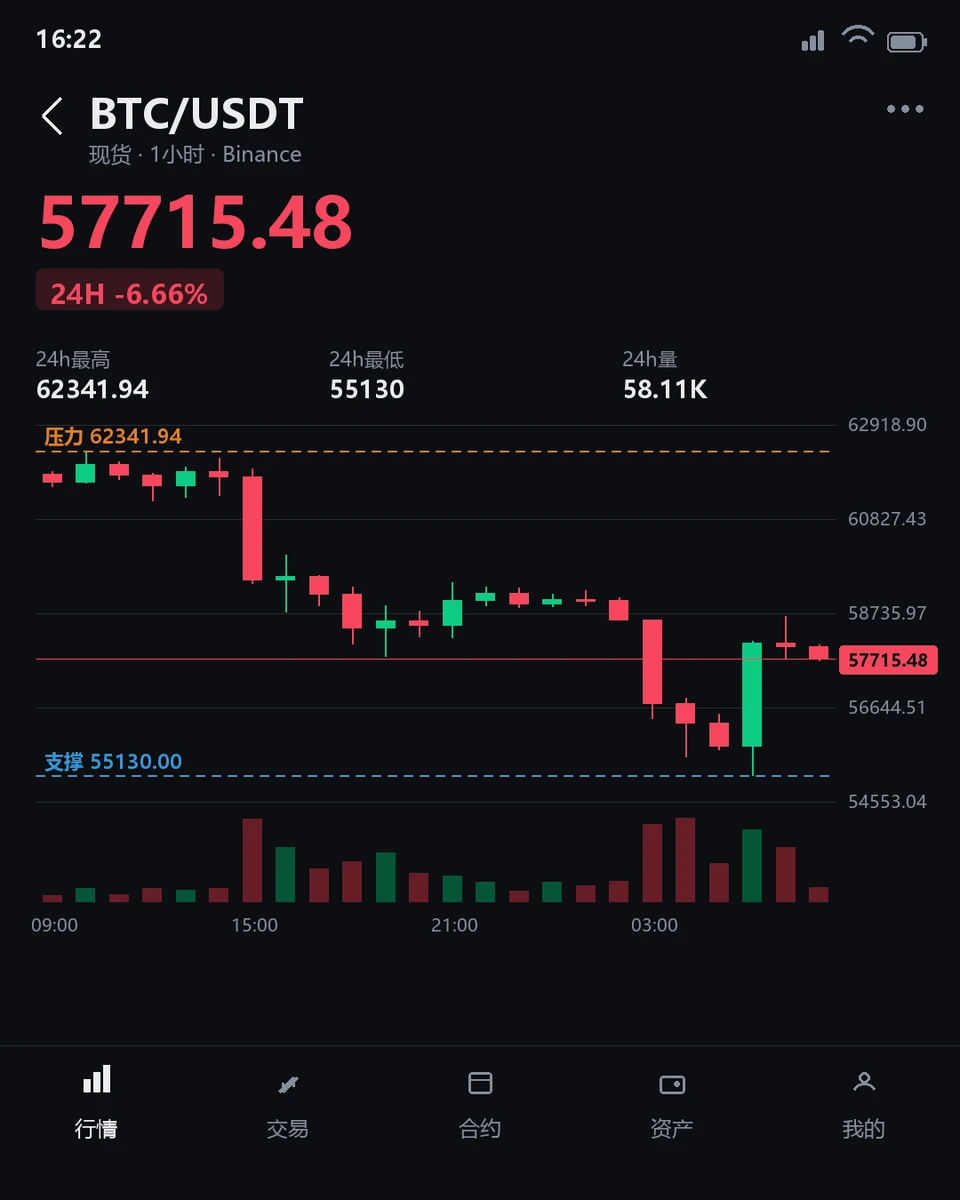
$BTC Has Entered Oversold Territory, So Why Can’t We Say It Has Bottomed?
$BTC is currently at 57728.41, down 6.80% over 24 hours, with an intraday range of 55130 to 62341.94. The 1-hour RSI14 is 44.97, neutral to weak; the 4-hour RSI14 is just 24.11, deep in oversold territory. Both timeframes point to a weak trend, with price trading below the 1-hour EMA20 at 58658.15 and the 4-hour EMA20 at 61000.97. The price is also still over 13% below the 4-hour resistance at 65447.
Oversold conditions only indicate that short-term selling pressure has been released in a concentrated burst. A volume rat
post-image
BTC-0.67%
Load More

Join 40 M users in our growing community

⚡️ Join 40 M users in the crypto craze discussion

💬 Engage with your favorite top creators

👍 See what interests you

Trending Topics

BTCBreaksBelow60K

2.1M Views29.3K Discussing

BTC fell below $60,000 on November 20 for the first time since July, alongside a tech stock selloff and broader pressure on risk assets. Will $60K become resistance, or can BTC quickly reclaim it? What price or volume signals would convince you that selling pressure is easing?

GateDirectIPOPhase3ANTAllocates92100Shares

746.9K Views4.8K Discussing

NvidiaDropsNearly14Percent

313.5K Views7.5K Discussing

View More