Square
Following
Hot
News
Notifications
Profile
Share your thoughts
placeholder
Article
im ready for monday
BRING IT ON
post-image
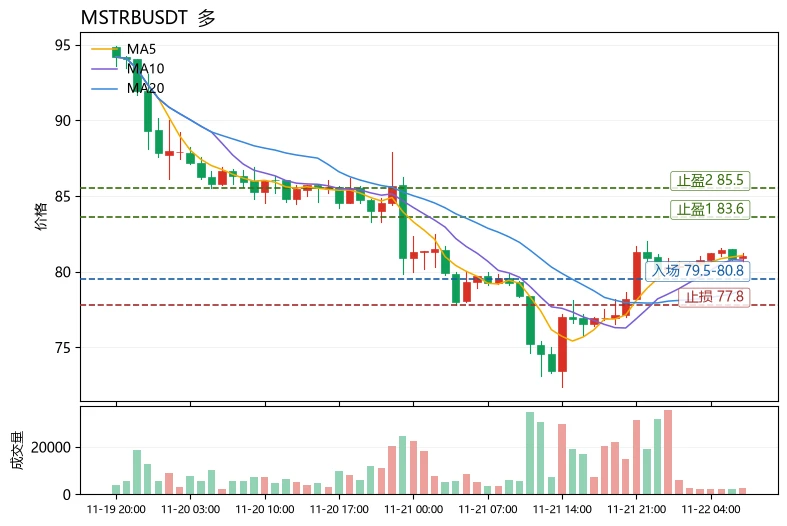
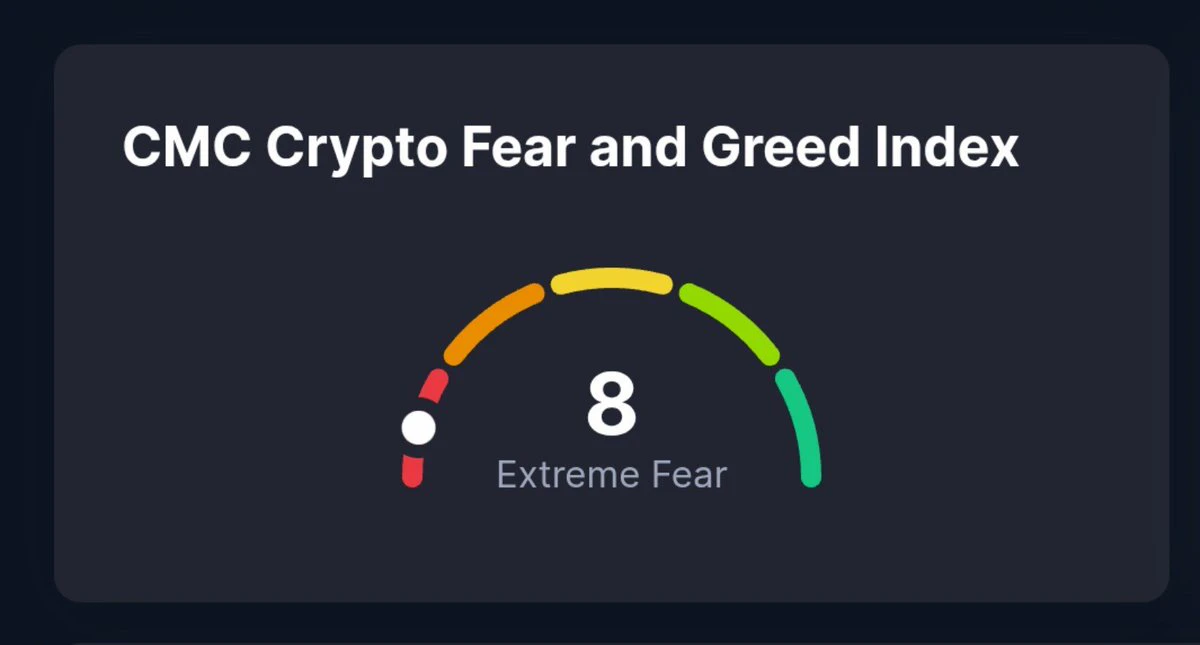
The most unusual detail in today’s market is that the Fear and Greed Index has plunged to 12, deep in the extreme fear zone, while MSTBUSDT bucked the trend and closed up 2.06%. MA5 (81.072) also held firmly above MA20 (78.83), and the MACD histogram remained bullish at +0.5023—a clear divergence between market panic and price structure. Among similarly active assets, $ENSO USDT$ENSOUSDT led with a 13.38% gain, but its MACD histogram showed a bearish signal at -0.001279, while its funding rate of -0.6305% indicates crowded longs and elevated risk of chasing the rally;
$PEPEUSDT fell 2.01% over
post-image
pepeusdt
pepeusdtUncle Pepe
Pump.Fun
MC:$2.33KHolders:1
0%
ENSO-3.03%
Trenches
IDOL
I
bade
b
IDOL
0x3b...ab07
Market Cap
$.
Change
.
24h Vol
$.
Holders
.
PIEVERSE
P
bade
b
PIEVERSE
0x0e...25a9
Market Cap
$.
Change
.
24h Vol
$.
Holders
.
FIONA
F
bade
b
FIONA
B34n...pump
Market Cap
$.
Change
.
24h Vol
$.
Holders
.
CLAUDIA
C
bade
b
CLAUDIA
2j5S...W2ZM
Market Cap
$.
Change
.
24h Vol
$.
Holders
.
Singularity
S
bade
b
Singularity
7R4M...pump
Market Cap
$.
Change
.
24h Vol
$.
Holders
.
$XCU ‌
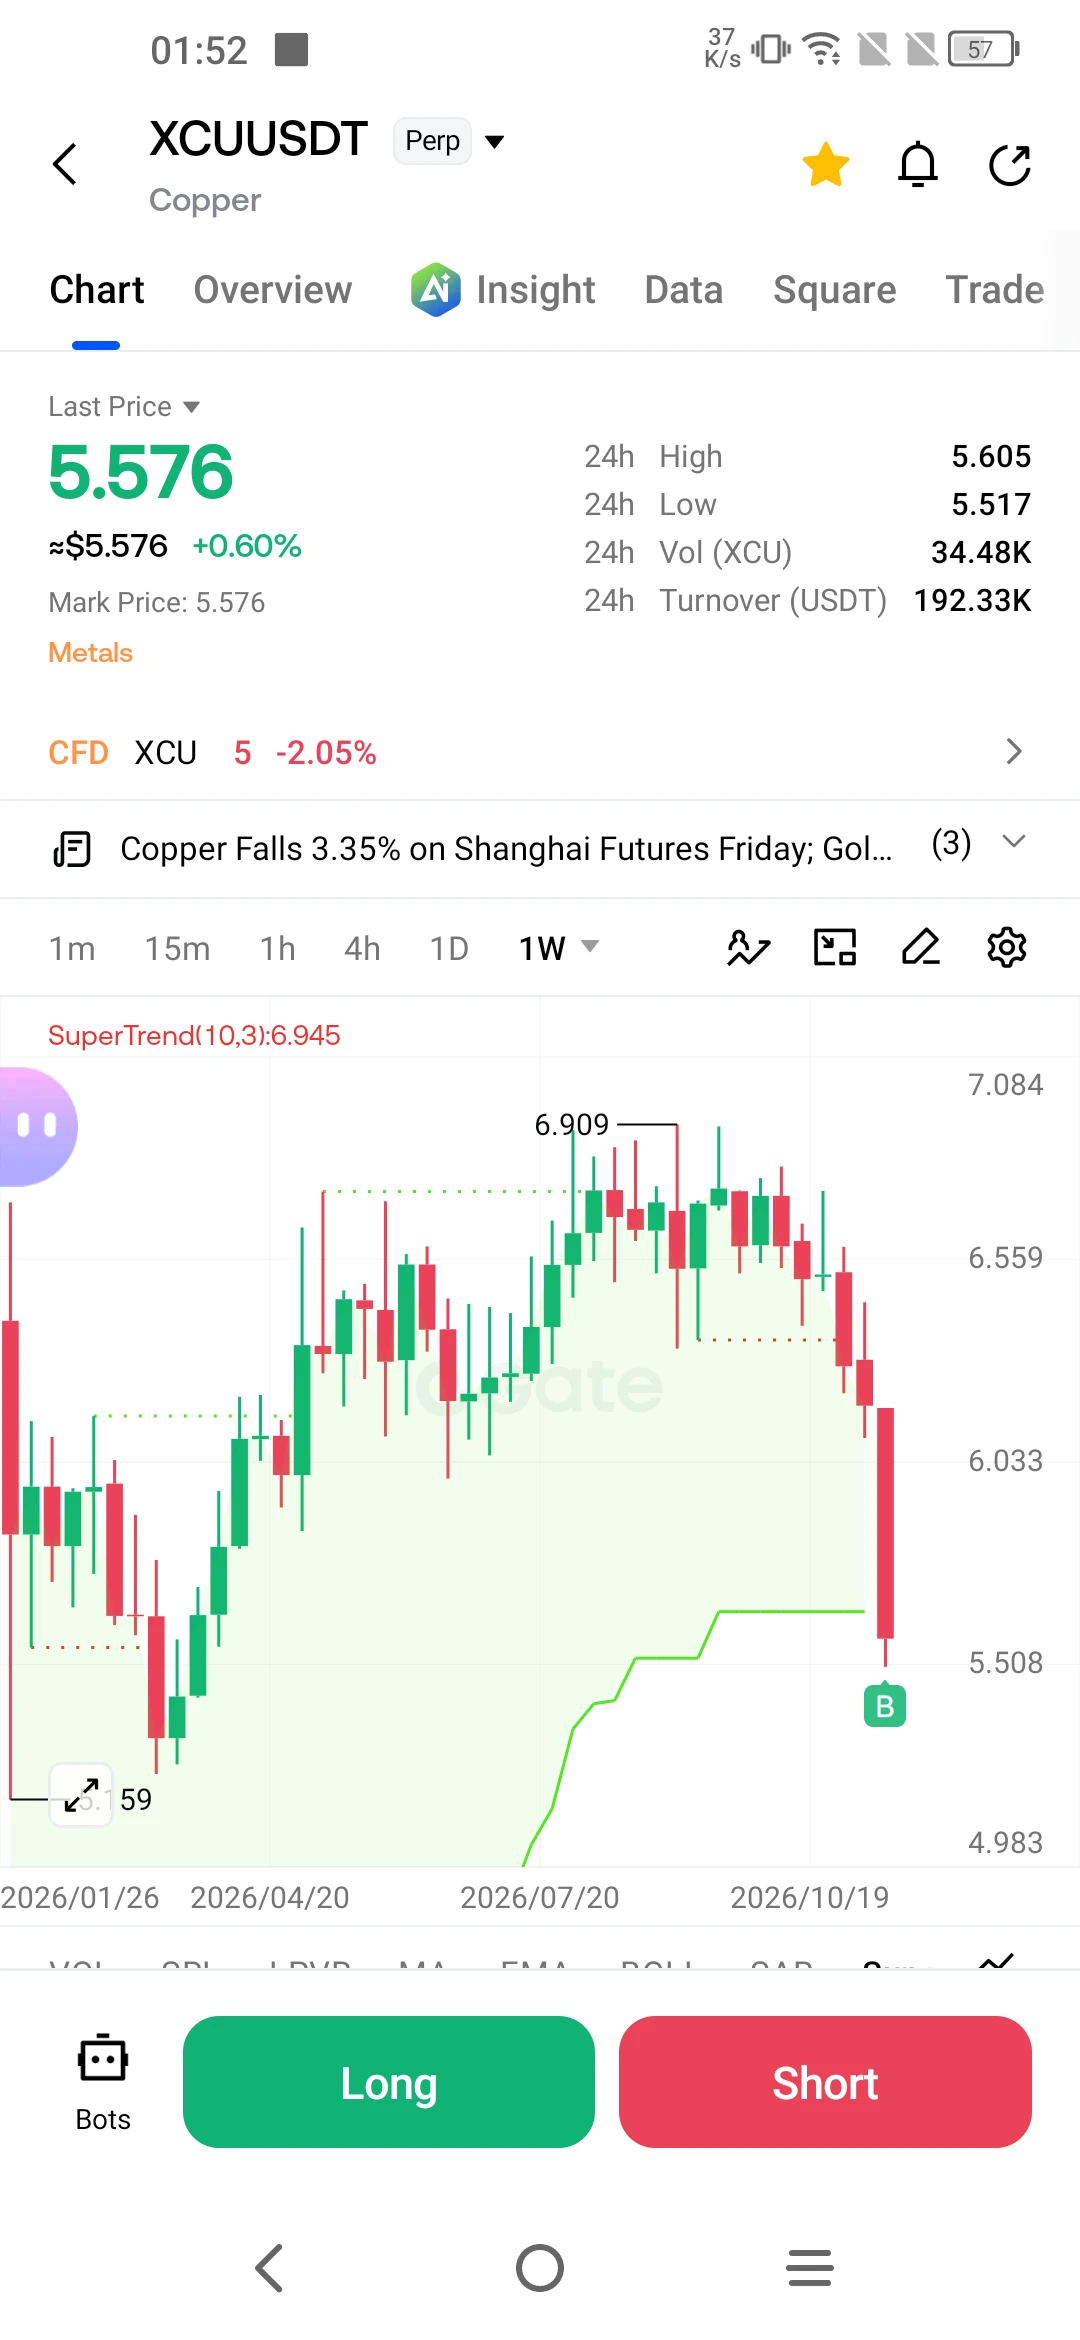
The copper market is being shaken with a speed and intensity not seen in a long time. Futures have shed more than 9% this week, marking their worst weekly performance since 2026. As clearly illustrated on the chart, prices have retreated from a peak of $6,909 to the $5,500 range. Having hit record highs in September—driven by expectations of massive demand for cabling for artificial intelligence (AI) data centers—prices are now under severe pressure as that same narrative unravels.

So, what lies behind this sudden collapse? In essence, the market is repricing the AI story, with overly
post-image
XCU+0.20%
  • 4
  • 1
Bullish signals have been triggered; consider entering around the current price of 0.03950.
The target is 0.04366, with a stop-loss at 0.03600, offering a favorable risk-reward ratio.
DODOX is already up 15.99% in this move, and momentum continues. Consider riding the trend.
Risk warning: Contract trading carries extremely high risk. Please strictly control your position size and manage your funds carefully. (The above is solely a personal opinion and does not constitute investment advice. Please assess market risks rationally.)
post-image
DODOX
DODOXDODOX
Pump.Fun
MC:$2.22KHolders:87
32.76%
BTW | Long 🟢 | Bullish | 15-minute 24-hour: +9.07% | Volume: 69.7M USDT Long rationale: Price is above EMA200; EMA20/50/200 are aligned bullishly; RSI14 is 71.3; MACD histogram is positive; ADX14 is 20.4; volume is 1.27 times the 20-candle average; trend pullback/continuation. Entry: 0.7219 Stop-loss: 0.667084 Take-profit 1: 0.79042 | Take-profit 2: 0.831532 | Take-profit 3: 0.886348 Entry levels are for reference only; do not chase the price. The strategy is invalidated if the stop-loss level is reached. Technical analysis only; not investment advice. $BTW
post-image
BTW-7.42%
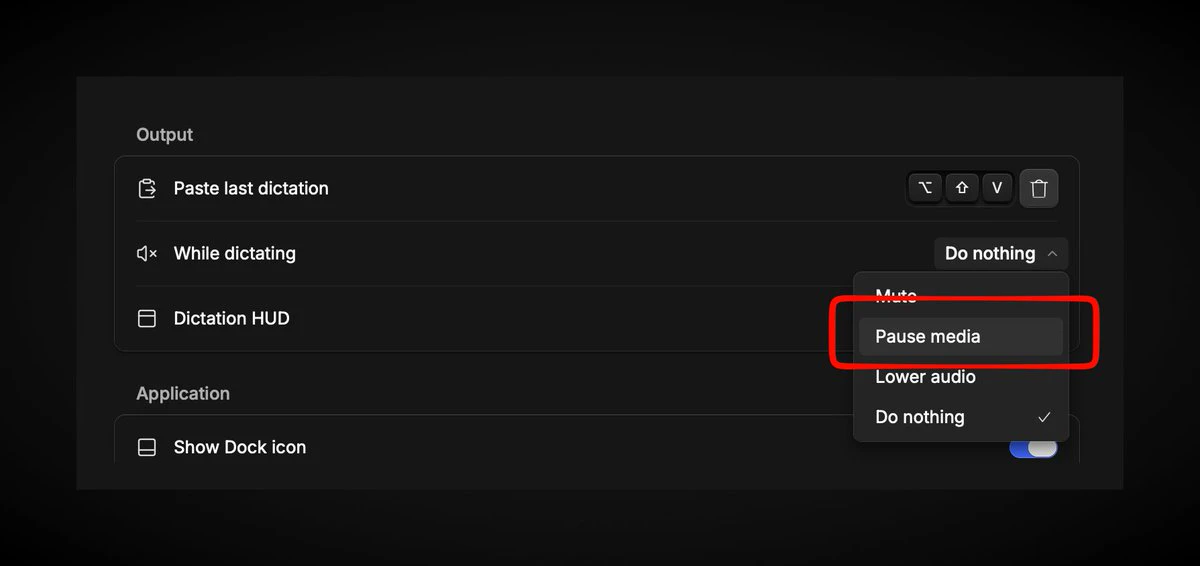
TIL, Hex let's you pause media when you are dictating 🙌
post-image
U haven't felt enough pain yet
Buckle up alt coiners
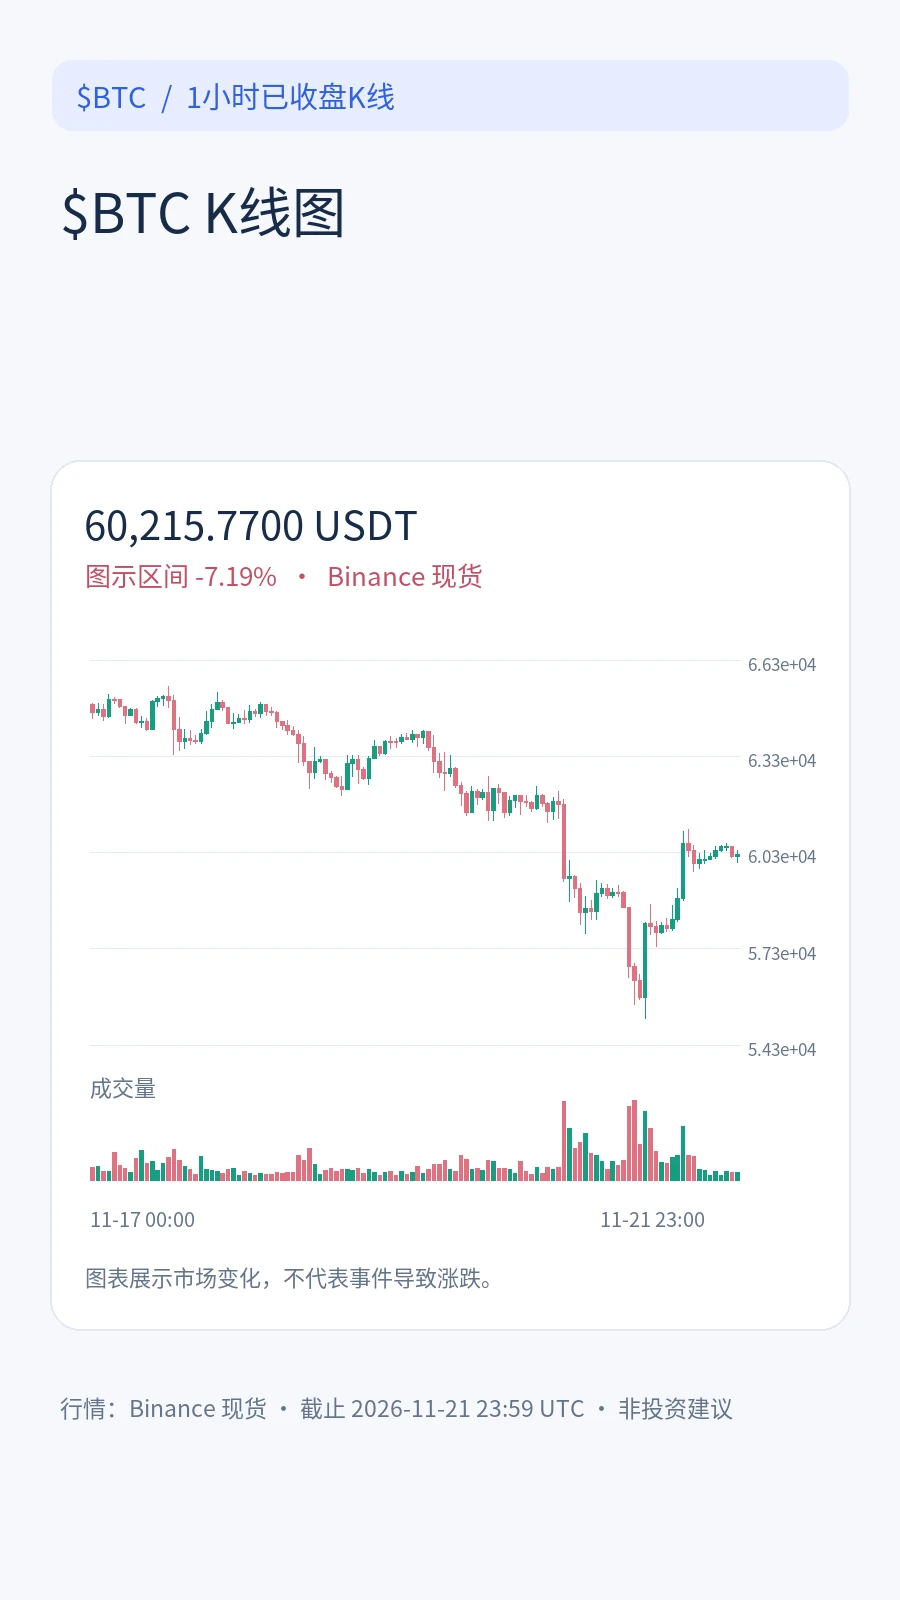
$btc
post-image
BTC-0.67%
The battle over the U.S. crypto regulatory framework has once again hit an impasse on Capitol Hill. Senator Lummis revealed key details in a post. The provision that was supposed to require the establishment of an SEC crypto certification office was targeted by opposing votes. An earlier procedural vote received only 49 votes in support, falling short of the threshold. The opposition openly stated that ethics consultations remained unresolved and questioned a bias toward campaign contributions. With the transition between congressional sessions approaching, the bill faces an even tougher path
post-image
$ADA timeframes diverge: bullish on the 1-hour, bearish on the 4-hour, with key levels at 0.1462 and 0.1333
Currently, $ADA is at 0.1446 USDT, up 1.05% over 24 hours, with a range of 0.1333–0.1462. The 1-hour trend looks bullish, while the 4-hour trend remains bearish; the two timeframes give opposite answers.
My view: I’d rather see this as a direction that remains unconfirmed, rather than rush to label it a rebound or a pullback.
The 1-hour RSI at 77.4 has entered overbought territory, while the 4-hour RSI at 37.7 is neutral to bearish; the 1-hour EMA20 at 0.14358511 is below the current pr
post-image
ADA-1.48%
The police don’t dare intervene when Indians and Pakistanis carry knives and swords in public, yet they immediately show up at the door, handcuff, and haul away Britons for saying one true thing about Islam online.

This is the real contrast in law enforcement in the UK today—not neutral policing, but selective surrender.

Sharia law is enforced strictly only against Britons, while Muslims get a pass.

Britain no longer belongs to the British. Assimilation is dead. All that remains is surrender or resistance.
Nov 22 morning session: ETH resumed moving sideways after a rebound. Watch the 1674–1692 range first.

There is support at 1674–1676, where you can wait for a brief long opportunity after the price stabilizes. If it fails to break through 1689–1692, watch for a pullback. If it later holds above 1692 on increased volume, look next at 1697–1705; if it breaks below 1672, watch 1663 and 1653.

My approach is to stay mostly inactive in the middle and wait for confirmation at key levels. Don’t let a sharp rally or sell-off throw off your rhythm. The key now is which of these two levels gives a direc
post-image
ETH-1.23%
  • 1
Lao Hei is clearly putting his own skin in the game with this trading call $VVV ! The project is also currently offering open-source models at half price, and if they sell well, 40 will probably be coming soon too!
post-image
VVV+0.37%
Read through the Primus FHE docs tonight.
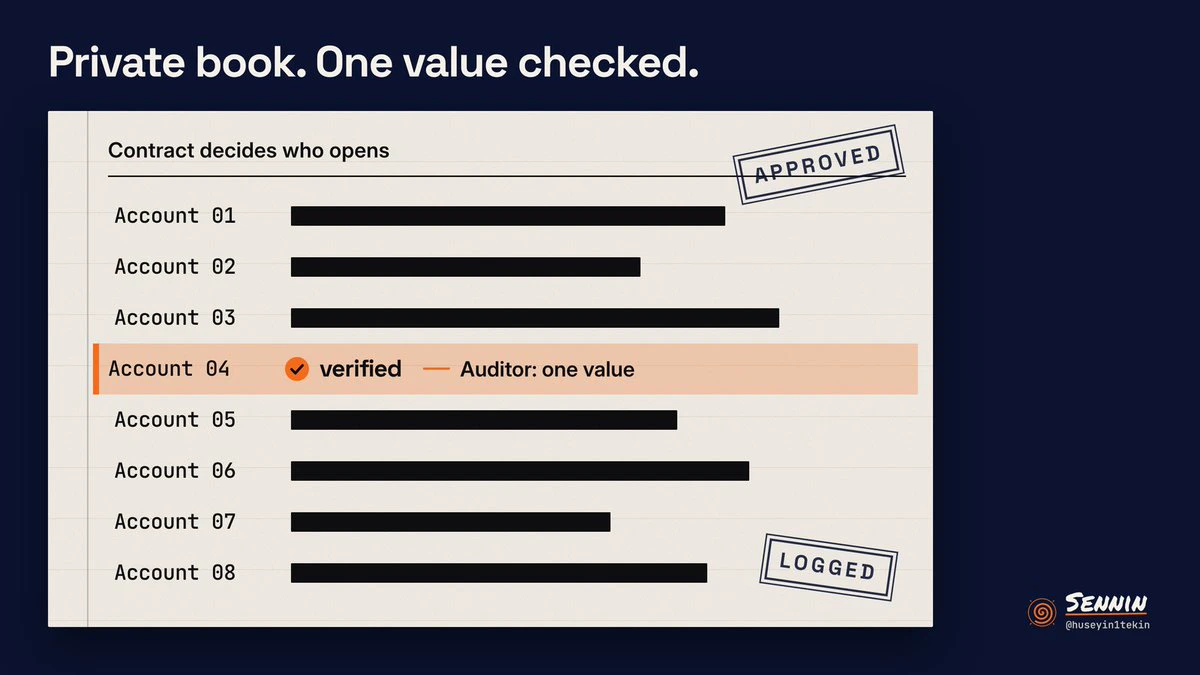
Balances and amounts stay encrypted onchain. The contract decides who can open each value, and every opening has to be approved and recorded. So an auditor can check one number without the whole book going public.
They mention it for payroll and treasuries.
I still want to see that record of who opened what. For now decryption runs through a TEE-protected service, with threshold MPC planned later.
post-image
FHE-3.50%
#USNOVJoblessClaimsBeatExpectations #ShareWeekly

US Jobless Claims Rise Above Forecast: Why a Cooling Labor Market Is Not Enough to Change the Fed’s Direction

The latest U.S. unemployment claims report has delivered an important message to financial markets: America's labor market is gradually losing momentum, but it is not weakening fast enough to force the Federal Reserve to abandon its restrictive monetary policy. This distinction is becoming increasingly important for investors as inflation concerns, interest-rate expectations, and institutional liquidity continue to influence global fi
BTC-0.67%
US500-3.01%
US30-1.48%
BLK-3.02%
IBIT-5.97%
$XRP The current 1-hour and 4-hour trends are showing a clear divergence. The 1-hour timeframe is bullish, with the RSI as high as 74.12, while the 4-hour timeframe is bearish, with the RSI at just 39.37. Short-term traders may see a strong uptrend, while investors focused on longer timeframes may think the market remains under downward pressure. This divergence makes the current trend difficult to assess, especially with the price already nearing the 1-hour resistance level of 0.9389.
I would choose to wait at this level, as chasing a long position carries significant risk. The current price
post-image
XRP-1.15%
$DOGE Is Stronger Short-Term but Weak on the 4-Hour Chart—Which Will Turn First?
$DOGE is currently at 0.05517, up 1.174% over 24 hours, with an intraday range of 0.05077‑0.05569. The 1-hour chart looks relatively strong, with the price above EMA20 at 0.05475052. RSI14 is 78.74, nearing overbought territory, but the volume ratio is only 0.2, far below average, indicating limited participation from short-term buyers. A volume ratio of 0.2 means that trading volume over the past hour was only one-fifth of its recent average, making it difficult for buying pressure to persist. The 4-hour chart re
post-image
DOGE-0.22%
MARKET OVERVIEW
live-cover
LIVE660
BTC-0.67%
Even after a 12-point drop, I still made money—and not by buying the dip. I took this $IRYS trade last Thursday. The day after it came down from 0.0221, I opened a small position around 0.0208, sizing it at 20%, and set my stop-loss at 0.0192—that was a previous structural level, and if it broke, it would mean my read was wrong. The reason for entering was simple: 24-hour trading value was still 35.5M, and volume hadn’t dried up. The drop was part of the broader market sell-off, not because something had gone wrong with the token itself. During the move, it dipped again to 0.0201. I didn’t tou
IRYS-22.27%
  • 3
  • 2
Load More

Join 40 M users in our growing community

⚡️ Join 40 M users in the crypto craze discussion

💬 Engage with your favorite top creators

👍 See what interests you

Trending Topics

BTCBreaksBelow60K

2.1M Views30.1K Discussing

BTC fell below $60,000 on November 20 for the first time since July, alongside a tech stock selloff and broader pressure on risk assets. Will $60K become resistance, or can BTC quickly reclaim it? What price or volume signals would convince you that selling pressure is easing?

GateDirectIPOPhase3ANTAllocates92100Shares

799.8K Views4.9K Discussing

NvidiaDropsNearly14Percent

335K Views7.6K Discussing

View More