Share your thoughts
placeholder
Article
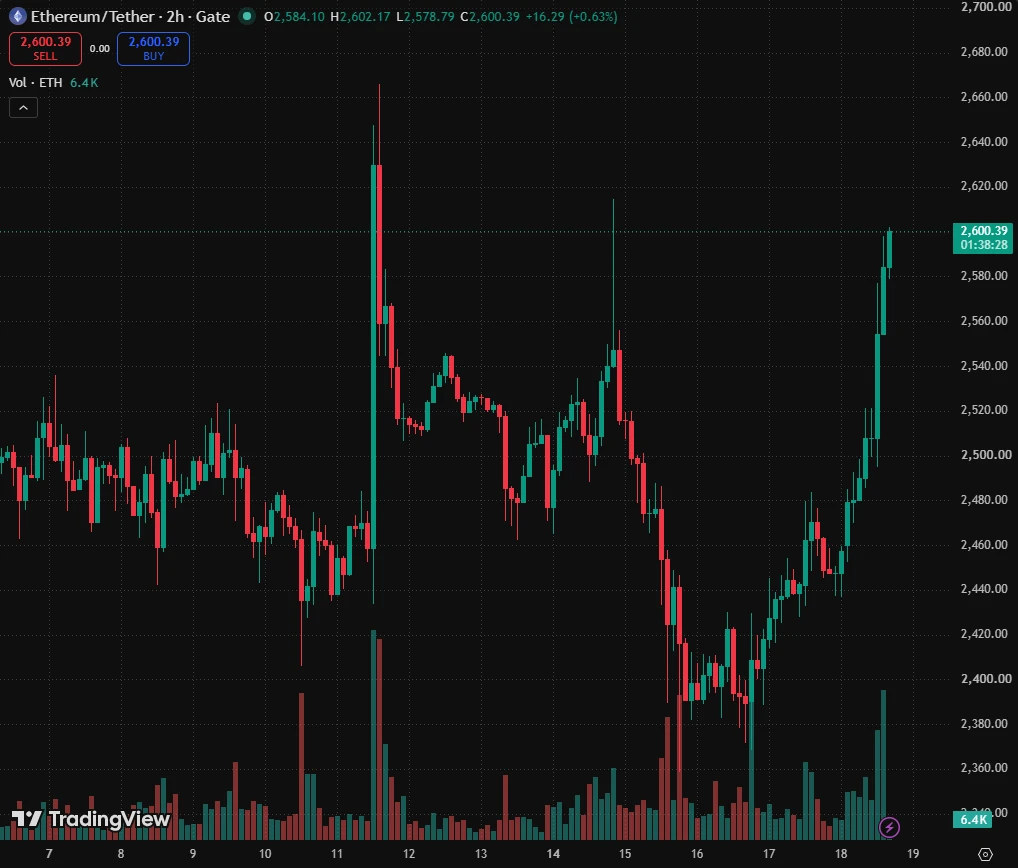
ETH ranges near $2,370-$2,530; a convincing close above $2,530 could spark a move toward $2,700. $ETH
post-image
ETH+1.97%
[New Streamer]Whales Move in Sync!
live-cover
LIVE1,942
#BTCReclaims80K
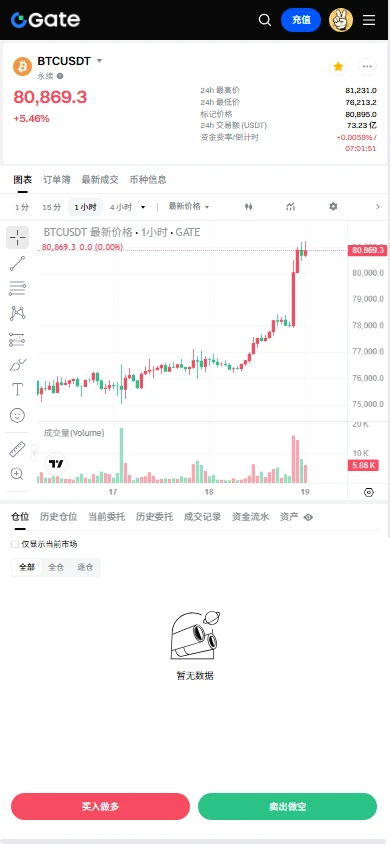
BITCOIN AT $79,907: THE $80K BATTLE IS NOT OVER
Bitcoin is back at $79,907, sitting just below the psychological $80,000 level after a week of violent swings. The market has already shown that bulls are willing to defend the lower levels, but Friday’s jobs shock proved that macroeconomic data can still overpower even strong institutional demand.
The real question now is simple:
Is BTC preparing for another breakout above $80K, or is this just another temporary recovery before a deeper correction?
📊 THE WEEK IN ONE VIEW
Bitcoin has experienced an unusually wide range over the
BTC+0.42%
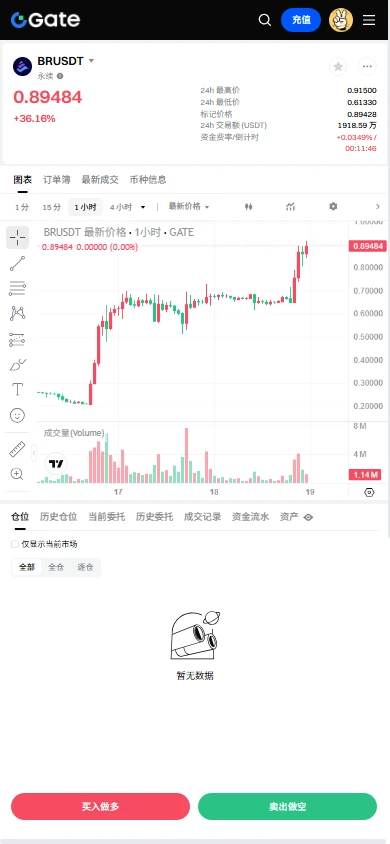
$ARB
UPDATE
#ARB is moving as predicted. Already 60%+ gain so far. ✍🏻
This is how we are cashing Market in VIP Room 👩‍💻👩‍💻👩‍💻
Join us today and start enjoying from day first 🤑🤑🤑
Already biggest discount offer available 70 USDT for lifetime Package✅
VIP:-
#ARBUSDT #ARBBTC #BTC #Bitcoin #Crypto
ARB+46.56%
BTC+0.42%
MARKET PREDICTION
live-cover
LIVE1,524
JUST IN: HYPE trades above $88 for a fresh all-time high, +4.21% over 24h. This adds upside tilt as momentum heats up in the memecoin-ish space. $HYPE
post-image
HYPE+4.88%
#BTCReclaims80K
Bitcoin’s Growing Twin: Why the Gold Correlation Just Hit 0.50
Here’s a development worth paying attention to: the 90-day correlation between Bitcoin and gold has surged to +0.50.
It’s the highest level we’ve seen since the COVID-19 crash of 2020. To put that into perspective, this metric has more than doubled since the start of the year. Back in 2022, during a relatively stable post-crash recovery, that same correlation peaked at a modest +0.30.
So, what changed?
The primary catalyst appears to be a specific policy shift from the U.S. Treasury. On August 19, they announced pl
post-image
BTC+0.42%
NAS100+0.06%
#​MU Micron Technology (MU) – Market Analysis (Data as of September 6, 2026, based on the September 4 regular session)
Micron closed its last completed trading session on Friday, September 4, 2026, at USD 1,014.95, up USD 56.46 or approximately 5.89 percent from the prior close of 958.49. The session ranged from 969.00 to 1,017.77 on roughly 30.7 million shares, the heaviest volume in twenty sessions at about 2.3 times its average, and the stock finished near its session high. US equities do not carry a rolling 24-hour change figure, so the latest full trading day is used here. That single-day
post-image
MU+5.89%
  • 3
$EPIC
UPDATE
#EPIC is getting a good volume here. In this move we can see 100%+ gain here ✍🏻
#EPICUSDT #EPICBTC #BTC #Bitcoin #NFTs
post-image
EPIC+26.07%
BTC+0.42%
84% of traders just faded this 4h bullish trend on NEAR — are they insane or early?

$NEAR /USDT - SHORT

Trade Plan:
Entry: 2.3831 – 2.4093
SL: 2.5592
TP1: 2.2740
TP2: 2.1925
TP3: 2.0702

Why this setup?
- Daily bias says up, but the 4h signal is screaming SHORT with 84% confidence.
- RSI(15m) at 63.2 shows local heat, not exhaustion — the pullback window is now.
- Entry zone 2.3831–2.4093 is tight; TP1 at 2.2740 is a 5% drop before the daily trend resumes.
- ATR(1h) 0.052 means moves are violent — this isn’t a slow bleed, it’s a snap.
- Why now? The 4h structure is rolling over wh
NEAR+6.56%
I was just about to go to the forum and rant, but then I saw my balance. Never mind—the market is always right.

When the dump started in the early session, $PEPE made a token rebound to around 0.000003984. It couldn't even hold that level, with pathetically weak buying support. This feeble rebound was clearly handing me a pillow for my short. After entering, I set my stop-loss and left it alone.

Looking again now, the current price is 0.000003635, and the profit has already reached +677.34%. Time to have a good meal, brothers. It was truly sluggish earlier, but the outcome is truly sweet.
post-image
PEPE+3.18%
ZEC+16.28%
DOGE+4.47%
$ETH Ecosystem with L2s and DeFi leading the charge the past week.
Outperforming everything from the major sectors.
Besides obviously the smaller memes that have been popping off. But those are not included in this chart.
post-image
ETH+1.97%
Everyone’s long XRP—but the 4h tape just whispered a trap at 1.4206.

XRP/USDT - SHORT

Trade Plan:
Entry: 1.4185 – 1.4227
SL: 1.4412
TP1: 1.4051
TP2: 1.3948
TP3: 1.3793

Why this setup?
Why now?
- 1D trend is *range*, meaning no momentum to break higher—shorts win chop.
- RSI 15m at 54 is lukewarm, not overheated—room to fade the pop.
- Entry 1.4206 with tight SL 1.4412 gives a 2.2R to TP2 (1.3948) before the real dump.
- ATR 1h is thin (0.0086)—low volatility means the range top is sticky, not explosive.

Debate:
Are you fading 1.42 or buying the dip to 1.40 first?
XRP+1.23%
#晒出我的持仓收益#
Target to get below 0.005
Blow off top in 4 year cycle searches..
Imagine how many people are sidelined...
post-image
The hand that set the stop-loss a few days ago trembled slightly; this morning, I realized that was unnecessary filial piety. The last thing I saw before bed was $PENGU struggling to rebound, with every push upward falling just short—a typical lack of buying support. Without any hesitation, I placed a short order and entered at 0.009680. Looking again today, it had already reached 0.008813, +699.65%. The market specializes in humbling all kinds of defiance, especially a reckless fool like me who thought it would shoot to the moon. I won't claim a huge profit, but I handled this small swing per
post-image
PENGU+2.64%
DOGE+4.47%
SOL+4.10%
Since you’re in Chengdu, how could you not visit Wuhou Shrine? $SOL
{spot}(SOLUSDT)
SOL+4.12%
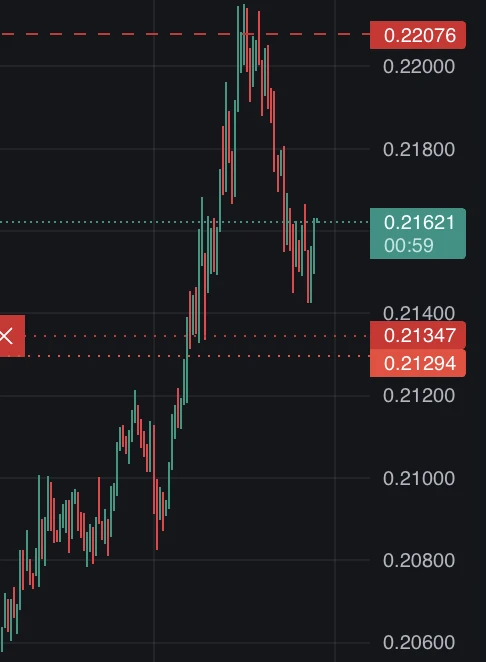
Everyone’s staring at USELESS while the 4h chart quietly prints a 95% long setup.

$USELESS /USDT - LONG

Trade Plan:
Entry: 0.22366 – 0.23278
SL: 0.18441
TP1: 0.26108
TP2: 0.28299
TP3: 0.31585

Why this setup?
Why now? The 1D trend is bullish, but the 15m RSI (44.53) just reset—buyers reloaded before the breakout. Entry zone: 0.22822 (low 0.22366). Target ladder: TP1 0.26108 (+14%), TP2 0.28299 (+24%), TP3 0.31585 (+38%). ATR (0.018) says volatility is compressed—spring is loaded. Stop at 0.18441 keeps risk tight.

Debate:
Is USELESS the next 2x runner, or does the 0.14884 invalidation tr
USELESS-6.63%
#Gate60MillionUsers
$ZEC Market cap surpasses $DOGE , becoming the 10th largest cryptocurrency by market cap. A man's intuition tells me that ZEC should enter the top five by market cap, and more aggressively, it could pull down $SOL and enter the top three.
post-image
ZEC+16.11%
DOGE+4.45%
SOL+4.12%
Everyone’s still calling ZEC bullish—but the 4H tape just whispered a secret nobody heard yet.

$ZEC /USDT - SHORT

Trade Plan:
Entry: 1164.47 – 1178.43
SL: 1258.51
TP1: 1106.15
TP2: 1062.62
TP3: 997.32

Why this setup?
Why now? Your 1D trend says "up," but that’s the trap. The 4H structure is flipping SHORT with 84% confidence while price stalls at 1171.45—right under that 1178.43 rejection zone. RSI on the 15m is cooling at 56.6, meaning buyers are losing steam, not gaining it. ATR of 27.9 on the 1H shows volatility is ripe for a snap. Targets aren’t dreams: TP1 at 1106.15, TP2 at 1062.62
ZEC+16.28%
Load More

Join 40 M users in our growing community

⚡️ Join 40 M users in the crypto craze discussion

💬 Engage with your favorite top creators

👍 See what interests you

View More