Square
Following
Hot
News
Profile
Share your thoughts
placeholder
Article
11.2 BTC Analysis
After a low-volume weekend consolidation and range-bound shakeout, the market has broken out of its previous stalemate and is showing a strong bullish setup as buyers build momentum.
Capital flows have turned positive, with significant net inflows, reflecting dip buying. Technically, a strong bullish candlestick with a full body has stabilized above the Bollinger Band middle line, which has shifted from flat to upward-sloping, forming solid dynamic support. The TTMU momentum line below is diverging bullishly, indicating that short-term momentum has effectively recovered.
Howe
post-image
BTC-0.67%
The weather’s getting cooler.
Let’s have something to warm our stomachs. Same as always, X friends, you eat first 👋.
Once you’ve finished, I have a question for you.
Guess where this breakfast is from 👀?
Trenches
ZIG
Z
bade
b
ZIG
0x8c...1145
Market Cap
$.
Change
.
24h Vol
$.
Holders
.
uni
u
bade
b
uni
jM9r...pump
Market Cap
$.
Change
.
24h Vol
$.
Holders
.
Anakin
A
bade
b
Anakin
Exxz...pump
Market Cap
$.
Change
.
24h Vol
$.
Holders
.
IDOL
I
bade
b
IDOL
0x3b...ab07
Market Cap
$.
Change
.
24h Vol
$.
Holders
BTC
B
bade
b
BTC
C5xp...pump
Market Cap
$.
Change
.
24h Vol
$.
Holders
.
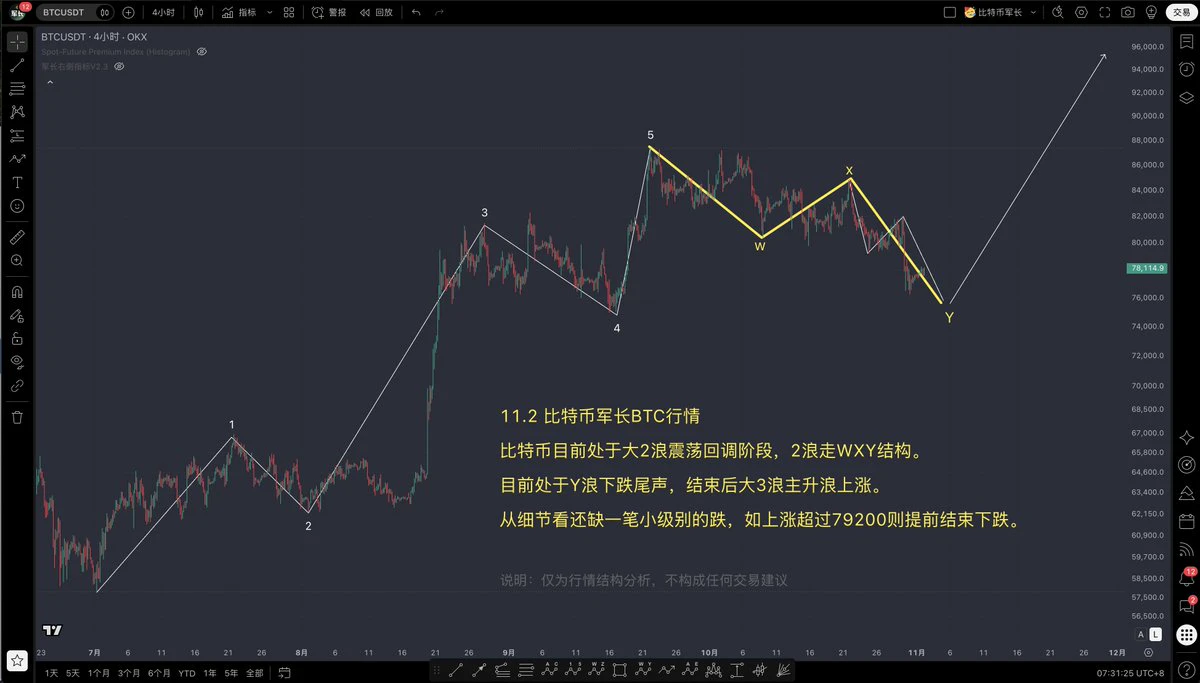
$BTC 11.2 Bitcoin Trend Analysis
Bitcoin is currently in the corrective consolidation phase of major Wave 2, which is forming a WXY structure.
It is currently in the late stage of Wave Y’s decline. Once it ends, the major Wave 3 uptrend will begin.
In more detail, one small-degree downward move is still missing. If the price rises above 79200, the decline will end early.
Risk warning: This is only an analysis of market structure and does not constitute any trading advice.
#BTC走势分析 #比特币走势分析
post-image
BTC-0.67%
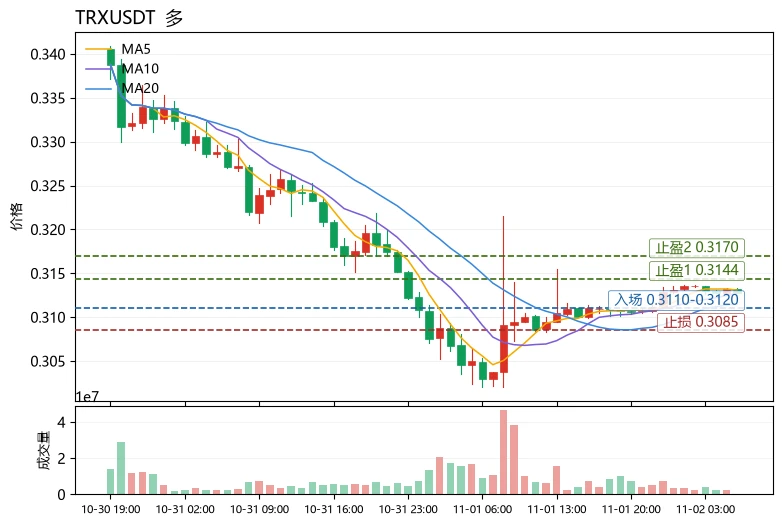
$TRX The most unusual detail in today's market isn't the gain, but the funding rate: up 3.17% in 24h, while the perpetual funding rate is -0.0161%. The price is rising while shorts are still paying to hold their positions, indicating this rally isn't driven by crowded leveraged longs, so the risk of chasing the price is relatively limited. Viewed through a moving-average framework, this is a reusable way to assess the market: a healthy trend isn't defined by how far the price is from the moving averages, but by whether the short-term averages hold above the long-term averages and pullbacks st
post-image
TRX+0.42%
AAVE-1.22%
XRP-1.15%
Dinner in Tokyo.
Breakfast in Singapore.
Let’s put rektober behind us.
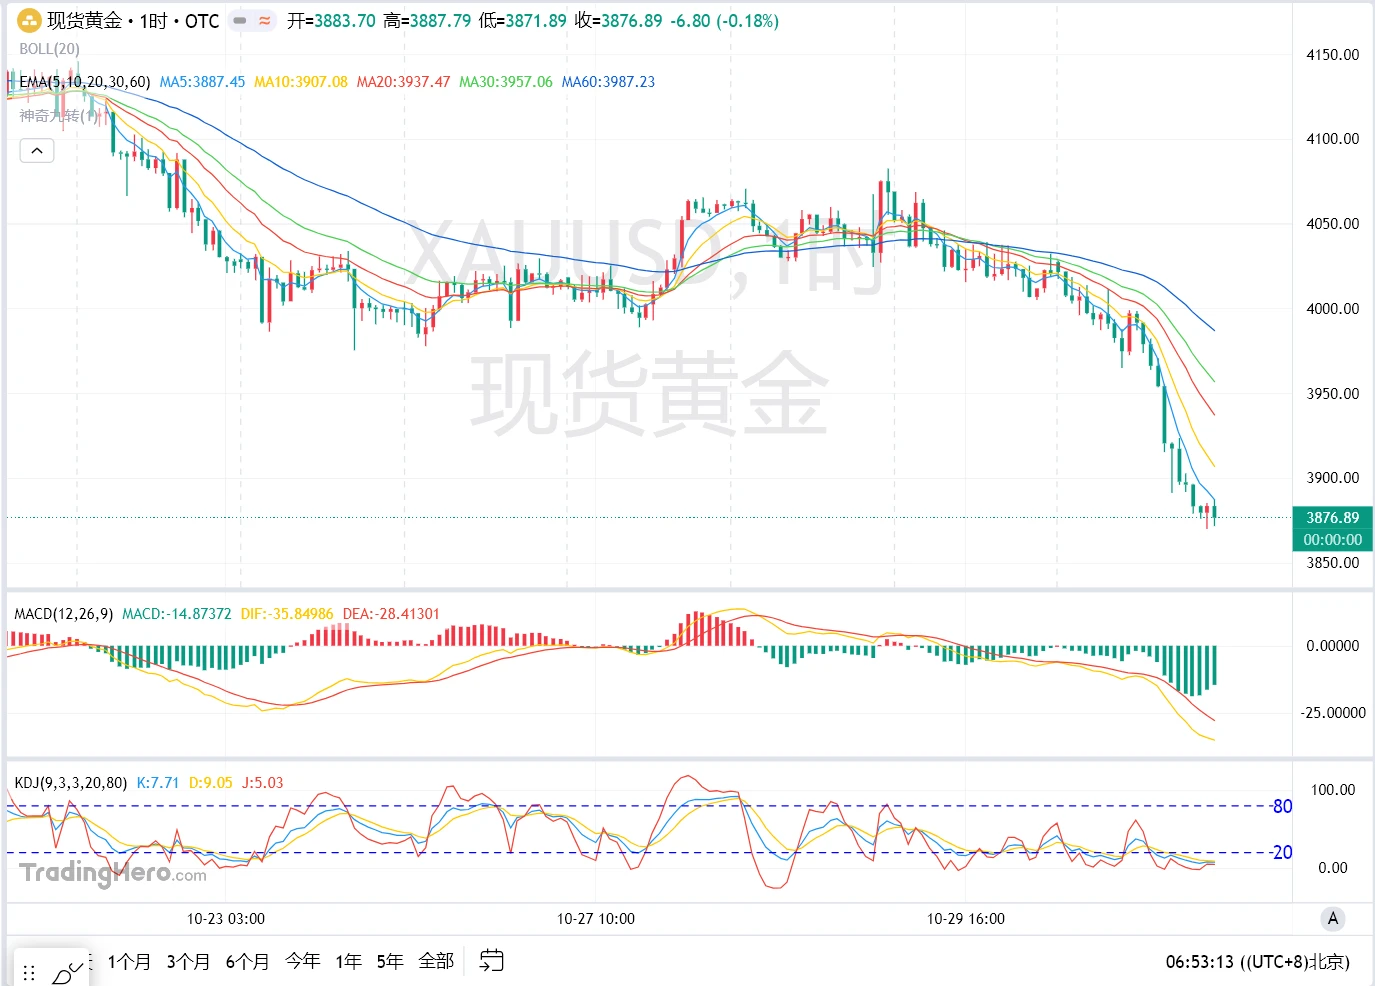
November 2 Gold Morning Brief
Gold plunged sharply last Friday, falling nearly $160 and becoming severely oversold. It touched an intraday low near $3,870 and closed near $3,876. The daily chart formed a large bearish candle, breaking straight through the key 3,900 level as bearish momentum was fully unleashed.
Fundamentally, the Fed left interest rates unchanged at its decision early Thursday morning last week, but that does not mean dovish views are in control. Fed Chair Warsh hinted that there is still room for rate hikes, and market expectations for a 25-basis-point hike in December rose t
post-image
XAUUSD+0.64%
Strive's corporate strategy under CEO Matt Cole is built around a "perma-long Bitcoin, short the dollar" thesis.
Instead of traditional debt, the firm uses digital credit via preferred equity as its mechanism to amplify BTC returns. This unique financing structure avoids the standard pitfalls of leverage by remaining completely non-maturing, unencumbered, and immune to margin calls.
‍#CryptoObservers #ShareWeekly
post-image
ASST-10.77%
SATA-3.48%
BTC-0.67%
Buy $MAGMA . The plan remains simple: entry price 0.44841–0.45357, take profit at 0.4780, then 0.500; stop loss at 0.43496. The magma is cooling—get ready for the next eruption, brothers. Put on your heat-resistant suits; we're going to test 0.48! Note: Low volume and declining open interest could lead to a further retest of lower support. Brothers, don't go all-in. Manage your position size based on your account.
post-image
MAGMA-0.57%
IT Home reported on November 1 that miHoYo’s life simulation game Petit Planet will launch on Switch 2 in 2027, while the PC/iOS/Android versions will begin their global open beta on December 4. The game is themed around interstellar pastoral life, letting players go beachcombing, fish, farm, customize the sky, coast, and land, and befriend animal characters such as Yunguo and Izoki.
The staggered multi-platform rollout gives players on mobile and PC an early way to try the game, while Switch 2 users will have to wait until 2027. For a game centered on getting together with a few friends, buil
post-image
BTC-0.67%
US futures are open higher.
US-7.44%
Afternoon Market Updates
live-cover
LIVE806
Caption it.
post-image
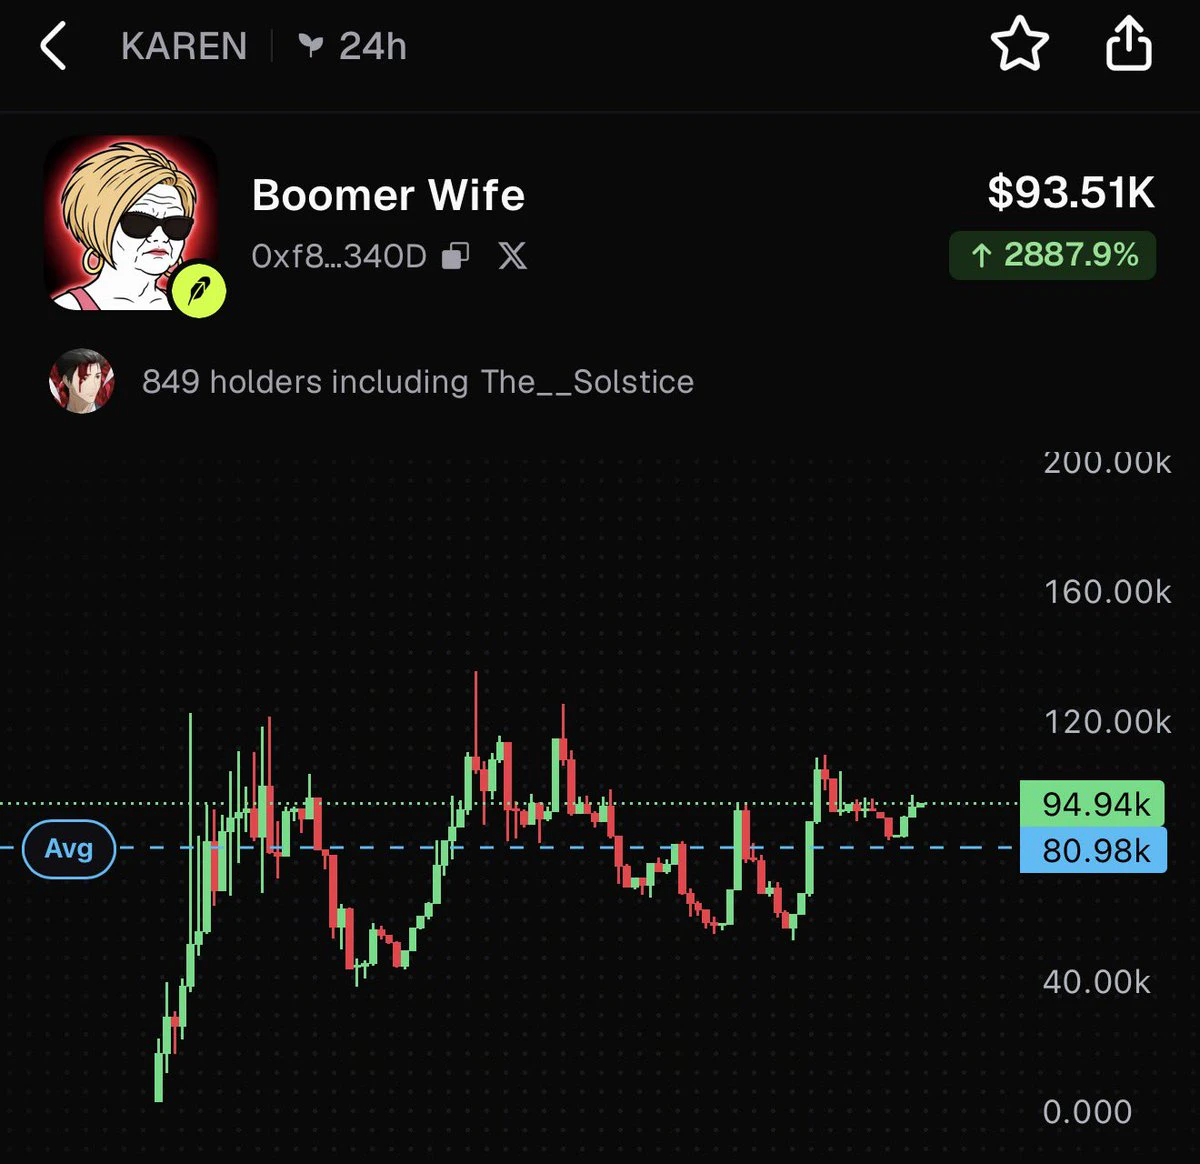
Memecoin holders in November
post-image
MEME-0.94%
market update
live-cover
LIVE2,218
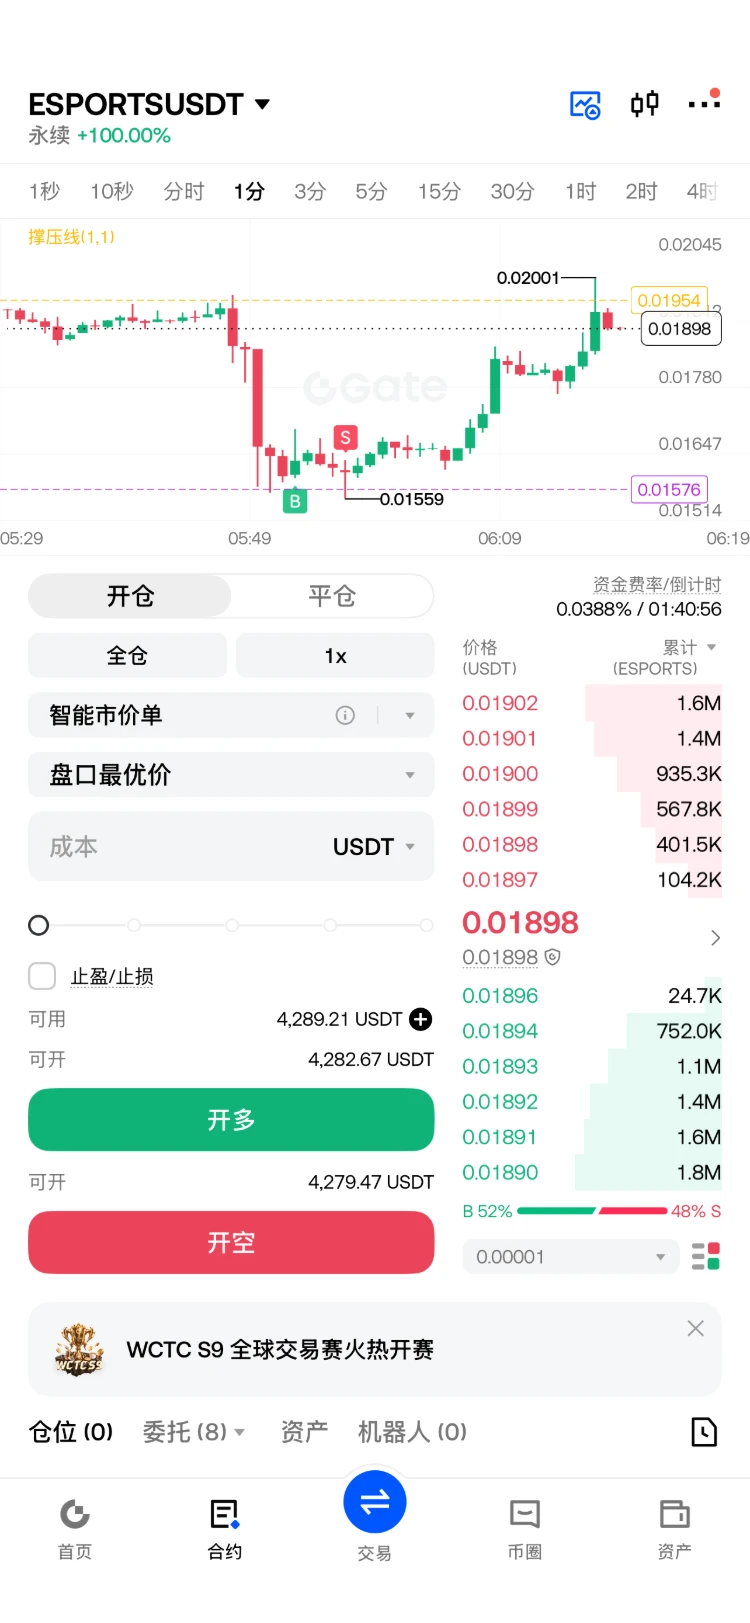
I went long on ESPORTS. Should’ve known better than to set a stop-loss—I got stopped out with pinpoint precision🤣
post-image
ESPORTS-4.77%
  • 4
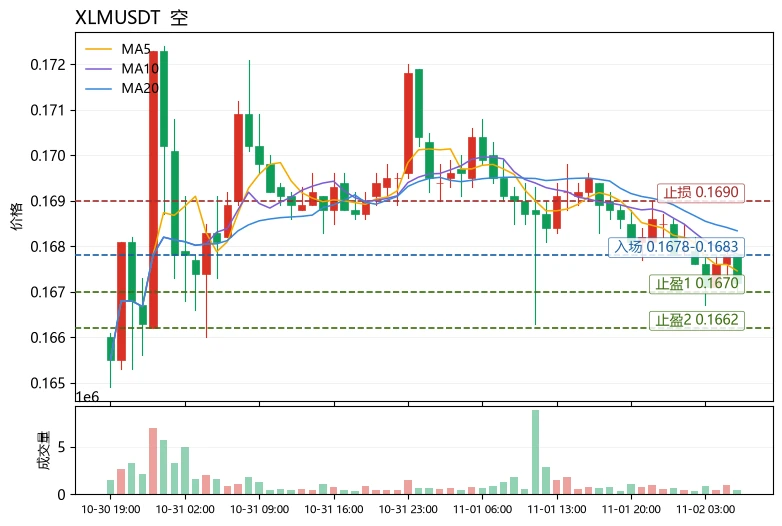
Does a moving-average death cross plus weakening RSI mean you should always chase shorts? Not necessarily—the key is to check where the price sits within the Bollinger Bands and whether the funding rate confirms the move. $XLM is currently a “weak but not collapsing” example, making it a good case for a reusable chart-reading method: use moving averages to determine trend direction, Bollinger Bands to determine price position, and RSI and the funding rate to gauge sentiment.
First, the trend: MA5=0.16746 has fallen below MA20=0.16834, and the MACD histogram is -0.0001168, confirming a bearish
post-image
XLM-0.64%
XRP-1.15%
SUI-1.05%
This chart looks like it wants to rip.
I like it.
post-image
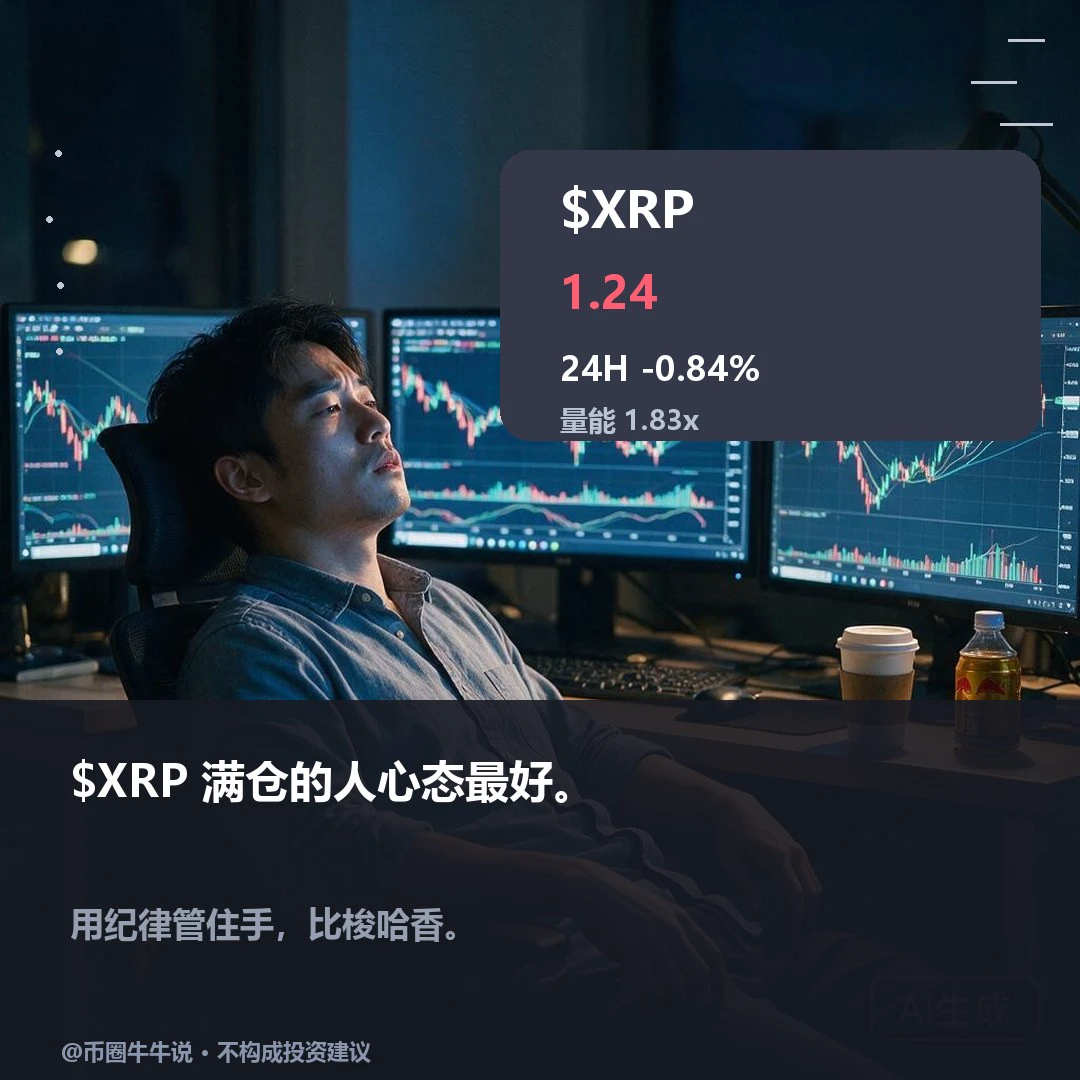
Conflicting signals: $XRP is currently at 1.2443. The one-hour and four-hour trends are both weak, but the price is not far from resistance at 1.26. Pushing above it intraday and holding there are two different things.
Trading is active, but it hasn't sent the price back above resistance, indicating bulls and bears are still locked in a tug-of-war; calling it a confirmed breakout just because it touched resistance intraday is usually premature.
Does a brief intraday push above resistance count as a confirmed breakout?
Only if the price holds above resistance for a sustained period is it worth
post-image
XRP-1.15%
Interesting market action—keeps wicking down, then bouncing right back up $ETH
ETH-1.23%
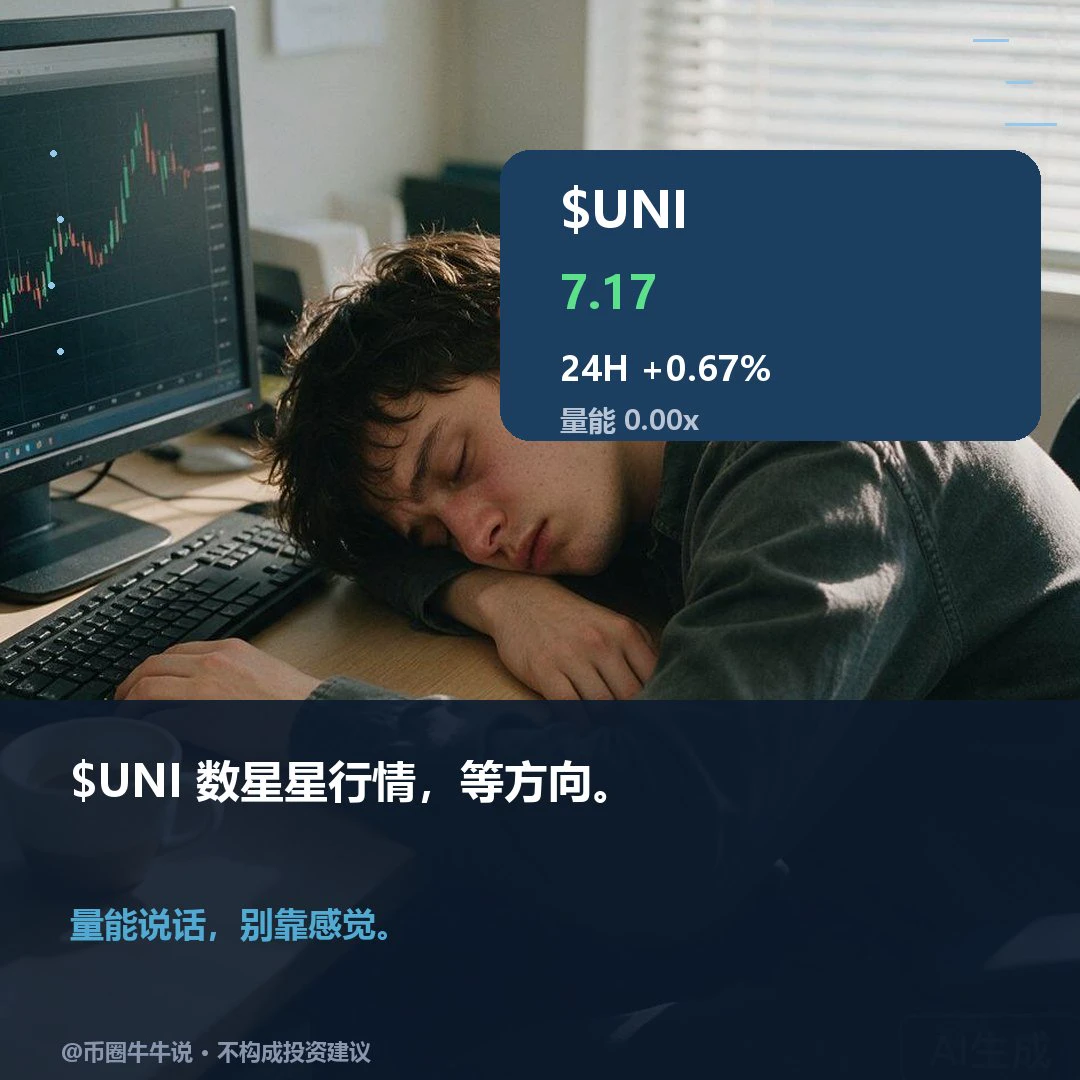
$UNI is currently at 7.17, up 0.67% over 24H. The 1H chart is weak (RSI 42.1), while the 4H chart is strong (RSI 59.8), indicating a divergence. If it holds above the 7.4 resistance, a rebound may be worth watching; if it breaks below the 7.021 support, it may move lower. In the follow-up review, watch whether it can hold above resistance and recover after losing support. With the two time frames diverging, short-term moves should not be taken directly as a trend reversal. Market volatility is high; for observation only.
post-image
UNI+3.05%
Load More

Join 40 M users in our growing community

⚡️ Join 40 M users in the crypto craze discussion

💬 Engage with your favorite top creators

👍 See what interests you

Trending Topics

BTC大跌

537.51k Views39.94k Discussing

$BTC briefly fell below $77,000 and remains under pressure around the $77K zone, with its 24-hour decline still above 4%. With risk appetite weakening and Fed uncertainty rising, where is the next key support after losing $80K?

IntelBeatsEarningsButStockPlunges

50.9k Views1.1k Discussing

StrategySTRCNears100ParValue

59.57k Views4.23k Discussing

View More