Square
Following
Hot
News
Profile
Share your thoughts
placeholder
Article
Too outrageous, $BTW has been pumped way too hard. Lee is preparing to short heavily, anticipating a potential downturn. $AGT Strongly short $Q 🥳🥳🥳
post-image
BTW+19.26%
AGT+22.63%
BTC down 0.62% in 24 hours, $31.89 million dumped in the final hour
Gate spot BTC/USDT is currently quoted at 81285.5 USDT, down 0.62% over 24 hours, with a high of 81818.4 and a low of 80817.0. That 0.62% is almost negligible on the daily chart, but the final hourly candle was different: it opened at 81647.1, plunged to a low of 80817.0, and closed at 81124.9, with 31.89 million USDT in single-hour trading volume—more than three times the previous hour’s roughly 8.71 million.
What concerns me more is whether this drop was backed by volume. Looking at the latest 48 hourly candles, the volume p
post-image
BTC+0.01%
Trenches
AGT
A
bade
b
AGT
0x5d...e274
Market Cap
$
Change
.
24h Vol
$.
Holders
.
CNPY
C
bade
b
CNPY
0xc6...ddd2
Market Cap
$.
Change
.
24h Vol
$.
Holders
.
COVENANT
C
bade
b
COVENANT
0xcd...de79
Market Cap
$.
Change
.
24h Vol
$.
Holders
.
Q
Q
bade
b
Q
0xc0...0589
Market Cap
$.
Change
.
24h Vol
$.
Holders
.
Gato
G
bade
b
Gato
55A3...pump
Market Cap
$.
Change
.
24h Vol
$.
Holders
.
#日韩股集体大跌
KOSPI +3.3%: A relief bounce or the start of a recovery?
My initial assessment: This appears to be a potential relief rally; however, a single strong session is not enough to confirm a broader recovery. The key question is whether semiconductor stocks can sustain this rebound following the sharp sell-off, or if the gains are merely driven by short covering and bargain hunting.
The gains seen in Samsung Electronics (+3.6%) and SK Hynix (+3.4%) are particularly significant, as the South Korean market is highly sensitive to semiconductor sentiment and the global AI-memory trade.
What is
post-image
ybaser
#日韩股集体大跌
KOSPI +3.3%: A relief bounce or the start of a recovery?
My initial assessment: This appears to be a potential relief rally; however, a single strong session is not enough to confirm a broader recovery. The key question is whether semiconductor stocks can sustain this rebound following the sharp sell-off, or if the gains are merely driven by short covering and bargain hunting.
The gains seen in Samsung Electronics (+3.6%) and SK Hynix (+3.4%) are particularly significant, as the South Korean market is highly sensitive to semiconductor sentiment and the global AI-memory trade.
What is driving the recovery?
1. The sell-off may have overshot the fundamentals
On October 15, the KOSPI fell by 7.57%, closing at a six-month low following seven consecutive days of losses. During this sell-off, Samsung and SK Hynix lost 23.9% and 31.5% of their value, respectively—creating an opening for bargain hunters to return.
2. Memory chip fundamentals remain supportive
Analysts continue to highlight tight memory supply, robust demand related to artificial intelligence, and expectations for rising DRAM prices. This supports the view that the sell-off was driven more by sentiment and positioning than by a collapse in earnings expectations.
3. Global risk appetite has improved
A recovery in U.S. equities, combined with easing concerns regarding AI-related credit risks, has helped fuel a rebound in Asian technology stocks. However, concerns regarding returns on investment in artificial intelligence, financing costs, and interest rates have not dissipated.
A relief rally or a sustainable recovery?
Bullish scenario — a lasting recovery
* The KOSPI remains above its recent low.
* Samsung and SK Hynix continue their recovery.
* Foreign investors return as net buyers.
* Earnings forecasts and expectations for memory chip prices remain robust.
Bearish scenario — a short-lived rebound
* The index rises toward a resistance level and then reverses.
* Foreign investors continue to sell Korean stocks.
* U.S. bond yields rise, or renewed concerns regarding AI valuations weigh on chip stocks.
* Samsung and SK Hynix fall back below their recovery levels.
What should investors watch for next?
The most critical indicator is not the magnitude of the initial rebound, but whether buying pressure is sustained.
Indicator Bullish interpretation
Foreign investor flows Consistent net buying
Samsung and SK Hynix Gains sustained over several sessions
Memory chip pricing Continued strength in DRAM and HBM
U.S. Treasury yields Stabilization or decline
Earnings expectations Maintenance of upward revisions
A key distinction: On October 16, the KOSPI recorded an intraday gain of up to 3.17%, but closed the day up 2.05% at 5,668.05. Consequently, the sharp intraday rally made the final gain at the close appear more significant than it actually was.
My View
Short-term: Cautiously optimistic
A recovery is possible.
Oversold conditions and attractive entry points could support further gains, though volatility is likely to remain high.
Medium-term: Conditional
Not yet confirmed.
A more substantial recovery would require the stabilization of foreign investor inflows, supportive earnings data, and a more durable improvement in sentiment toward the global technology market.
In summary: I view the 3.3% move not as proof that the downtrend has ended, but as a promising first step. Earnings expectations for the semiconductor sector provide a firmer foundation for this recovery—moving it beyond a mere technical rebound—but the market must demonstrate that buyers are willing to hold their positions, even amidst renewed volatility.
A key factor to watch in the near term will be the earnings outlooks from SK Hynix and Samsung Electronics, set to be released on October 28 and October 29, respectively. These reports could prove decisive in determining whether the recent sell-off was an overreaction or if it reflects a more fundamental reassessment of the AI-driven memory market.
$MU ‌
$SNDK ‌$NVDA ‌
repost-content-media
  • 3
market update
live-cover
LIVE85
🚨 YOUR CRYPTO WALLET COULD BE TARGETED WITHOUT YOU CLICKING A SINGLE LINK.
Imagine waking up, checking your phone, and discovering that your crypto accounts may have been exposed — even though you never clicked a suspicious link or downloaded a strange app.
That is the danger of ZERO-CLICK SPYWARE. 🕵️
Most people think hackers need them to make a mistake before an attack can happen. Unfortunately, that is not always true.
⚠️ HOW DOES THIS THREAT CONNECT TO CRYPTO?
Zero-click spyware exploits vulnerabilities in a device's software to gain unauthorised access without requiring the victim to in
post-image
GT-3.00%
‍#每周来晒 #WCTCS9
Preview of Next Week’s Major Financial Events
2026-10-19 (Monday)
10:00 China’s Q3 GDP, September industrial value added, fixed-asset investment, and total retail sales of consumer goods
22:00 US October NAHB Housing Market Index
2026-10-20 (Tuesday)
09:15 China’s October LPR quotation 17:00 Eurozone October ZEW Economic Sentiment Index 20:30 US September housing starts and building permits
22:00 US September pending home sales index MoM
NVIDIA GTC conference (10.20–10.22)
2026-10-21 (Wednesday)
16:00 UK September CPI YoY
22:30 US EIA crude oil inventories for the week ending O
post-image
NVDA-1.42%
TSLA-2.17%
SPGI+1.13%
#CryptoMarketTurnsGreedy #ShareWeekly
CRYPTO MARKET SENTIMENT IS TURNING GREEDY: THE NEXT RALLY OPPORTUNITY OR A WARNING SIGN?
The cryptocurrency market is entering an interesting phase as sentiment shifts toward greed. After periods of uncertainty, growing optimism can encourage buyers to return, increase trading activity, and create fresh opportunities across Bitcoin, Ethereum, and the broader altcoin market. But there is one important question every trader should ask: Is this confidence supported by real market strength, or are emotions beginning to take control?
1. Understanding the Shift
BTC+0.03%
ETH-0.61%
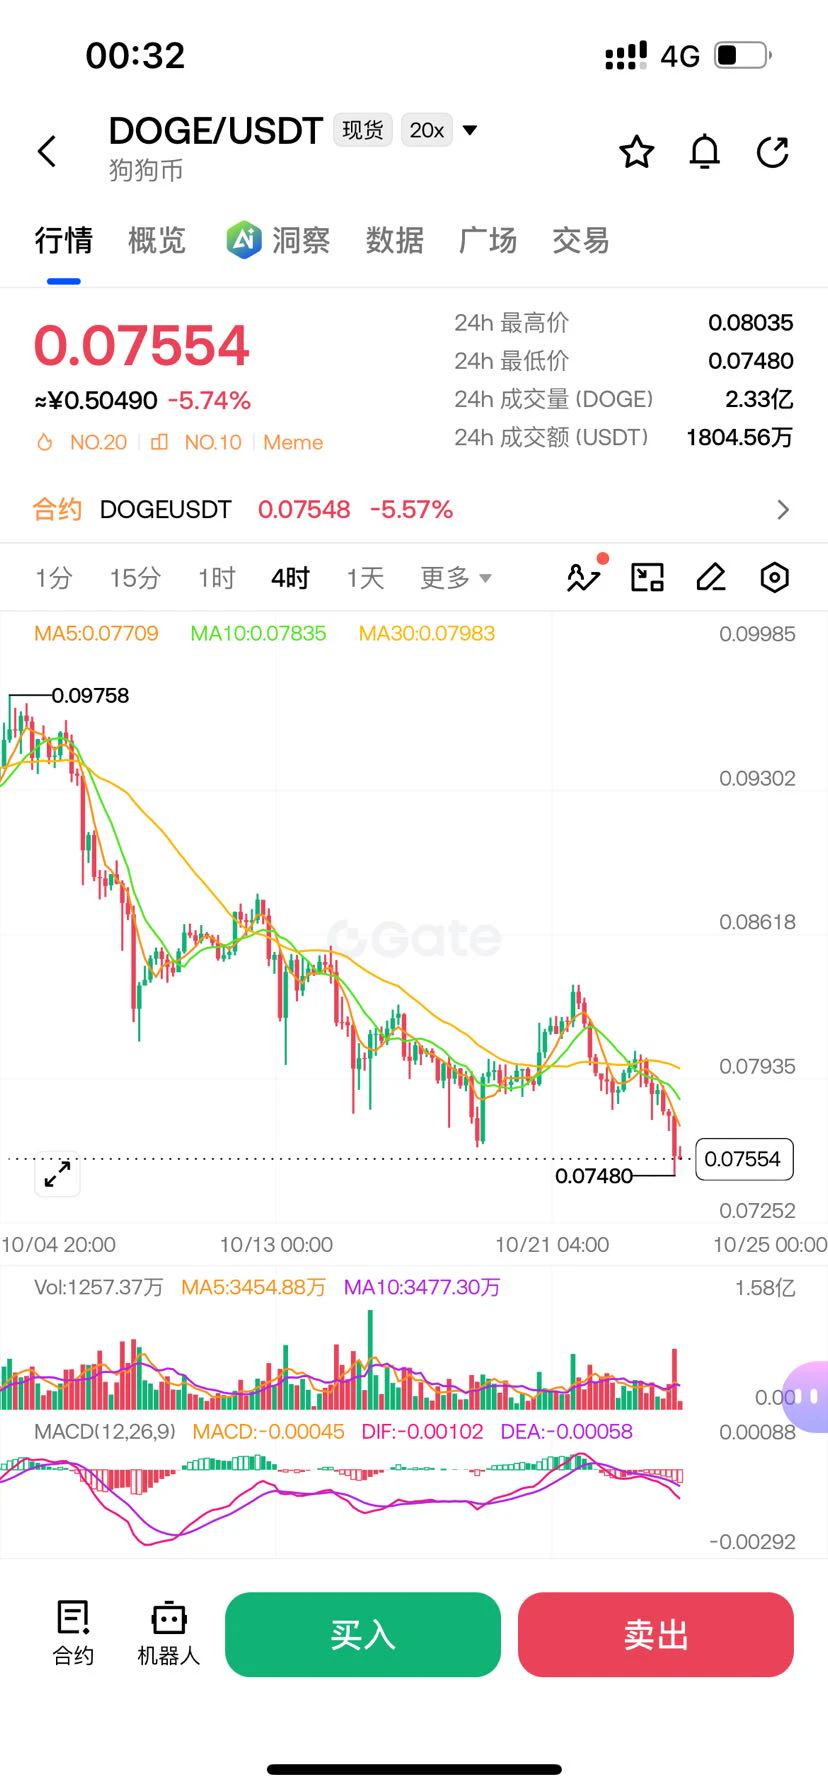
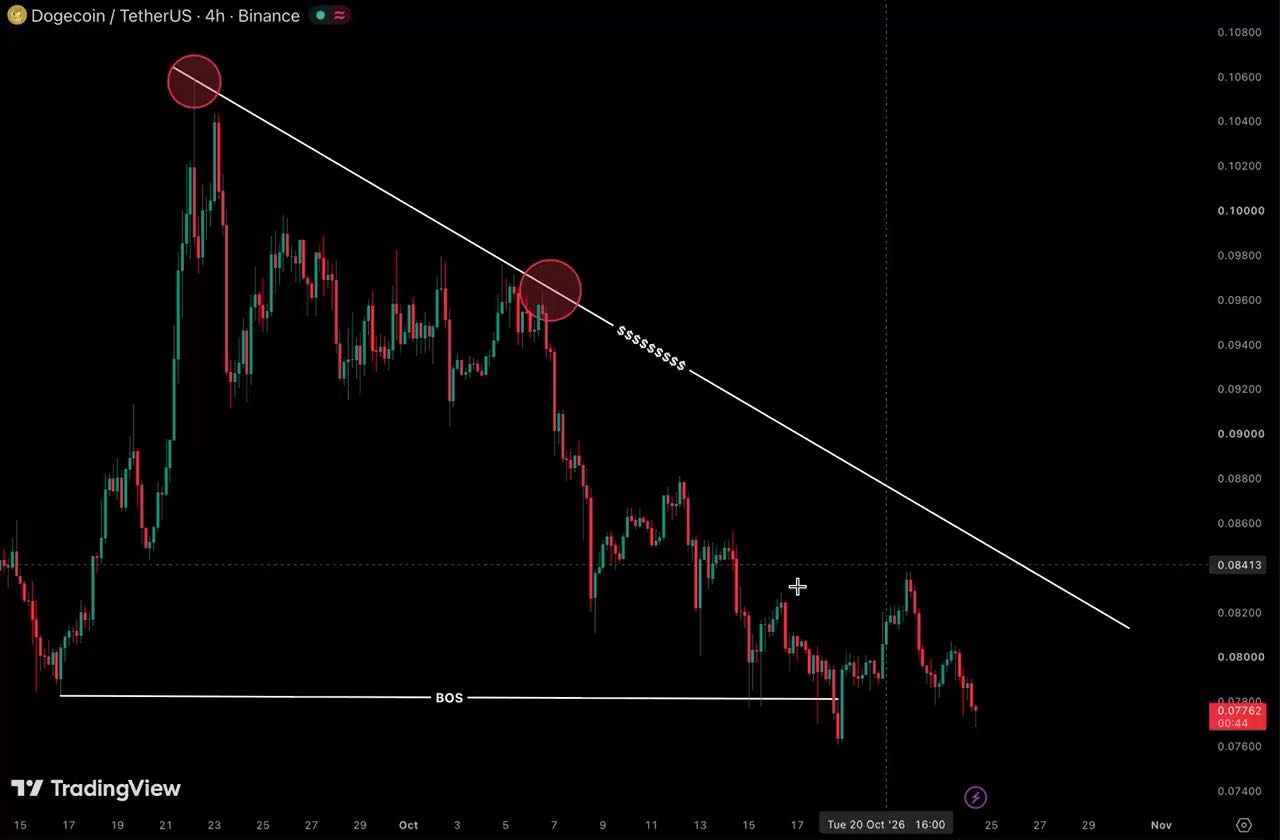
$DOGE Current price: 0.07909. The first resistance above is 0.0799, where the Bollinger midline and MA20 converge. Support is at the lower Bollinger Band at 0.0786; a break below opens up room to 0.0780. The chart is in a bearish alignment: MA5 at 0.07937 is below MA20 at 0.07989, the MACD histogram remains negative at -5.47e-05, and RSI at 41.3 is weak but not oversold. The 30-candle range is only 5.17%, indicating a low-volume drift down rather than panic selling.
The real point of contention is the funding rate: at -0.0009%, it is negative, with shorts continuously paying longs, indicating
post-image
ZEC-1.45%
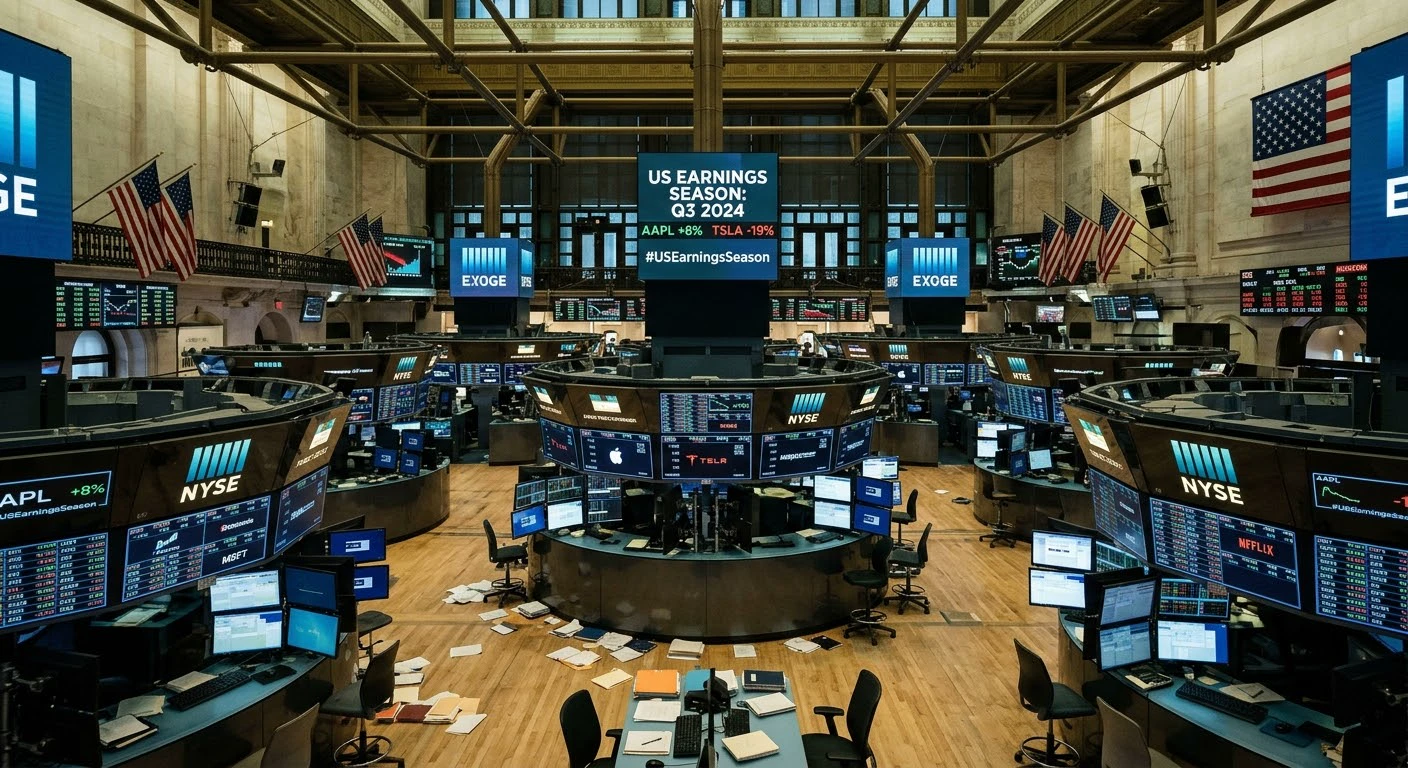
#美股存储板块跌幅扩大
The core question is whether this represents a healthy correction following a rally driven by artificial intelligence (AI), or the beginning of a deeper repricing process within the storage sector. Rather than buying simply because prices have fallen, it would be more prudent to focus on earnings expectations, memory pricing, and whether each company can maintain its profit margins.
My perspectives on storage sector stocks:
* Micron (MU): Monitor demand for DRAM and HBM, memory growth linked to AI, and gross profit margin forecasts. Strong AI demand could bolster earnings, though
post-image
ybaser
#美股存储板块跌幅扩大
The core question is whether this represents a healthy correction following a rally driven by artificial intelligence (AI), or the beginning of a deeper repricing process within the storage sector. Rather than buying simply because prices have fallen, it would be more prudent to focus on earnings expectations, memory pricing, and whether each company can maintain its profit margins.
My perspectives on storage sector stocks:
* Micron (MU): Monitor demand for DRAM and HBM, memory growth linked to AI, and gross profit margin forecasts. Strong AI demand could bolster earnings, though these expectations may already be priced into the stock.
* SanDisk (SNDK): Focus on NAND flash pricing, demand for enterprise SSDs, and the sustainability of any earnings recovery. NAND supply and price cycles can make this stock particularly volatile.
* Western Digital (WDC): Evaluate "nearline" (high-capacity/accessible) HDD demand from AI data centers, cloud computing expenditures, and free cash flow. The factors influencing HDD demand differ from those affecting NAND and DRAM.
* Seagate (STX): As data center storage requirements grow, keep an eye on demand for high-capacity drives, pricing power, and profit margins.
* Track NAND market conditions, enterprise SSD adoption rates, and the company's valuation relative to earnings expectations.
What signs might justify rebuilding a position? I would look at the following three points:
* Stabilization of fundamental indicators: A halt in the deterioration of memory and NAND prices, company forecasts, and earnings estimates.
* Confirmation through price action: Stocks forming higher lows and reclaiming key moving averages, accompanied by stronger trading volume.
* Attractive valuation: Expected earnings growth that justifies the current price, even under less optimistic scenarios.
A decline in a stock price is not, by itself, a buy signal. If earnings estimates are falling faster than the stock price, the valuation may not have actually become cheaper.
Rather than buying the entire storage sector indiscriminately, I prefer to differentiate between individual companies. While AI demand serves as a long-term tailwind, memory, NAND flash, and hard disk drives each have their own unique supply cycles, competitive pressures, and profit margins.
An important distinction: A pullback driven by profit-taking is fundamentally different from one caused by weak forward guidance or falling memory prices. The latter scenario warrants a much more cautious approach. Which of these stocks—MU, SNDK, WDC, or STX—are you following most closely? I can help you compare their valuations, earnings outlooks, technical levels, and the potential factors that could support a recovery.
$MU ‌$SNDK ‌$WDC ‌$STX ‌
repost-content-media
MU-5.66%
SNDK-6.90%
  • 5
Set it up this way to automatically clean up 99% of comments.
Hong Hao: The current market has entered oversold territory and is in the final stages of the sell-off. All risk assets are oversold, and a rebound is highly likely before the end of the year.
post-image
BREAKING: Meta's Muse Wonder and Muse Spark are now live on Venice, available privately. Venice also added NVIDIA's Nemotron 3.5 Super VL and Tencent's Hy4 Preview since October 15.
@AskVenice
NVDA-1.42%
TENCENT+0.00%
Making a little bear—almost 2 hours and it’s still not done. At a rough glance, the interface looks inferior to SOL6.1 but better than LUNA. So this is the DEEPSEEK-V4.1-FLAH-1017 you were hyping? By the way, it has cost ¥3 so far
post-image
LUNA-5.24%
DEEPSEEK-4.55%
$BTC BOOM💣It's about to explode soon; the big player is starting to accumulate, forming a daily double bottom, with a large pool of liquidity above🤩
Long, long, long🔥🔥TP1: 82500 TP2: 84000 TP3: 87000-90000 SL: 78200$AG $ETH
post-image
BTC+0.01%
AG-0.65%
ETH-0.60%
EIA data determines the short-term direction of crude oil
live-cover
LIVE1,421
$PI If you insist on holding and refuse to sell, capital will insist on staying out of the market. The price will keep fluctuating, wearing you down until you’re completely broke—then let’s see if you’ll finally cut your losses. Capitalists have plenty of money and no urgency. But you’re poor and need money for all sorts of things; you can’t wait.
Someone asked, “When will it go up?” A rise may only happen after all of you have sold the coins you’re holding.
post-image
PI-0.95%
  • 3
#NEARJumpsNearly10% #ShareWeekly
INFLATION SHOCK, BITCOIN AT $82K, NEAR’S RALLY, AND NVIDIA: WHAT COMES NEXT FOR THE CRYPTO MARKET?
The financial markets are entering a critical phase where inflation, Federal Reserve policy, technological innovation, and speculative trading are shaping investor sentiment. The latest U.S. Producer Price Index (PPI) data has challenged expectations of a smooth monetary easing cycle, while Bitcoin’s recovery toward $82,000, NEAR Protocol’s nearly 10% surge, and renewed meme-coin speculation reveal a market full of contrasting signals.
1. U.S. PPI: Inflation Rema
BTC+0.01%
NVDA-1.42%
MEME-2.90%
TSLAX-0.75%
TOKEN-1.74%
Money is already piling in to assets pre-market, have they forgotten how these external markets operate? Its about to get very violent.
Hyperliquid, slaughter house edition.
post-image
HYPE-2.03%
AVAX keeps sliding, bears are in control, heading straight for 9.30! Short $AVA .
Entry: 9.727 - 9.776 Take profit: 9.277 - 8.897 Stop loss: 10.069 Note: If the 9.55 support level suddenly rebounds, it could trap people chasing shorts. Don't go all in, buddy. Position size should suit your own account. Watch the downtrend. 👇👇👇 Continue to follow $AV and $BTC .
post-image
BTC+0.01%
Load More

Join 40 M users in our growing community

⚡️ Join 40 M users in the crypto craze discussion

💬 Engage with your favorite top creators

👍 See what interests you

Trending Topics

USSeptemberPPIBeatsExpectations

91.35k Views1.93k Discussing

US September PPI came in at 6.3% YoY, well above the 5.3% market expectation, pointing to renewed producer-side inflation pressure. Weekly jobless claims were 199K, broadly in line with forecasts. Could hotter inflation further reduce room for rate cuts, and what does it mean for $BTC, US stocks, and gold?

GateWCTCS9GlobalTradingCompetition

37.87k Views6.68k Discussing

GateBTCAndETHFuturesVolumeRanksTop3

53.8k Views1.81k Discussing

View More