


Square
Following
Hot
News
Notifications
Profile
Share your thoughts
placeholder
Article
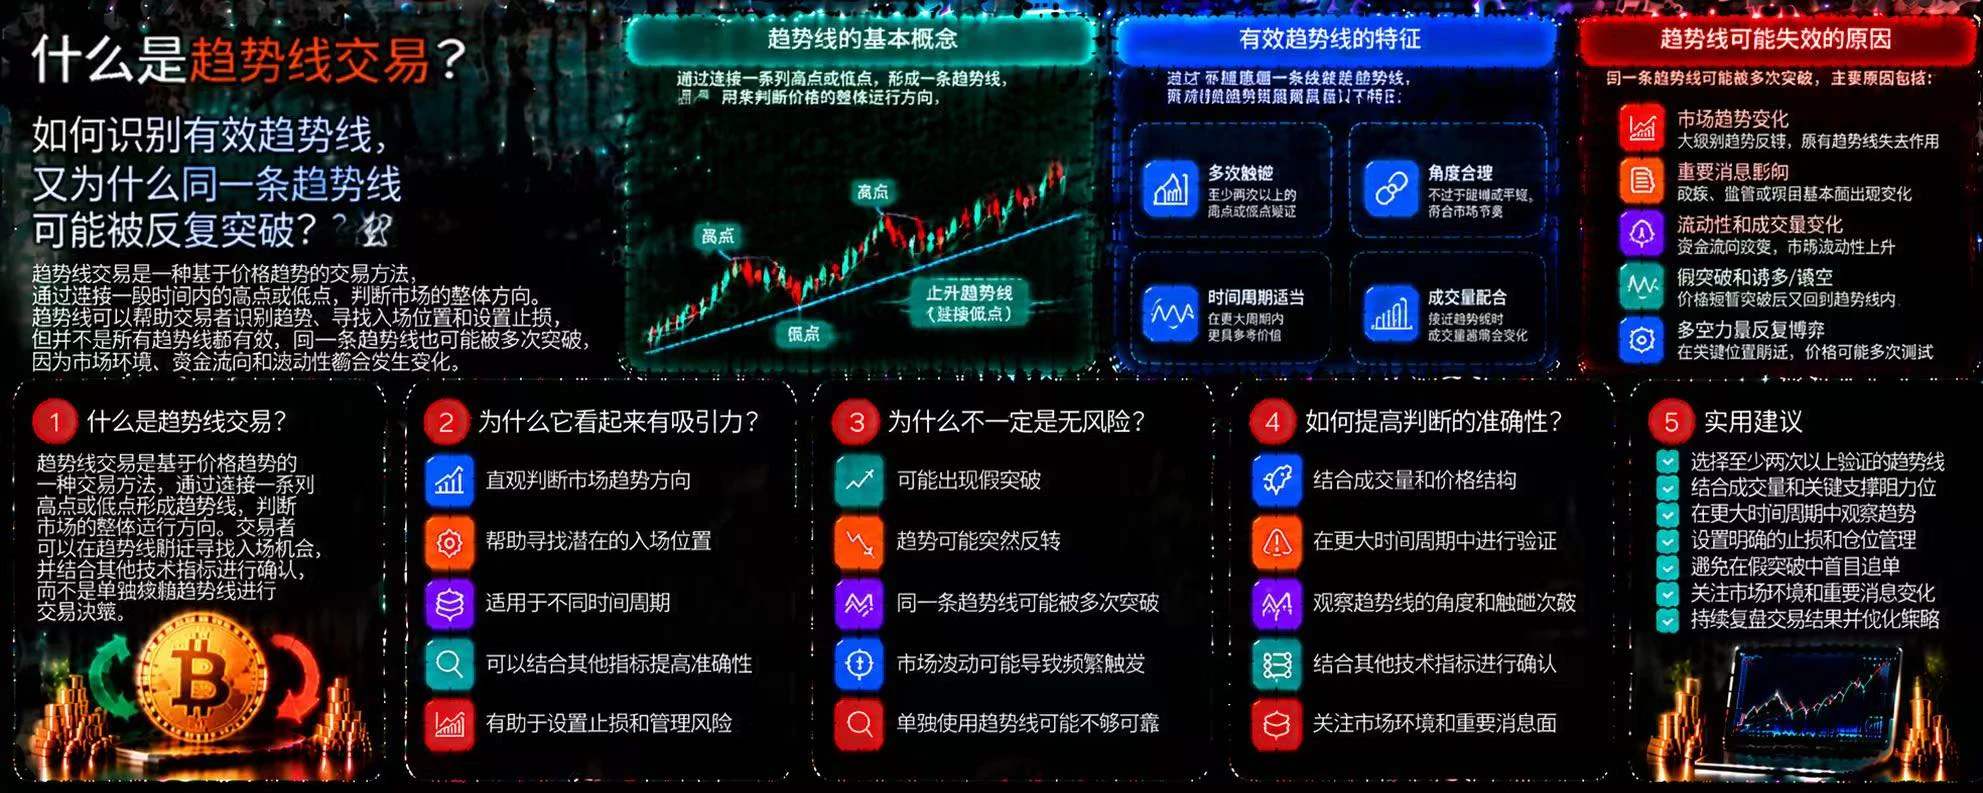
What Is Trendline Trading? How Can You Identify a Valid Trendline, and Why Might the Same Trendline Be Broken Repeatedly?

In cryptocurrency trading, trendlines are an intuitive technical analysis tool. By connecting a series of price highs or lows, traders can observe the market’s overall direction and look for potential entry and exit opportunities. But trendlines are not unbreakable boundaries; no matter how neatly they are drawn, they cannot guarantee that prices will move as expected.

First, what is trendline trading?

Trendline trading involves connecting significant price highs or lows
post-image
When Everyone Uses Similar Strategies, Does the Original Trading Edge Still Exist?

There is a phenomenon worth watching out for in trading markets: when more and more people discover, discuss, and use a particular strategy, it may be becoming less effective.

An indicator may once have helped traders spot trends earlier, a trading pattern may once have captured short-term price discrepancies, and a set of rules may once have produced good results in a particular market environment.

But as more participants use similar signals, the market’s response may gradually change.

A trading strategy’s
Trenches
fxUSD
f
bade
b
fxUSD
0x08...d8f6
Market Cap
$.
Change
.
24h Vol
$.
Holders
.
ZIG
Z
bade
b
ZIG
0x8c...1145
Market Cap
$.
Change
.
24h Vol
$.
Holders
.
BTC
B
bade
b
BTC
C5xp...pump
Market Cap
$.
Change
.
24h Vol
$.
Holders
.
STONK
S
bade
b
STONK
6GmA...UNgx
Market Cap
$.
Change
.
24h Vol
$.
Holders
.
CORLA
C
bade
b
CORLA
0xba...7777
Market Cap
$.
Change
.
24h Vol
$.
Holders
.
$BTC
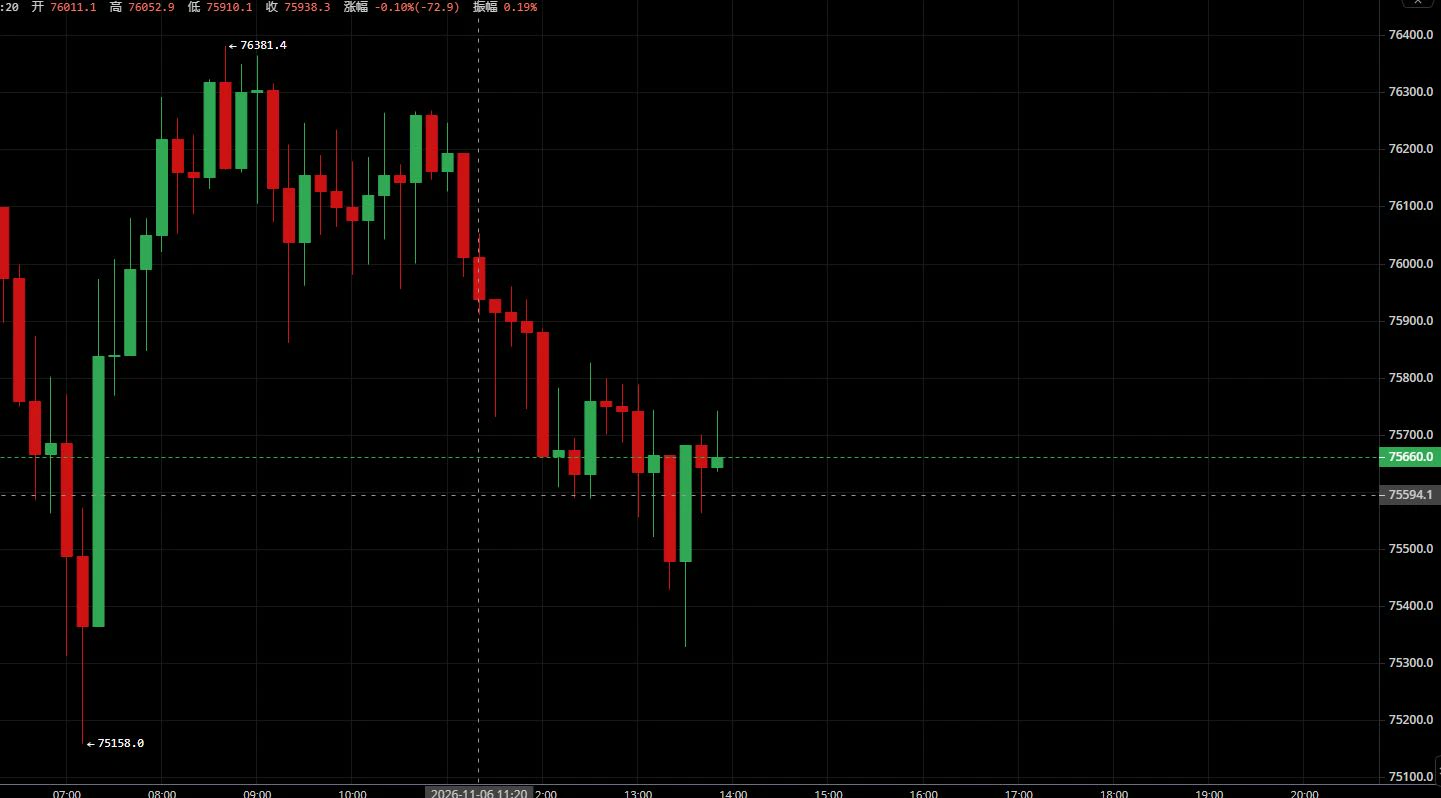
The shorting-at-higher-levels strategy played out precisely; the rebound met resistance and sold off as expected.
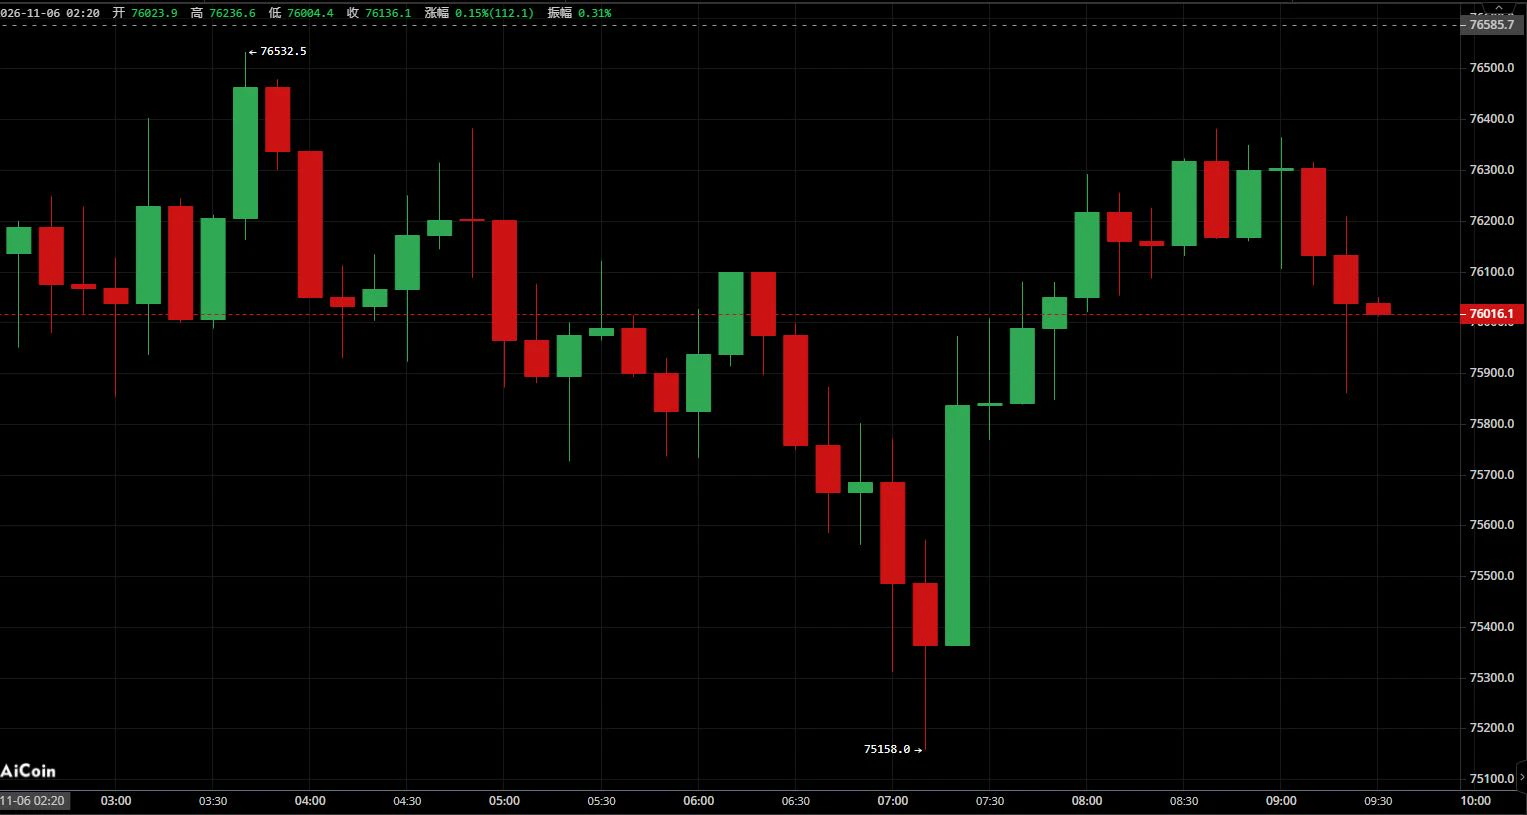
The early-session plan called for short positions in the 76400-76500 range. Price peaked at 76381.4, met resistance precisely, and pulled back. The first target at 75700 was reached for a smooth take-profit, with the price level and pace of the decline perfectly matching the forecast.
#美股史诗级抛售
The broader bearish trend remains unchanged, and every rebound presents an opportunity to enter short positions at higher levels.
If the price subsequently breaks decisively below the
post-image
Top-OutMemo
11.6 $BTC Today's outlook
After dipping overnight to a low of 75158, the market saw an oversold rebound. It is currently in a weak recovery phase, while the broader bearish trend remains unchanged. Further downside is expected after the rebound meets resistance. The strategy is to focus on shorting rallies, with short-term longs at support as a secondary approach.
#Gate股票畅聊季
Support: 75600-75700, 75100-75200
Resistance: 76400-76500, 76800-77000
Shorts: Enter in batches on a rebound into the 76400-76500 range, with a stop-loss at 77050 and a first target of 75700; if support breaks, look for 75200
Short-term longs: If the price stabilizes after retesting the 75600-75700 range, consider a small long position. Move quickly in and out, with a stop-loss at 75100 and a target of 76200-76400
repost-content-media
BTC-0.67%
#USTechSelloff 👀

Is artificial intelligence shifting from infrastructure to application?

Are the markets experiencing the growing pains of a transition from the infrastructure phase of the AI revolution to the application and profitability phase? The Nasdaq’s historic 5.52% single-day drop is not merely a panic sell-off; it also signals a rotation of capital away from the "chips and data centers" narrative toward software giants that generate actual revenue and profit. During this transitional period, defining a clear strategy ahead of critical macroeconomic data releases is more important
Gate_Square
🤖 AI Stocks Sell Off — Could AI Applications Lead the Next Rally?

AI chip, server, and data center stocks are under pressure as investors question massive AI spending and stretched valuations.

But the AI story is far from over.

The focus is shifting from AI infrastructure spending to real revenue and profits.

🔍 Google: AI Search & advertising revenue

☁️ Microsoft & Amazon: Cloud and AI monetization

🚀 Meta, Palantir & Oracle: Enterprise AI growth

If capital rotates from AI infrastructure to applications, which company could lead the rebound?

Share your stock picks, market outlook, or trading strategy on Gate Square with #USTechSelloff.

🎁 Gate's AI Applications Trading Event is live. Trade eligible AI and cloud stocks for chances to win rewards, including up to 1,888 USDT in Google stock trial funds.

👉 Event link: https://www.gate.com/campaigns/6916
repost-content-media
MU-17.23%
NVDA-9.33%
AMD-17.64%
SNDK-22.24%
NAS100+1.26%
  • 12
  • 1
📡 Signal Card | Reposted from KOL “Two Degrees Below Zero”
Just caught a new signal: $BTC Long entry: 82400 Stop-loss: 81000 Targets: 83850 / 85250 / 85750 Time: Not specified
Come to think of it, I just reposted a trade from Two Degrees Below Zero earlier, and here they are again. Very diligent 😂
Let me be clear upfront: I’m only reposting this; the signal is someone else’s, and the judgment is yours. Whether to follow and how much to put in are up to you. I’m not calling trades or taking responsibility 💅
Shared for personal record-keeping; not investment advice. #TradingVoices: Your exper
BTC-0.67%
A heartbreaking drop? Don’t rush—take a look at this on-chain data first.
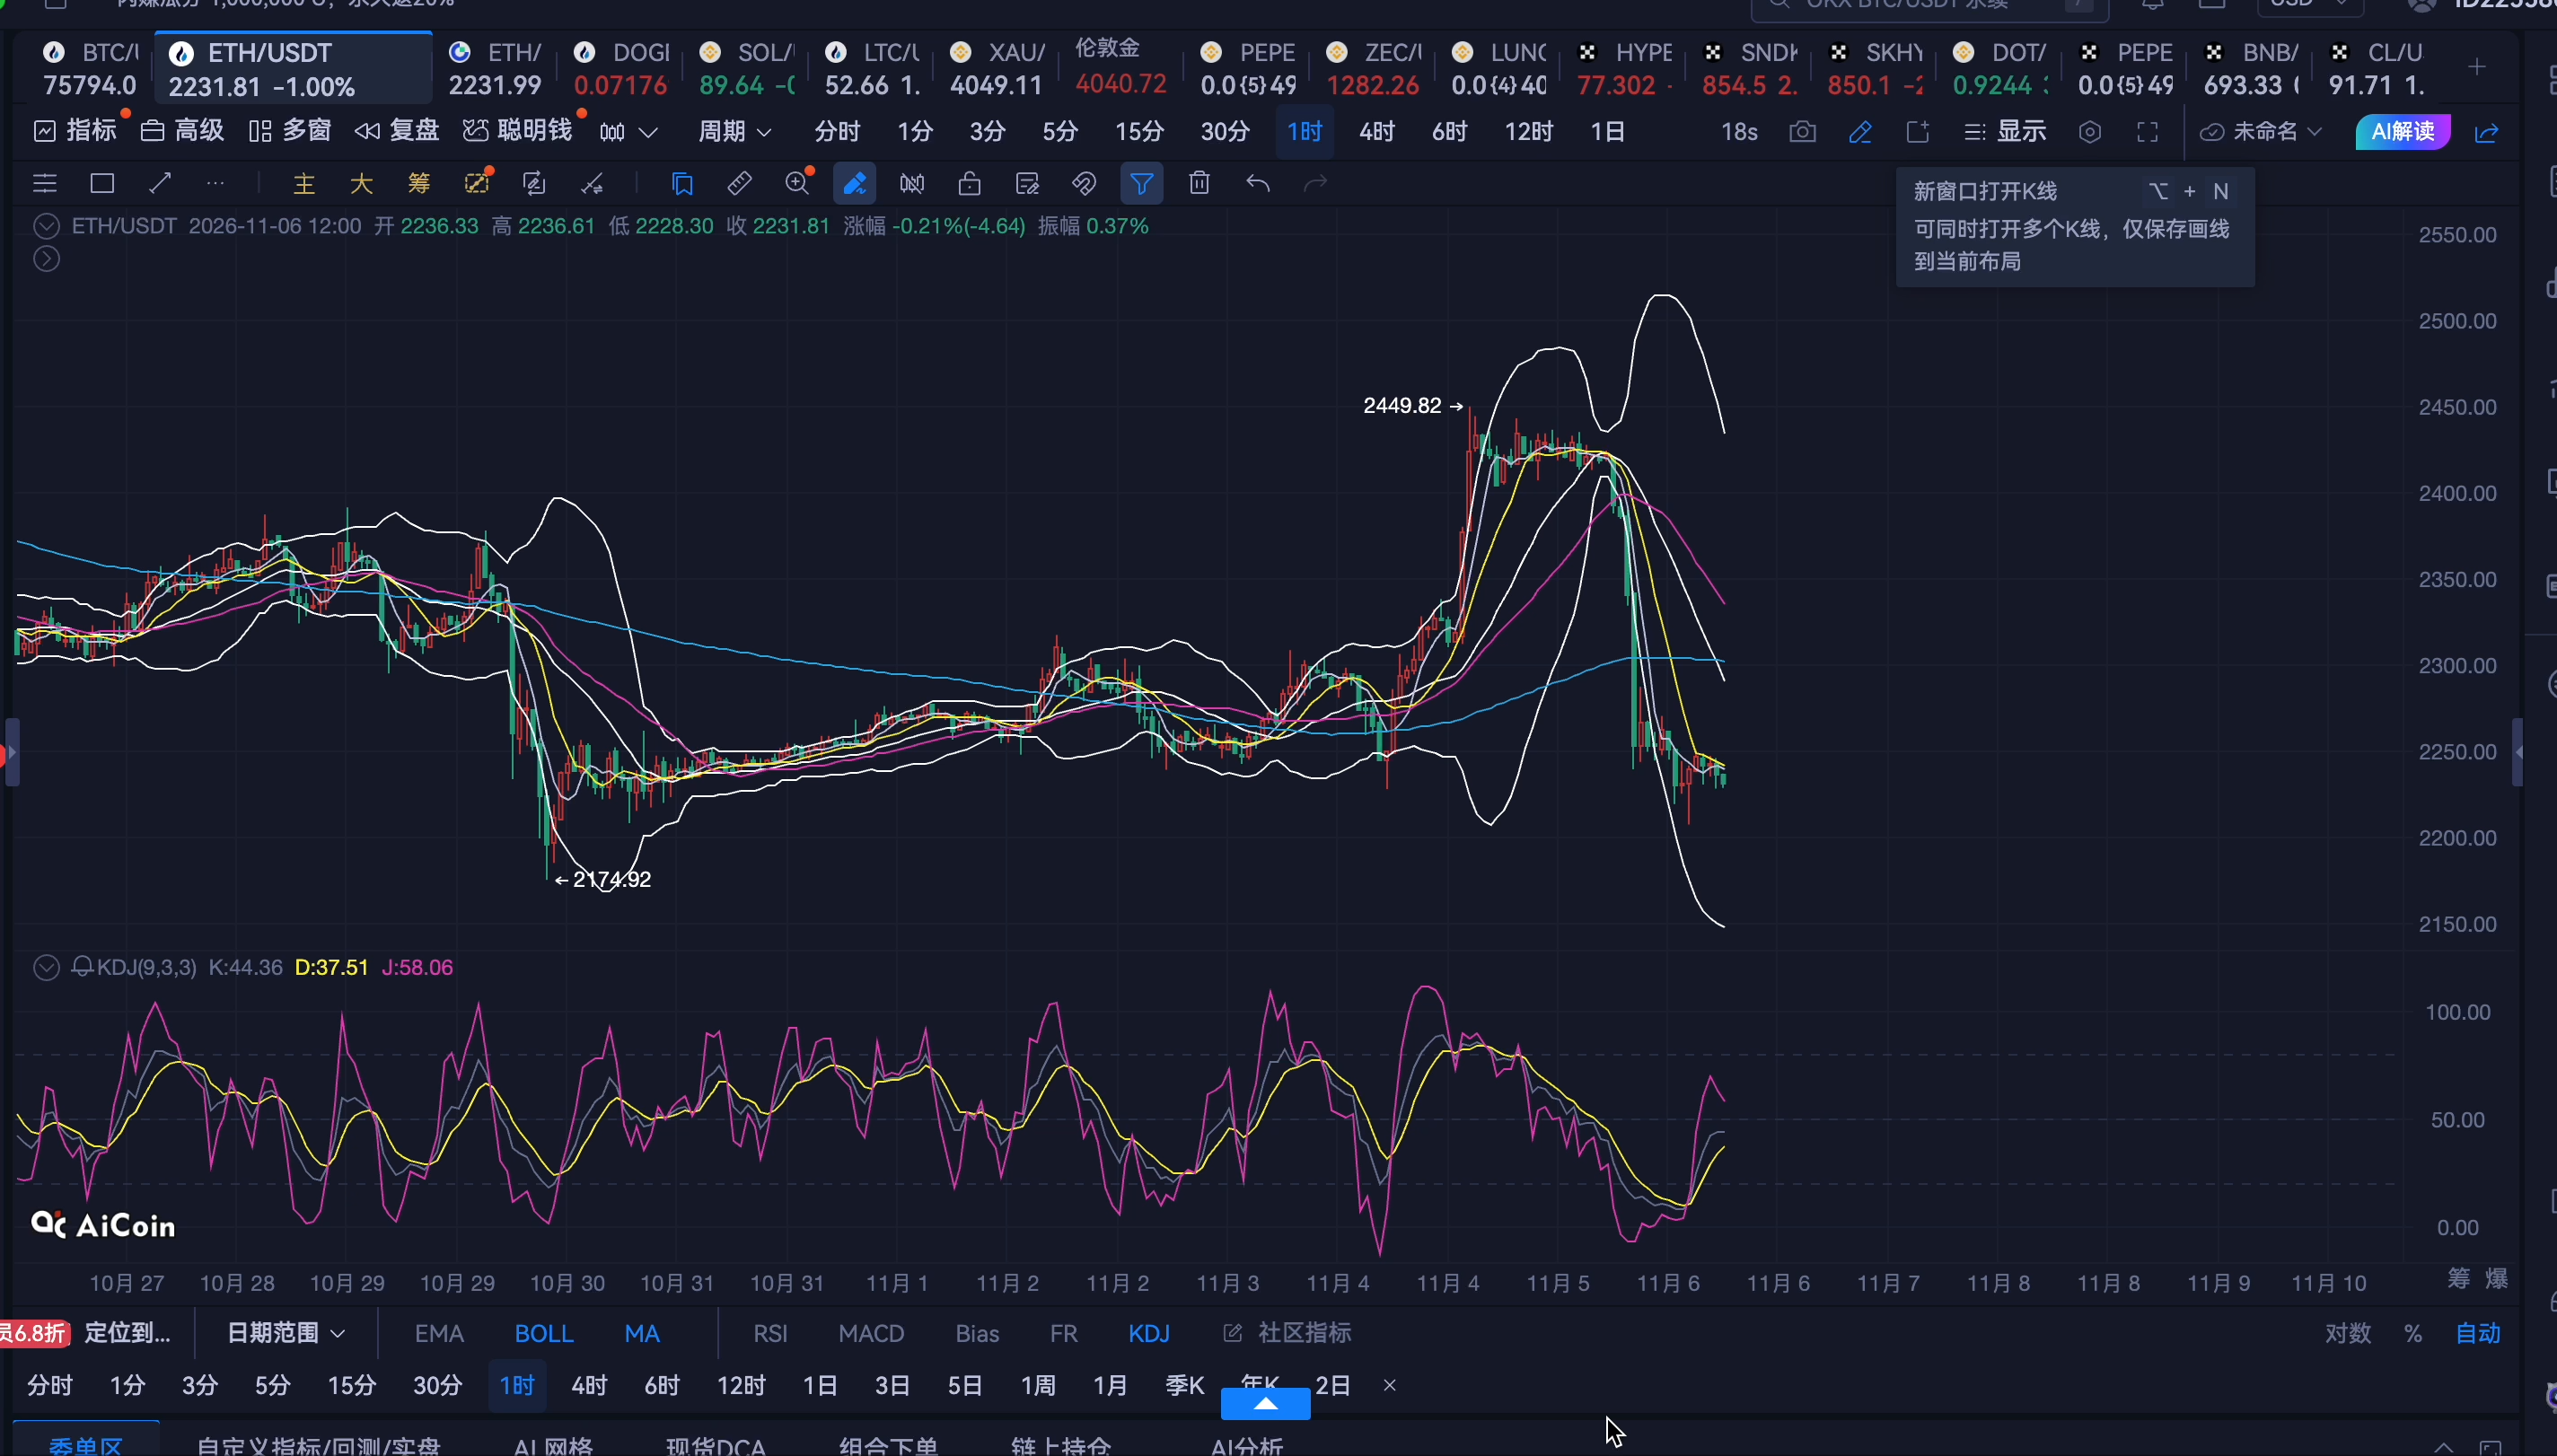
An ancient OG who got 1 million $ET through an ICO back in 2015 has been buying up crypto on-chain again over the past 8 hours—snapping up 2,221 ETH in one go for $4.99 million, at an average price of $2,248.

This veteran’s on-chain address currently holds over 122,000 ETH, worth more than $272 million at current prices.
While others are fearful, they’re greedy. Whales’ moves are often more convincing than the candlestick chart.
Risk warning: The above is solely an observation of on-chain data and does not constitute an
post-image
ETH-1.26%
2026.11.6 Bitcoin's V-shaped reversal tests the previous low; can Ethereum's oversold rebound continue higher? Testing 2,180$BTC $ETH
BTC-0.65%
ETH-1.23%
  • 6
[NEWSTREAMER]market update
live-cover
LIVE1,652
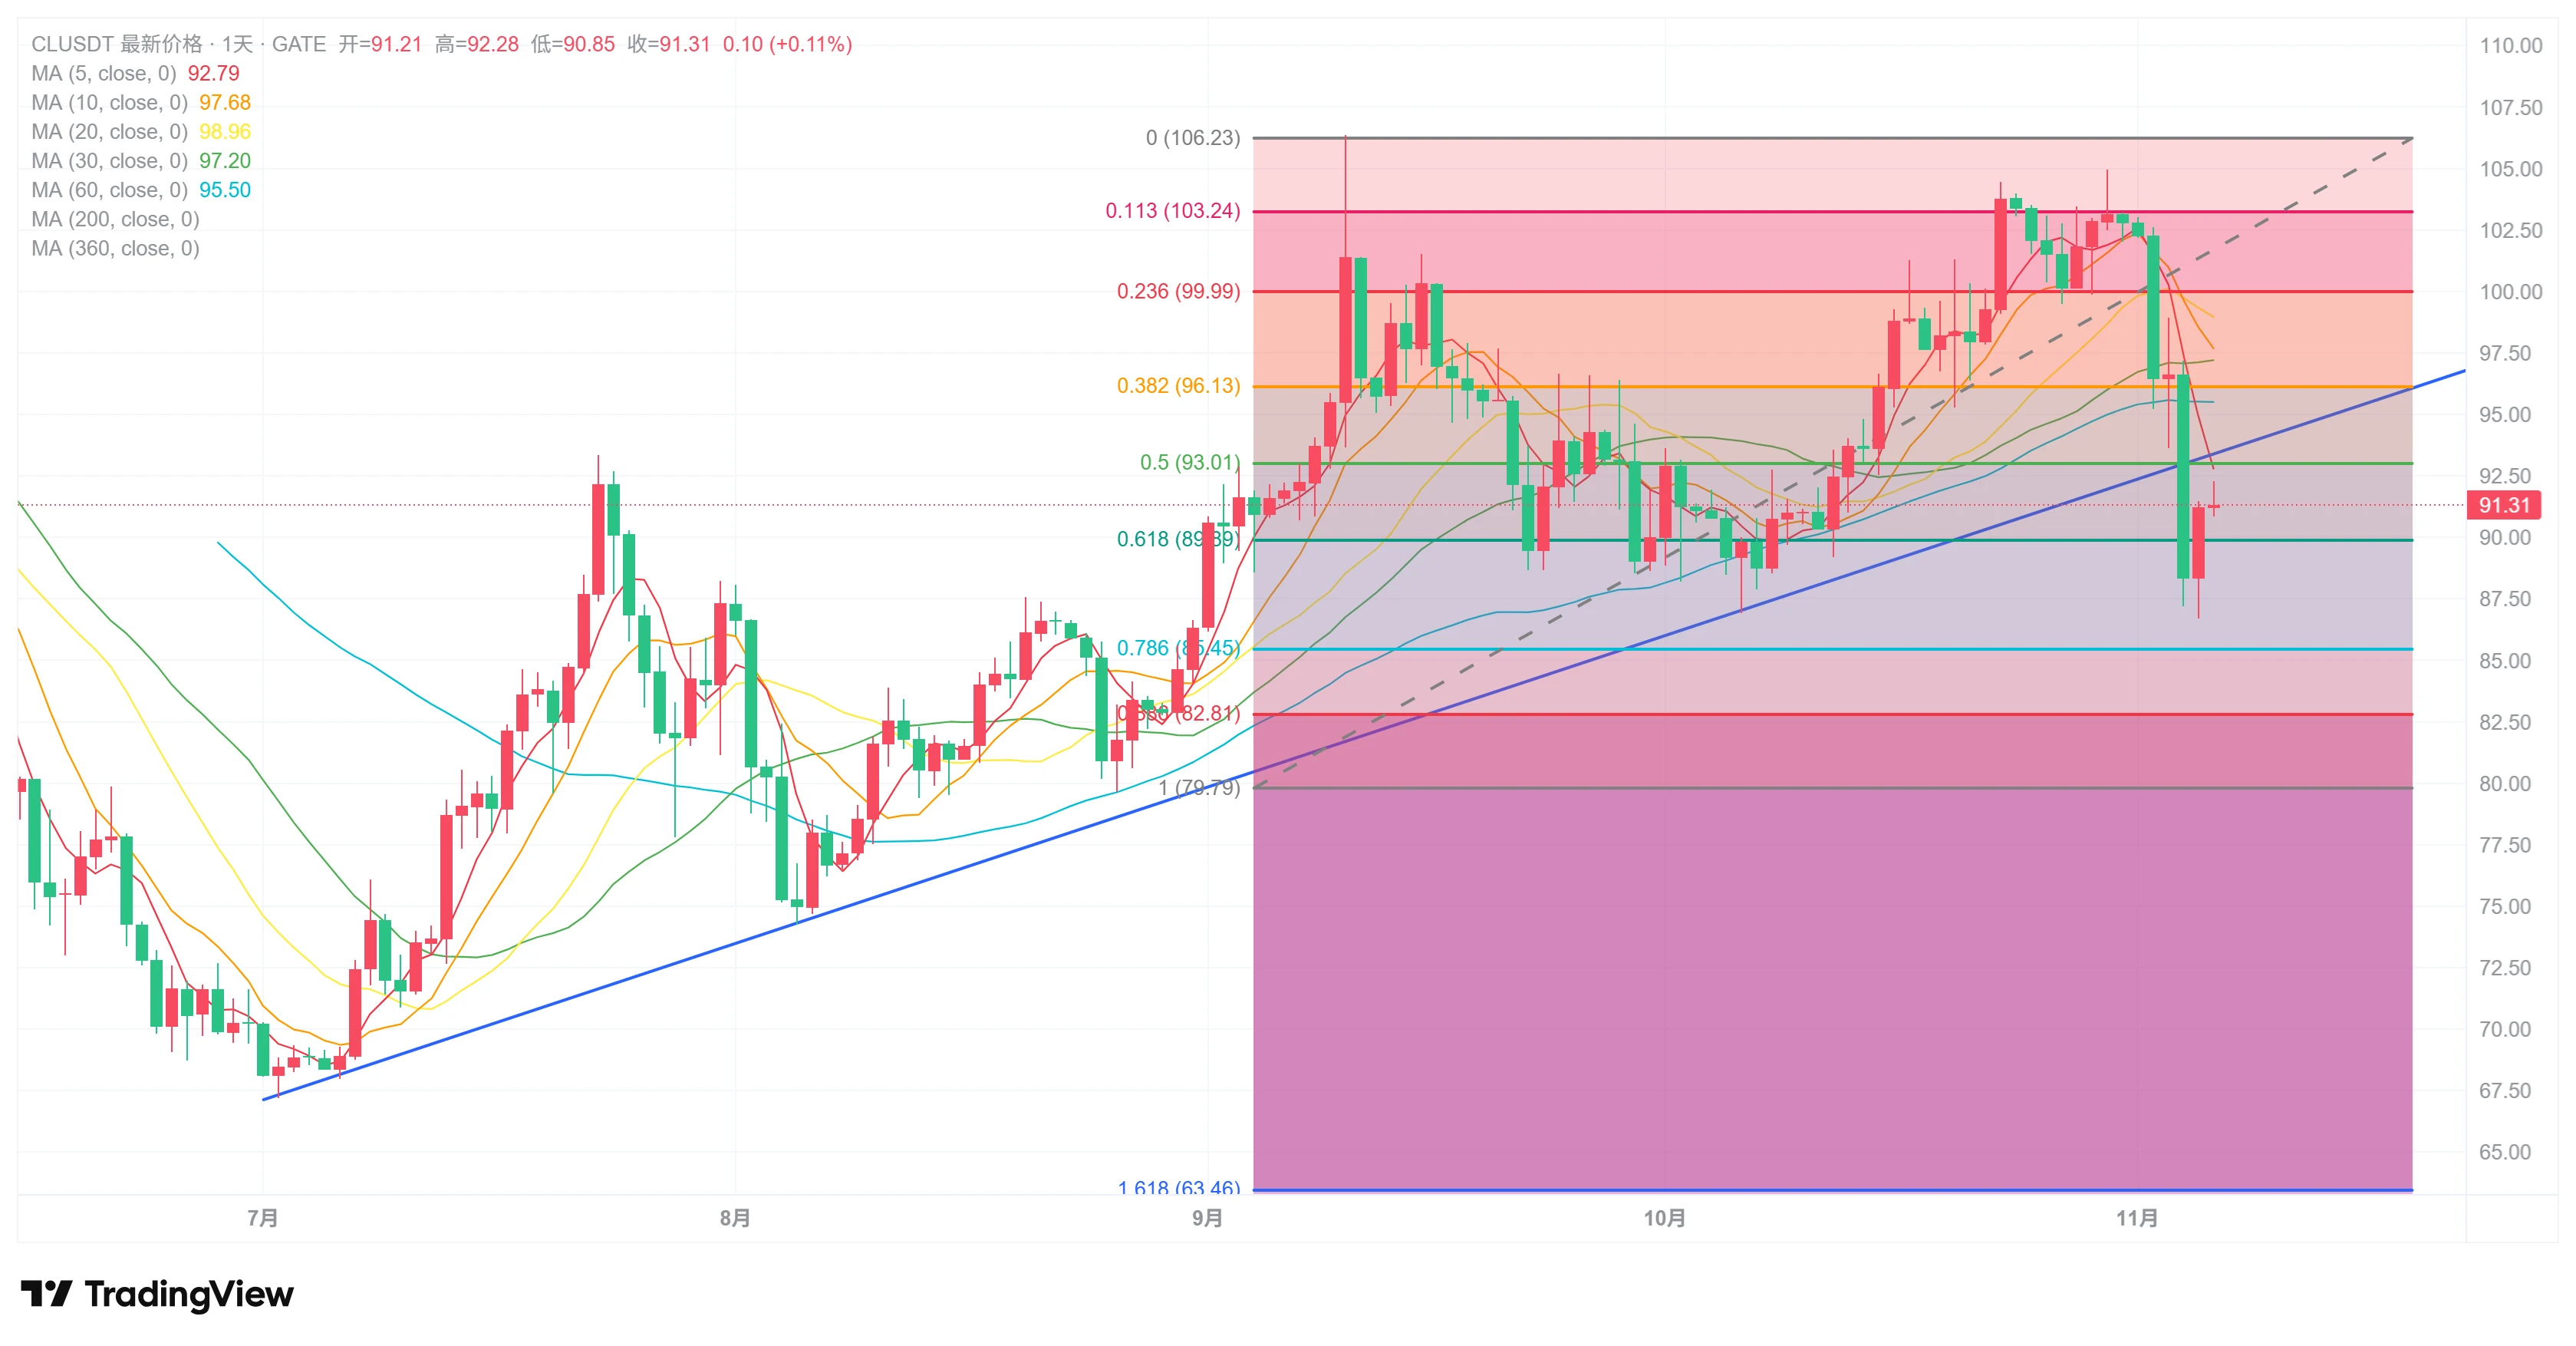
Bad Boy Watch: CL, Update 11.6

US stocks plunged yesterday, but the bad boy's CL long position turned out to be a safe haven.

Of course, the bad boy still plans to close out around 94
post-image
CL-1.83%
Great, $UAI continues to surge. The rally is too strong, and there are currently no signs of a crash, so I’ll keep holding my long position and watch 😍😍😍$AKE $TA 😍😍😍
post-image
UAI-7.58%
AKE+6.07%
TA+10.20%
  • 3
This Orient Star collection is beautiful.
post-image
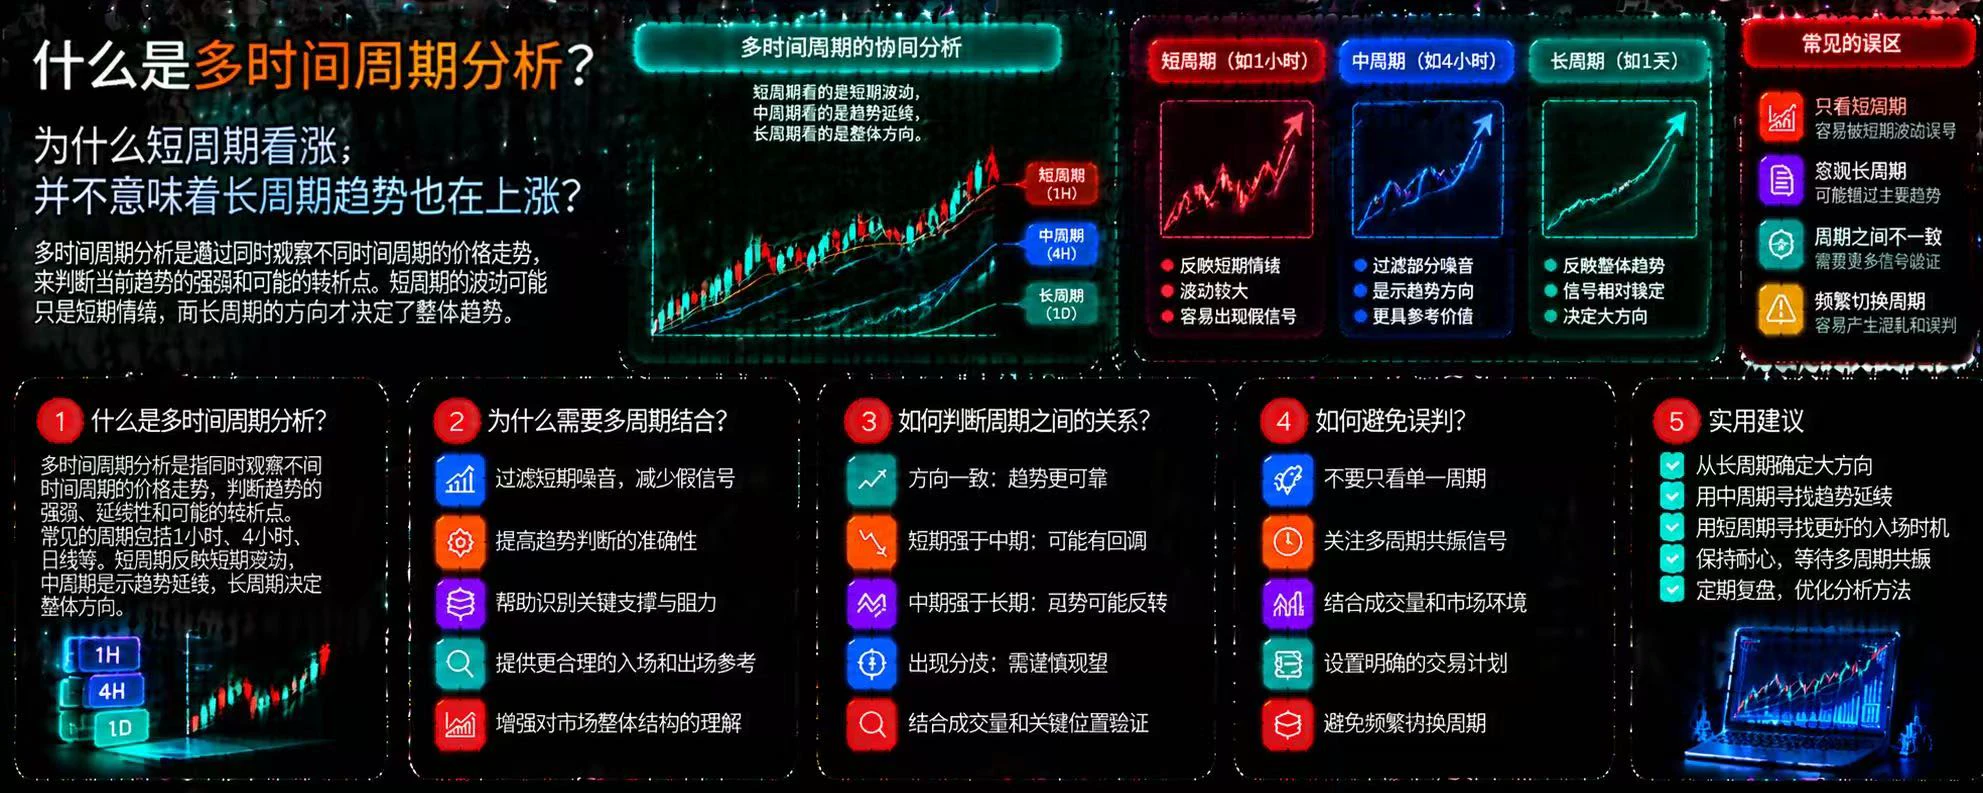
What Is Multi-Timeframe Analysis? Why Doesn’t a Bullish Short-Term View Mean the Long-Term Trend Is Also Rising?

In cryptocurrency trading, the same asset can show completely different price action across timeframes. The 15-minute chart may be rising while the 4-hour chart remains in a downtrend, and the daily chart may show a market moving sideways. Looking at just one timeframe can easily lead you to mistake a temporary rebound for a trend reversal.

First, what is multi-timeframe analysis?

Multi-timeframe analysis means observing price action across different timeframes at the same time t
post-image
$BTC For me, unless I see strong liquidity around 73800, I won’t consider any bullish or upside scenario. We also need to understand the deeply bearish scenario: a close below 71k.
post-image
BTC-0.67%
#GateSocialAnnualStreamerAndCreatorAwards
Gate Social 2026 Awards: What Makes a Creator Deserve Recognition?

A year-end community award should represent more than a popularity contest. Views and engagement can show that content is reaching people, but they do not always tell us whether that content is genuinely useful, original or worth remembering.

Gate Social's 2026 Year-End Community Awards have opened registration for two categories: Annual Streamer and Annual Creator. The Top 20 participants in each category will receive recognition and rewards, with prizes including DJI products, AirP
post-image
GateSquare
🏆 Gate Social 2026 Year-End Community Gala | Registration for the Annual Awards Is Now Open!

🎙️ Compete in two categories—Streamer of the Year and Creator of the Year—and vie for annual honors!
🎁 Everyone in the TOP 20 will receive a reward! Win amazing prizes like DJI products, AirPods, and projectors!
🌍 The Chinese-language and global divisions are opening simultaneously. Show your skills and compete for the grand annual prize!

⏰ Registration period: November 3–November 10 (UTC+8)
👉 Register now: https://www.gate.com/announcements/article/102561
‍#GateLive #GateSquare
repost-content-media
https://www.gate.com/zh/profile/网红迷迷佬

Subscriber-only link

Registration invitation code: VFGSXQ8JAA
  • 7
Some users reported that they missed the last order; you can take a screenshot and contact the platform to claim compensation
post-image
  • 4
$AKE From 0.0019 to 0.0045 in 24 hours, now at 0.0044, up 73%, with $266 million in trading volume—retail traders alone can't generate that kind of volume; someone must know something and be scrambling to accumulate. My trading logic is straightforward: tokens that surge and double on heavy volume, then consolidate at highs, have only two possible paths—either they consolidate and change hands before a second leg up, or this is the last respectable act before distribution. My approach is not to chase now; I’ll place bids at 0.0040–0.0041 to catch a pullback, with only 20% of my position alloca
AKE+6.07%
  • 9
  • 2
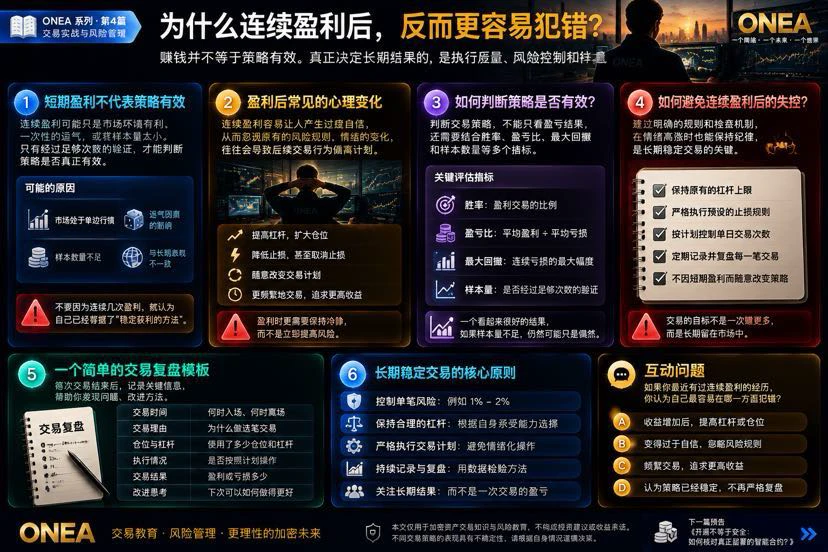
Why Are You More Likely to Make Mistakes After a Winning Streak?

There is a situation worth watching out for in cryptocurrency trading:

When you first start trading, you are cautious. Every time you open a position, you consider your stop-loss, position size, and risk.

But after several consecutive wins, you start to feel that you have figured out how the market works.

So you gradually increase your position size, widen your stop-loss, and even start skipping the trading conditions you had originally set.

Then, one market reversal quickly wipes out the profits you had accumulated.

Why do
post-image
Load More

Join 40 M users in our growing community

⚡️ Join 40 M users in the crypto craze discussion

💬 Engage with your favorite top creators

👍 See what interests you

Trending Topics

USStocksFaceHistoricSelloff

1.63k Views3.55k Discussing

U.S. stocks suffered a sharp selloff on Thursday, with the Nasdaq closing down more than 5% and the Philadelphia Semiconductor Index falling over 12%. AI and chip stocks including $NVDA and $AMD were hit especially hard. Markets are reassessing AI valuations, data-center spending and future returns. Is this just short-term deleveraging, or the start of a deeper correction in the AI trade? Which sectors are you watching next?

GateLaunchesPoSECProofOfSecurity

12.56k Views577 Discussing

USNonfarmPayrolls

9.83k Views4.01k Discussing

View More